Subcellomics Creative Proteomics

Nanoparticle Tracking Analysis for Exosome Characterization: Size, Concentration & Marker Profiling

Quantitative Profiling of Secreted Proteins for Cell Communication and Biomarker Discovery

NTA Service Advantages Workflow and Platform Sample Requirements Deliverables How to ChooseFAQ Get a Custom Proposal

What Is NTA-Based Exosome Identification

Nanoparticle Tracking Analysis (NTA) is a high-resolution technique for the characterization of extracellular vesicles (EVs), including exosomes, based on particle-by-particle tracking in liquid suspension. It enables absolute quantification and size distribution analysis, offering critical insights for R&D, formulation development, and process monitoring.

Creative Proteomics leverages NTA technology to deliver actionable metrics such as particle concentration (particles/mL), modal diameter, D10/D50/D90, and—via fluorescence labeling—marker-specific subpopulation detection (e.g., CD9⁺/CD63⁺/CD81⁺ EVs). This makes NTA especially valuable for users validating isolation methods, assessing sample integrity, or benchmarking EV-enriched preparations.

How Nanoparticle Tracking Analysis Works in Exosome Profiling

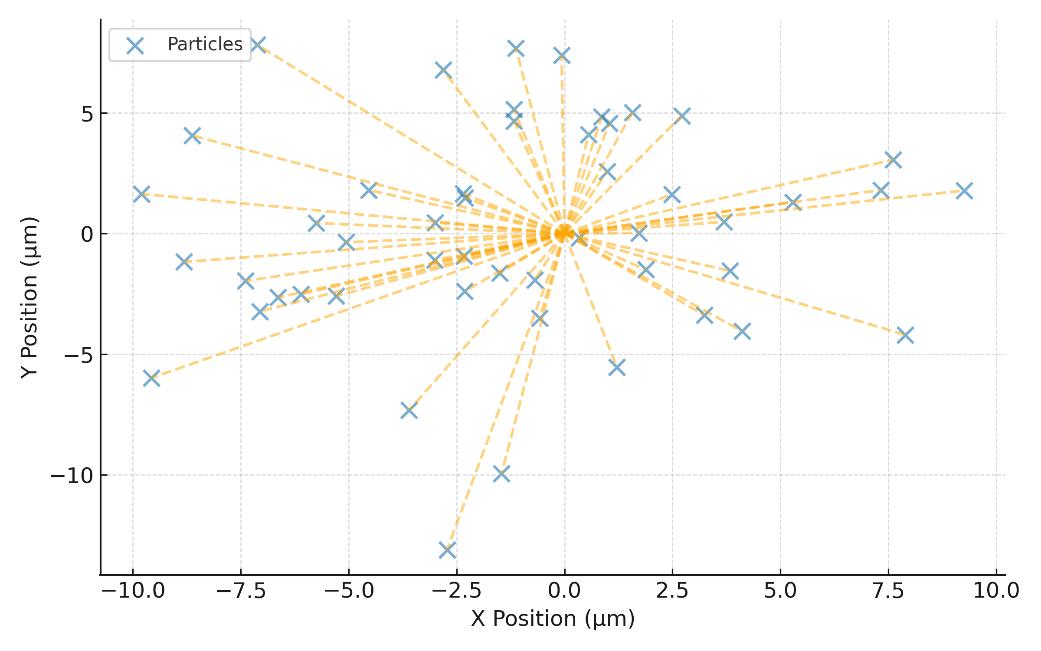
NTA is based on the principle of Brownian motion, where particles suspended in a fluid exhibit random motion. A laser beam illuminates the sample, and a sensitive camera captures the light scattered by each particle as it moves within a defined observation volume.

The software tracks multiple particle trajectories in real time and calculates their hydrodynamic diameter using the Stokes-Einstein equation, which relates particle displacement to size. This enables simultaneous sizing and counting of individual particles with high precision.

Because NTA analyzes particles individually, it can resolve polydisperse and heterogeneous populations, which are common in EV preparations. Two operational modes are typically used for exosome analysis:

  • Brightfield (Conventional) NTA – Measures size and concentration of all detectable particles.
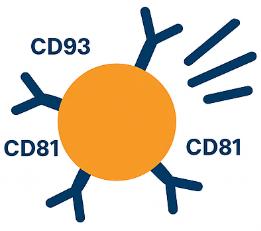
  • Fluorescence NTA (fl-NTA) – Tracks only particles labeled with fluorescent markers, allowing for surface-marker-specific profiling (e.g., CD63⁺ vesicles).

What's Included in Our Exosome NTA Service

Particle Size and Concentration Analysis (Brightfield NTA)

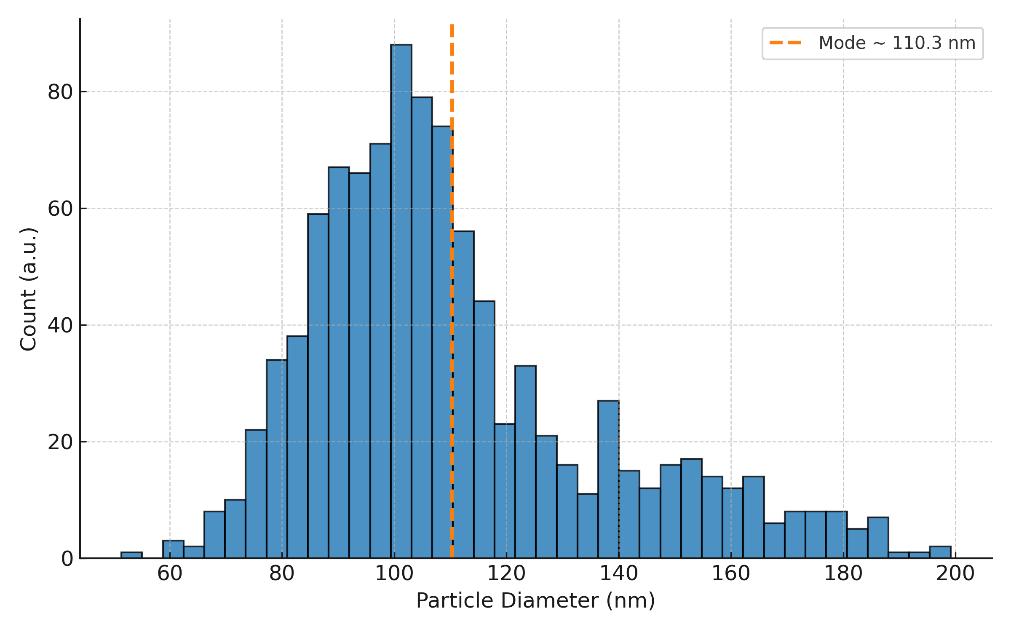
  • Measures hydrodynamic diameter (mean, mode, D10/D50/D90)
  • Provides absolute particle concentration (particles/mL)
  • Generates size distribution histograms
  • Performed with multiple replicates for statistical reliability

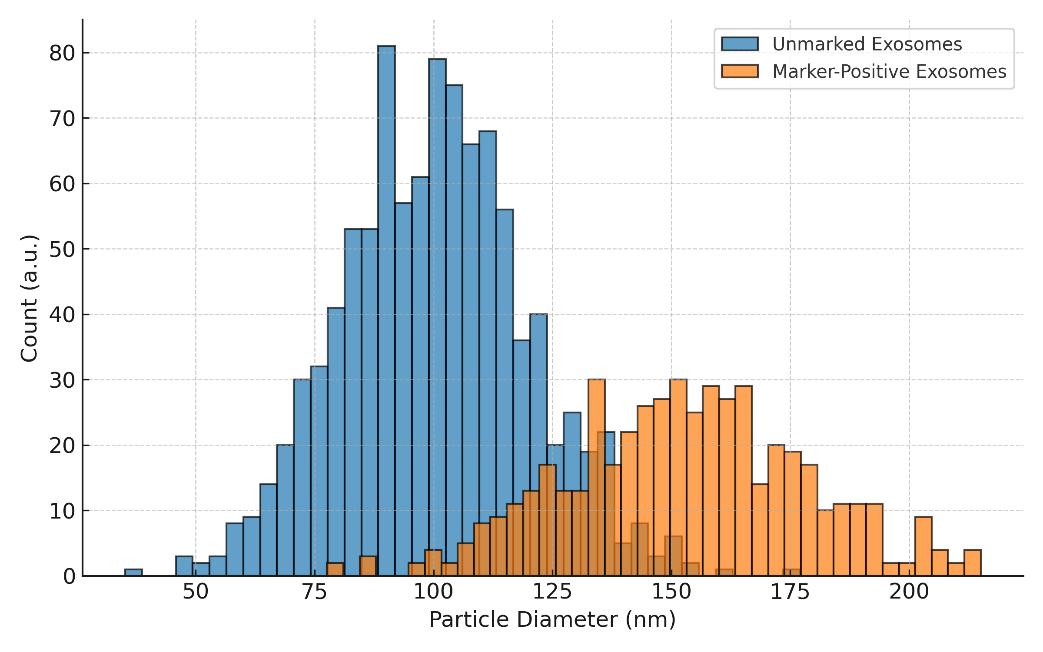
Fluorescent NTA for Marker-Positive EV Subsets

  • Detects CD9⁺, CD63⁺, CD81⁺ or other fluorescently labeled exosome populations
  • Compatible with multiple laser channels (405, 488, 532, 640 nm)
  • Supports antibody or dye-based labeling
  • Includes negative/isotype control validation
  • Delivers subpopulation-specific size and count metrics

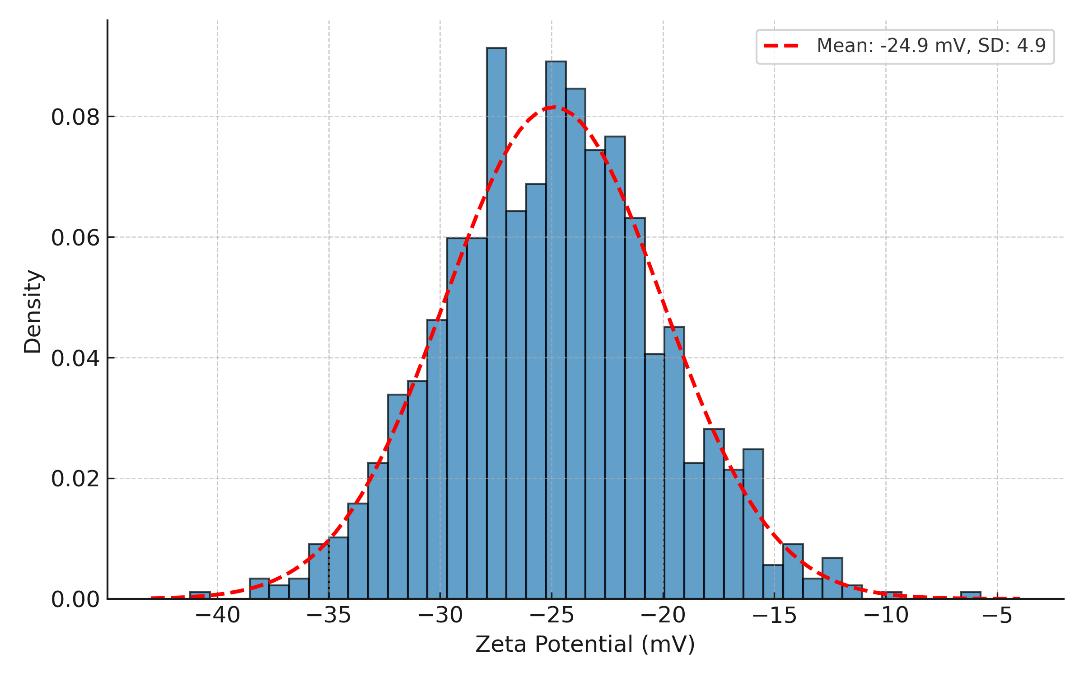
Zeta Potential Measurement

  • Evaluates surface charge (ζ-potential) of exosomes
  • Useful for stability assessment, formulation screening, and colloidal behavior profiling

Advantages of Our NTA Service

High-Precision Quantification

Accurate exosome concentration reporting with ±10% variance across replicates, ensuring reliable batch-to-batch comparison.

Validated Replicability

Every sample is measured in triplicate video recordings with strict QC checks, reducing variability and enhancing reproducibility.

Single-Particle Resolution

Detects particles as small as 30 nm, capturing size heterogeneity that bulk techniques like DLS cannot resolve.

Calibrated and Standardized Workflow

Instruments calibrated with traceable nanoparticle standards ensure consistent sizing and concentration results across different runs and projects.

Fluorescence-Enabled Specificity

fNTA supports up to 4 excitation channels (405/488/532/640 nm) for simultaneous detection of marker-positive exosomes (e.g., CD9, CD63, CD81).

Decision-Ready Data Packages

Clients receive publication-quality plots, structured datasets (CSV/JSON), and optional raw videos, making results integration-ready for R&D, QC, or publication.

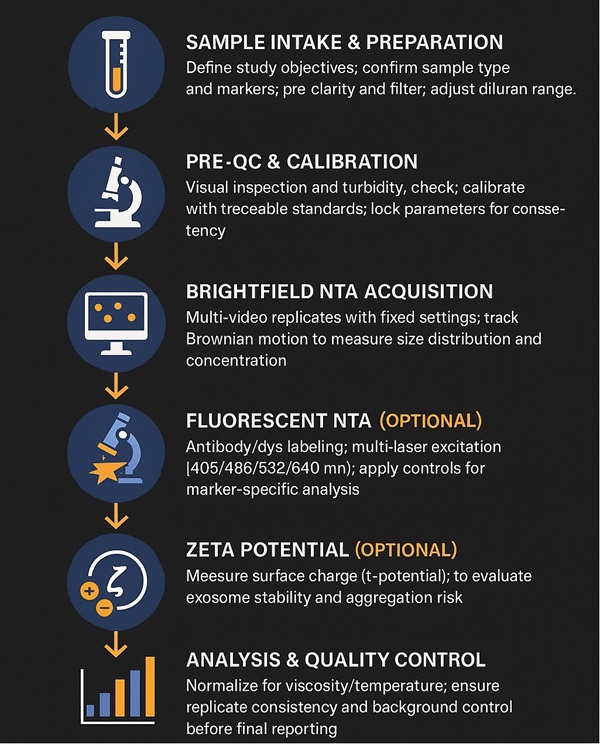
Exosome Characterization Workflow Using Nanoparticle Tracking Analysis

1

Sample intake & prep

Confirm matrix/isolation/markers; pre-clarify and 0.22 µm filter; set dilution window.

4

Fluorescent NTA (optional)

Antibody/dye labeling; 405/488/532/640 nm channels; negative/isotype controls; marker-positive counts and size profiles.

2

Calibration & parameter lock

Traceable bead standards; lock camera level, detection threshold, temperature, and viscosity correction.

5

Zeta potential (optional)

Surface charge (ζ-potential) to inform stability and formulation decisions.

3

Brightfield NTA acquisition

Multi-video replicates; Brownian tracking to report concentration (particles/mL), mode, D10/D50/D90, and size histograms.

6

QC & reporting

Replicate agreement, dilution validity, background/artifact control; deliver PDF + CSV/JSON (raw videos/plots on request).

Nanoparticle Tracking Analysis Platform & Technical Specifications

Technical Specifications Optimized for Exosome Analysis

Parameter Specification Details
Particle Size Range ~30–1000 nm EVs optimally resolved from ~50–300 nm
Input Concentration 1×10⁷–1×10⁹ particles/mL Dilution adjusted to maintain linearity
Fluorescence Channels 405, 488, 532, 640 nm (instrument-dependent) Suitable for dyes & antibodies (e.g., CD63-Alexa488)
Zeta Potential (Optional) ±125 mV Surface charge profiling for formulation projects
Temperature Control 20–40 °C Drift- and viscosity-corrected analysis
Output Formats CSV, JSON, PNG, PDF Report + raw data available

Platform Highlights

  • Wide Particle Detection Range: Capable of resolving nanoparticles from 30 nm to 1,000 nm, covering exosomes, microvesicles, and protein aggregates.
  • Real-Time Video Tracking: Direct visualization of Brownian motion, enabling particle-by-particle measurement instead of bulk averages.
  • Multi-Laser Fluorescence Support: Equipped with 405, 488, 532, and 640 nm excitation channels, enabling optional marker-specific detection via fluorescent dyes or antibody conjugates.
  • Zeta Potential Option: Extendable to surface charge analysis, providing additional insights into sample stability.
  • Temperature Control: Built-in 20–40 °C regulation, ensuring consistent measurements across varying sample conditions.
  • Flexible Sample Input: Supports small sample volumes (≥500 µL), compatible with diverse biological matrices such as plasma, serum, or conditioned media.

Sample Requirements for NTA-Based Exosome Identification

Requirement Details
Accepted Sample Types Conditioned Media, Serum/Plasma, Urine/CSF, Purified EV Fractions, Other Biological Fluids (contact us for custom analysis)
Sample Volume Minimum 500 µL per sample for full analysis (Brightfield NTA + optional Fluorescent NTA). Larger volumes required for higher concentration samples or batch studies.
Sample Preparation Pre-clarification (optional 0.22 µm filtration); Dilution for optimal particle count (20–100 particles/frame)
Storage Store at 4°C for up to 24 hours; For longer storage, snap freeze and ship on dry ice
Shipping Instructions Ship with cold packs or dry ice. Avoid freeze-thaw cycles. Ensure samples are well-packed for temperature stability.
Additional Notes Provide a sample information sheet detailing sample type, matrix, isolation method, and any specific conditions for analysis. If using fNTA, provide antibodies/dyes used for labeling.

What You'll Receive

  • Comprehensive report: Objectives, methods, sample details, instrument settings, and QA summary.
  • Quantitative results: Concentration (particles/mL), modal diameter, D10/D50/D90, full distributions.
  • Fluorescent metrics (if selected): Marker-positive concentration, fraction of total, size profiles of labeled subpopulations.
  • Data packages: CSV/JSON exports; raw videos on request; figure-ready PNG/PDF plots.
Exosome size distribution histogram illustrating particle size range and modal diameter.

Size Distribution Histogram

The size distribution histogram displays the particle size range of exosomes, highlighting the modal diameter and size distribution within the sample.

Particle concentration and tracking snapshot showing particle movement and concentration distribution.

Particle Concentration & Tracking Snapshot

This snapshot illustrates particle concentration and real-time particle tracking, showcasing the movement paths of individual particles during NTA analysis.

Fluorescence NTA histogram comparing marker-positive exosome population and unmarked exosomes.

Fluorescence NTA Histogram (Marker-Positive)

The fluorescence NTA histogram compares the size distribution of marker-positive exosomes (e.g., CD63+) with unmarked exosomes, demonstrating the specificity of fluorescence labeling.

Zeta potential distribution curve showing surface charge (ζ-potential) of exosomes.

Zeta Potential Distribution

The zeta potential distribution curve illustrates the surface charge of exosomes, providing critical information about their stability and potential aggregation risk.

NTA vs Other Techniques – Which Is Right for You?

Criteria NTA (Nanoparticle Tracking Analysis) DLS (Dynamic Light Scattering) SDS-PAGE Western Blot Flow Cytometry
What does it measure? Particle size (30–1000 nm), concentration, distribution Average particle size, hydrodynamic diameter Protein profile Specific protein markers (e.g., CD9, CD63) Marker-positive exosome subpopulations
When to use it? For accurate size distribution and concentration For quick estimation in homogeneous samples For general protein composition For confirming marker proteins For high-throughput marker detection
Key advantages High precision, real-time tracking, fluorescence option Fast, easy, non-destructive Simple, widely used, sensitive for proteins High specificity for known markers Can analyze many samples quickly
Limitations Needs particles in suspension; accuracy reduced in very heterogeneous samples Poor resolution in mixed samples; no concentration data No size or concentration info Limited to known markers; no size data Limited to >200 nm; requires labeling
Best choice if… You need detailed size & concentration data You need fast screening only You want to see protein composition You want to confirm specific markers You need marker-specific, large-scale analysis

Real-World Case Highlights

Case 1: Monitoring EV Secretion under Hypoxia in Cancer Cell Lines

Objective: Evaluate how hypoxic stress and RAB27A knockdown affect exosome secretion in glioblastoma and colorectal cancer cell lines.

Method: Used NTA (NanoSight NS300) to quantify extracellular vesicle secretion after RAB27A silencing or stimulation via rotenone/hypoxia.

Result: While NTA did not detect decreases in EV secretion under RAB27A knockdown, it successfully captured increased EV release following rotenone exposure or hypoxia—highlighting NTA's strengths and limitations in measuring secretion dynamics.

Read full article

Case 2: Exosome Characterization Across Storage Conditions

Objective: Investigate storage effects (temperature, freeze-thaw cycles) on the size and integrity of exosomes from different human cell types.

Method: Exosomes from HEK293T, ECFC, and MSC were analyzed via NTA, SEM, and DLS to assess size stability under various storage conditions.

Result: Mean exosome diameter (~110 nm) remained stable through multiple freeze-thaw cycles, including storage at –20 °C; slight size reduction was observed at 4 °C and 37 °C—underscoring NTA's value in stability assessment.

Read full article

FAQs – You May Want to Know

How accurate is NTA for exosome counting?

NTA provides absolute particle counts within an optimal concentration window and under fixed detection thresholds. Accuracy depends on proper dilution, clean backgrounds, and calibration; our workflow documents these controls and includes replicate agreement criteria.

Can NTA distinguish exosomes from similarly sized contaminants?

Brightfield NTA cannot chemically identify particles; it sizes and counts them. Pairing with fNTA (antibody labeling) enriches specificity for exosome markers, while careful sample preparation reduces non-EV backgrounds.

What is the difference between NTA and DLS for exosome analysis?

NTA offers single-particle resolution, making it ideal for measuring heterogeneous exosome populations. DLS, on the other hand, provides average particle sizes, which may not be as accurate for mixed populations or small particles.

Is NTA suitable for analyzing different exosome subpopulations?

Yes, Fluorescent NTA (fNTA) allows for the detection of specific exosome subpopulations, such as CD9⁺ or CD63⁺, using antibody-based labeling. This enables detailed characterization of marker-positive EVs in a mixed sample.

Can NTA measure the stability of exosomes?

Yes, NTA can measure Zeta potential, which indicates the surface charge of exosomes. This provides insights into their stability, aggregation tendency, and compatibility with different formulations.

What reporting metrics will I receive?

Particles/mL, modal diameter, D10/D50/D90, number-weighted histograms, replicate variability, calibration traces, and—if applicable—marker-positive fractions from fNTA.

Why use NTA for exosome analysis?

NTA offers high precision and single-particle resolution, making it ideal for characterizing heterogeneous exosome populations with high accuracy.

Can NTA detect proteins in exosomes?

While NTA is used for measuring particle size and concentration, it doesn't detect proteins directly. However, Fluorescent NTA (fNTA), when combined with antibody labeling, can help identify specific proteins on the surface of exosomes.

Can NTA detect exosome heterogeneity within a single sample?

Yes. Unlike ensemble methods, NTA tracks individual particles, enabling the detection of polydisperse populations and resolving multi-modal size distributions.

What is the dynamic range of concentration measurements in NTA?

NTA reliably measures concentrations from ~1×10⁷ to 1×10⁹ particles/mL. Beyond this range, dilution is recommended to maintain linearity and avoid coincidence errors.

Online Inquiry ×
inquiry

Hi there - let me know if you have any questions.

×