Research Use Only (RUO) • Not for diagnostic procedures
Quantify extracellular vesicle (EV) subpopulations and marker colocalization at single-particle resolution using immunocapture + interferometric imaging (SP-IRIS). Ideal for complex biofluids, engineered exosomes, and research-stage process/QC trending.
Highlights
- Single-particle EV immunophenotyping (CD9/CD63/CD81 and custom targets upon request)
- 3-color fluorescence colocalization for subtype & cargo-positive fraction estimation (design-dependent)
- Micro-volume input with options suitable for complex matrices (project-dependent)
Looking for end-to-end EV services beyond ExoView? See our full Exosome Analysis Services.
Overview Use Cases Workflow Study Design Sample Requirements Immunocapture & ImagingDeliverablesAssay PackagesCase StudiesFAQ Get a Custom Proposal
Technical Overview: ExoView (SP-IRIS) Single-Particle EV Profiling
Creative Proteomics offers ExoView-based single-particle EV profiling using SP-IRIS (single-particle interferometric reflectance imaging sensor) combined with antibody microarray immunocapture. This approach enables specific capture of EV subsets and quantitative readouts at the single-vesicle level, including subpopulation proportions (e.g., CD9/CD63/CD81-defined subsets) and 3-color fluorescence colocalization to measure marker co-expression and cargo-associated signals (design-dependent). The workflow supports micro-volume input and can be applied to research samples such as plasma/serum, urine, CSF, and cell culture supernatant. Deliverables include standardized reporting, publication-ready visualizations, and exportable data tables for downstream analysis.
Why Choose ExoView for Exosome Immunophenotyping and Colocalization
Resolve EV heterogeneity with single-particle readouts
EV samples are heterogeneous. Bulk averages can obscure rare or biologically important subsets. ExoView provides subpopulation-level quantification so you can link signals to specific EV subsets.
Improve interpretability in complex biofluids
Plasma/serum and other biofluids contain abundant background particles. With immunocapture-based specificity, ExoView focuses analysis on the EV subsets you care about and supports research workflows that reduce bias from over-processing (design-dependent).
Quantify co-expression and cargo-positive fractions for engineered exosomes
Therapeutics and engineering teams often need the fraction of vesicles that are truly marker-positive or cargo-positive. 3-color fluorescence colocalization helps estimate these fractions directly when appropriate staining/labeling and controls are used.
Key Capabilities and Typical Specs (ExoView / SP-IRIS)
Capabilities and ranges can vary by sample type, panel design, and QC requirements. We confirm feasibility and recommended controls before project start.
| Item |
Typical capability / note |
| Single-particle sizing (typical) |
Small EV range; commonly cited detection from ~50 nm in many research implementations (project-dependent) |
| Sample input |
Micro-volume workflows (often ~35 µL per assay in common implementations; project-dependent) |
| Immunophenotyping |
Antibody-capture EV subset quantification (CD9/CD63/CD81; custom targets upon request) |
| Colocalization |
Up to 3-color fluorescence colocalization for co-expression and cargo-positive estimation (design-dependent) |
| Multi-capture arrays |
Commonly up to ~6 capture antibodies per chip (design-dependent) |
| Automation / throughput |
Options for automated multi-sample handling (commonly up to ~9 samples per run; platform-dependent) |
| Typical workflow duration |
Often ~2 days (capture + staining) with rapid per-chip readout; depends on design/QC |
| Data package |
Standardized PDF report + tables (CSV/XLSX) + publication-ready image exports |
Optional add-ons: orthogonal characterization (NTA, TEM, WB), EV multi-omics, and functional studies are available.
Use Cases: Biofluid EV Biomarkers, Engineered Exosomes, and Research QC Trending
Biofluid biomarker discovery and validation
- Quantify EV subpopulations in plasma/serum/urine/CSF and compare cohorts or timepoints
- Generate colocalization matrices to support marker specificity
Common add-ons: TEM/WB validation, targeted EV proteomics, downstream statistics
Engineered exosomes and therapeutics development
- Estimate cargo-positive fractions (labeling/staining design-dependent)
- Verify surface ligand expression and multi-marker co-expression on the same vesicle
- Support MOA hypotheses with subpopulation shifts and colocalization evidence
Common add-ons: intravesicular staining add-on, uptake assays, in-vitro functional readouts
Process development and QC trending (research)
- Track batch-to-batch consistency of marker-defined EV subsets
- Monitor subpopulation proportions as research-stage quality proxies
- Standardize panels for longitudinal trending
Common add-ons: stability study designs, supplementary orthogonal characterization
Service Workflow: From Study Design to Report
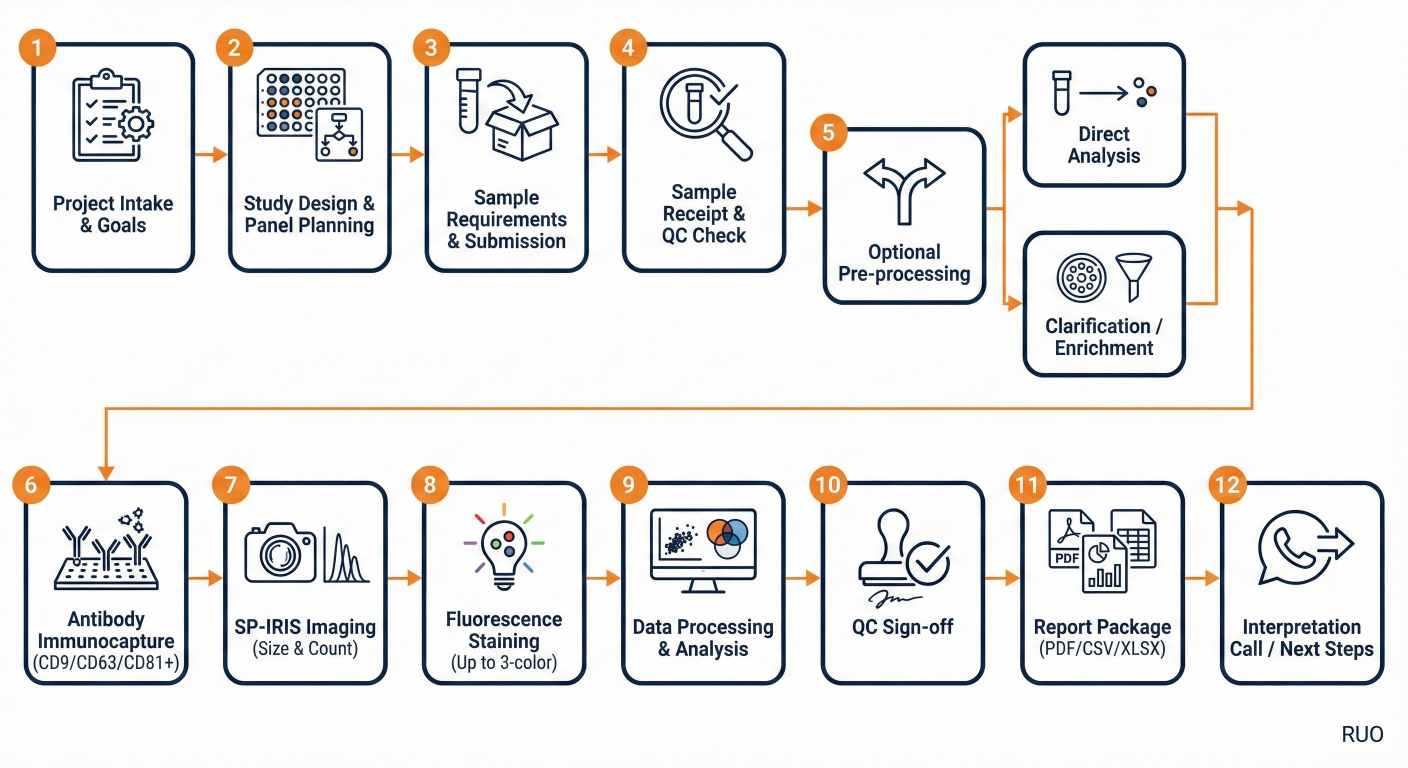 End-to-end workflow for ExoView SP-IRIS single-particle EV profiling, from study design to standardized reporting.
Study Design & Controls (Included Feasibility Guidance)
We provide feasibility guidance to align the capture/marker design, controls, and outputs to your research question before you ship samples.
Panel strategy (capture + fluorescence)
- Capture design: standard tetraspanins (CD9/CD63/CD81) and/or custom targets (upon request)
- Fluorescence design: up to 3 channels for marker co-expression and cargo-associated signals (design-dependent)
- Comparability: fixed panel across groups/timepoints for biomarker and trending studies
Control framework (recommended)
| Control / design element |
Purpose |
| Negative and/or isotype controls |
Assess non-specific binding and background signals |
| Blank spots / background checks (as applicable) |
Evaluate surface/background contributions to signal |
| Process controls (reference samples) |
Support longitudinal studies and batch trending comparability |
| Replicate / randomization guidance |
Minimize batch effects and improve interpretability |
Goal-to-module mapping
| Your primary goal |
Recommended approach |
| Subtype profiling / co-expression / colocalization |
ExoView single-particle profiling |
| Baseline concentration / size screening |
Optional NTA add-on |
| Morphology confirmation |
Optional TEM add-on |
| Marker verification |
Optional WB add-on |
| Discovery / mechanism |
Optional EV omics and/or functional studies |
Send your sample type, approximate abundance (if known), target markers, and study design (groups/timepoints). We will propose a panel, controls, deliverables, estimated turnaround time, and quote.
Sample Types and Requirements for ExoView Exosome / EV Profiling
| Sample Type |
Recommended Submission |
Typical Minimum Volume* |
Key Notes (To Avoid Failure) |
| Cell culture supernatant |
Clarified supernatant in low-bind tubes |
35 µL per assay |
Record media type/serum use; avoid repeated freeze–thaw cycles. |
| Plasma |
Frozen aliquots on dry ice |
35 µL per assay |
Report anticoagulant (EDTA, citrate, heparin); avoid hemolysis and lipemia. |
| Serum |
Frozen aliquots on dry ice |
35 µL per assay |
Note clotting conditions; avoid hemolyzed samples. |
| Urine |
Frozen aliquots on dry ice |
35 µL per assay |
Record collection time; clarify to reduce debris if possible. |
| CSF |
Frozen aliquots on dry ice |
35 µL per assay |
Low abundance; provide metadata and controls for better interpretability. |
| Other biofluids |
Case-by-case review |
35 µL per assay |
Feasibility confirmed during feasibility planning. |
*Typical micro-volume ExoView assays are often designed around 35 µL per assay. Exact requirements depend on matrix, abundance, and study design.
Immunocapture and Imaging (What Happens on the Platform)
Immunocapture on antibody microarray
EV subsets are captured on-chip using antibody spots (commonly including CD9/CD63/CD81 and optional custom targets). This step enriches target populations and supports subset-specific readouts.
SP-IRIS interferometric imaging (label-free)
We perform interferometric imaging to identify and quantify captured single particles prior to fluorescence. This establishes a robust base for downstream phenotyping and QC.
Fluorescence staining (up to 3-color; design-dependent)
When the research question requires marker co-expression or cargo-associated signals, we apply up to 3 fluorescence channels and quantify colocalization at the single-particle level.
Results You Receive: Single-Particle EV Readouts and Publication-Ready Visuals
Core ExoView readouts (design-dependent)
- Single-particle counts and size distributions (for captured EV populations)
- Marker positivity per capture spot and/or per particle
- 3-color colocalization statistics and subpopulation proportions
- Representative interferometric and fluorescence overlays
- QC notes and control interpretation aligned to the agreed design
Deliverables for analysis and reporting
- Standardized PDF report with methods, controls, and interpretation notes
- Exportable tables (CSV/XLSX) for statistics and cohort comparisons
- Publication-ready images/plots (high-resolution exports)
- Optional: figure pack and methods text for publications/grants
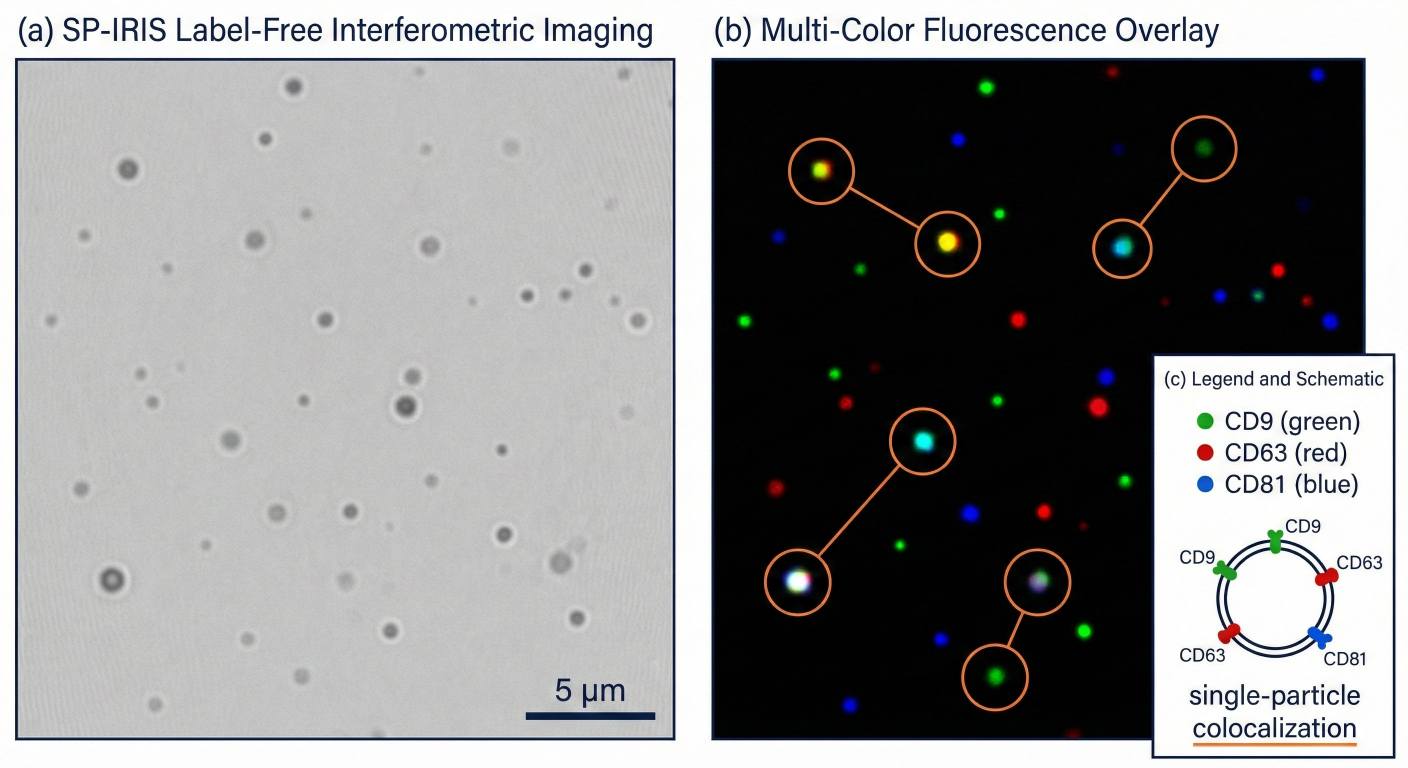 Label-free SP-IRIS imaging plus 3-color fluorescence colocalization for single-particle exosome immunophenotyping.
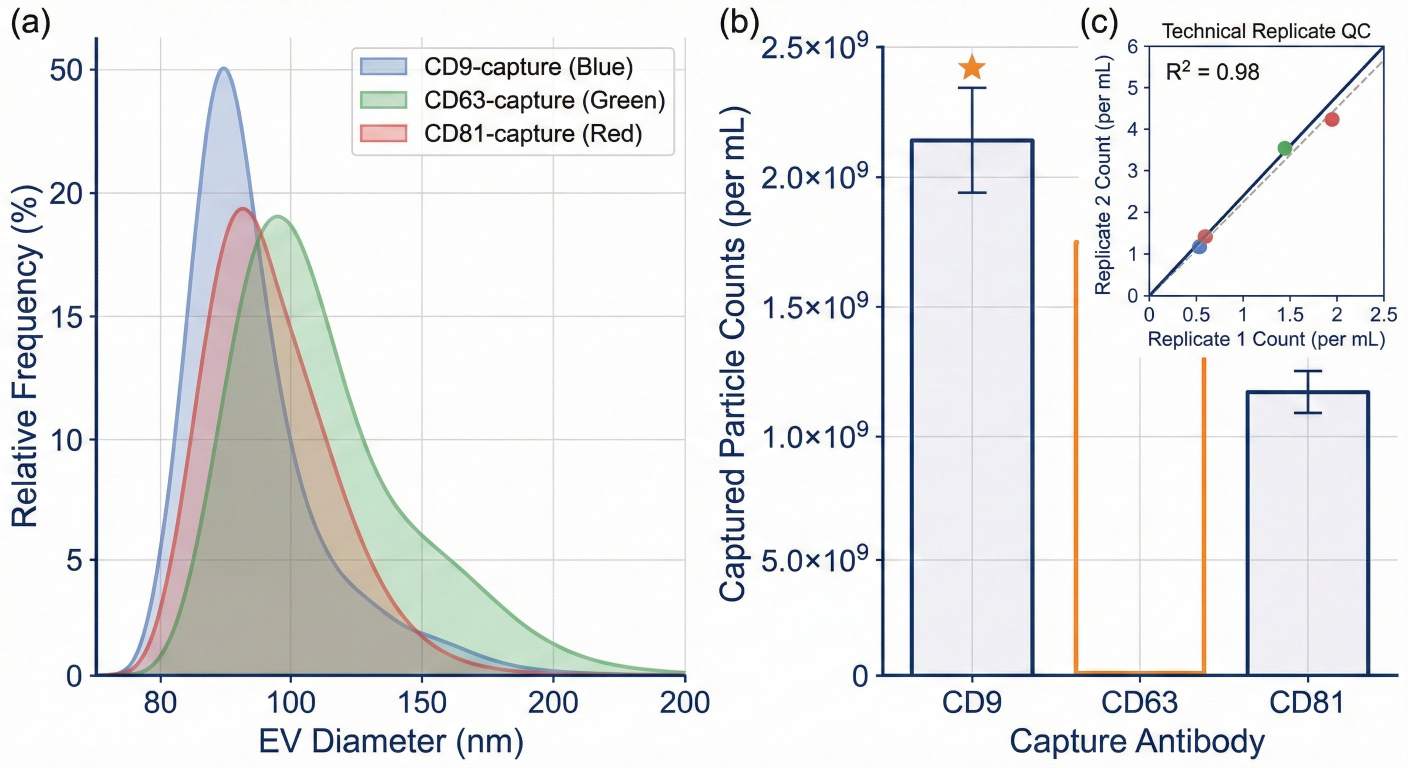 ExoView single-particle EV sizing and particle counts across immunocaptured exosome marker subsets.
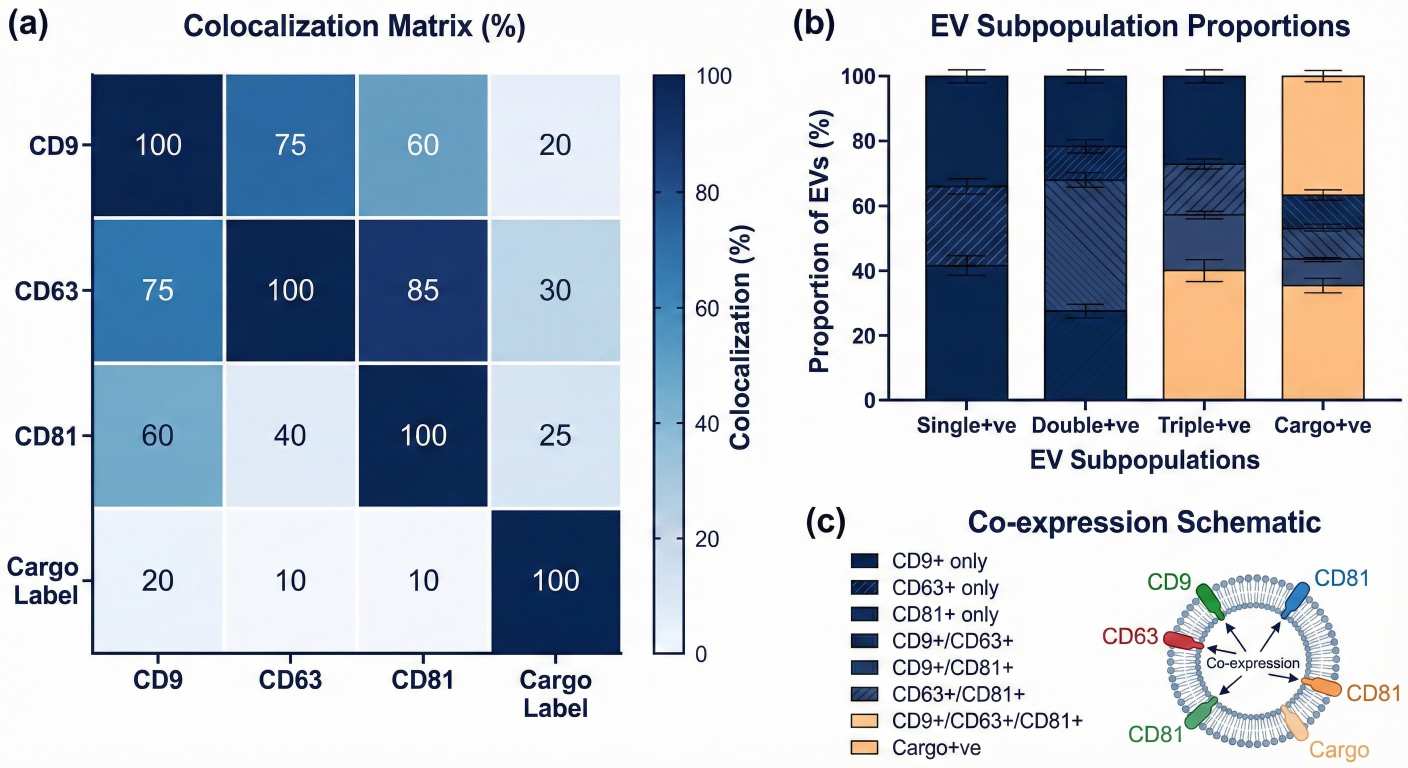 Single-particle colocalization heatmap and EV subpopulation proportions from ExoView exosome profiling.
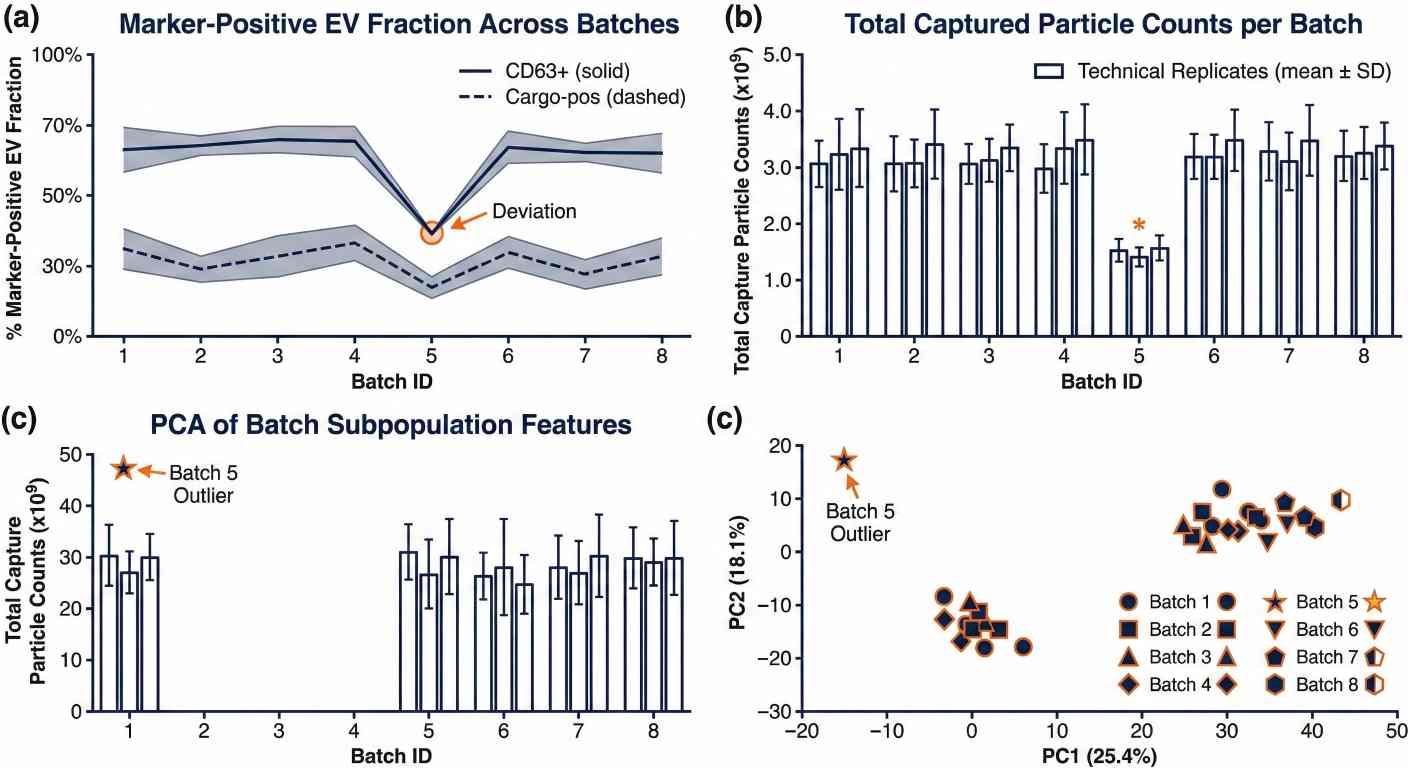 ExoView single-particle EV batch trending for research QC consistency and subpopulation stability.
Assay Options and Packages (Tetraspanins, Custom Targets, Cargo Add-Ons)
We tailor capture and marker panels to match your biological question while maintaining a control framework that supports comparability across groups and timepoints.
| Package |
Best for |
Typical outputs |
| Standard EV immunophenotyping (tetraspanin panel) |
Baseline EV subset profiling (e.g., CD9/CD63/CD81-defined subpopulations) |
Subpopulation proportions, colocalization summaries, representative images |
| Target marker profiling (custom; upon request) |
Enrichment/profiling of specific EV sources or functional subsets |
Target-focused positivity and colocalization statistics; panel feasibility confirmed case-by-case |
| Cargo / intravesicular marker add-on (design-dependent) |
Engineered exosomes, cargo-positive fraction estimation, MOA support |
Cargo-associated signal positivity, cargo–surface phenotype colocalization, QC notes |
Client-Published Surfaceome Case Highlights
Case 1: Tetraspanin Heterogeneity and Capture Bias in Single-EV Profiling (ExoView / SP-IRIS)
Objective: Reveal how EV tetraspanin heterogeneity (CD9/CD63/CD81) impacts single-vesicle profiling and biomarker sensitivity, and evaluate capture-related bias in multiplex assays.
Method: SP-IRIS single-particle capture + 3-color immunofluorescence on ExoView (tetraspanin microarray capture), benchmarking against NTA/TEM/flow-based approaches; multiplex co-localization analysis across EV sources and isolation methods.
Result: Demonstrated that tetraspanins are unevenly distributed across single EVs and that capture choice can bias the apparent multiplex profile—materially affecting sensitivity to tumor-associated surface markers; supports using single-particle phenotyping (not bulk averages) for rigorous EV biomarker/assay development.
DOI: 10.1186/s12951-021-00987-1
Learn More
Case 2: Plasma sEV Profiling + ExoView Marker Imaging to Support EV-miRNA Biomarker Work (SP-IRIS / ExoView R100)
Objective: Characterize plasma small extracellular vesicles (sEVs) and integrate EV profiling with downstream sEV-miRNA analysis in an oncology response-prediction research workflow.
Method: Plasma sEV isolation + orthogonal characterization (NTA, TEM) + ExoView R100 (SP-IRIS) single-particle imaging for CD63/CD81/CD9 marker visualization and phenotyping; paired with small RNA-seq and bioinformatic analysis of sEV miRNAs.
Result: Provided an example of how single-particle EV marker confirmation (ExoView) strengthens confidence in EV identity/quality before sequencing-driven biomarker analysis; supports positioning ExoView as the "front-end QC + phenotyping gate" for complex plasma EV biomarker projects (research use).
DOI: 10.1186/s12645-024-00273-3
Learn More
FAQs – Surfaceome Insights
How is ExoView different from NTA?
NTA is commonly used for overall particle concentration and size distribution based on motion and scattering. ExoView adds immunocapture-based specificity and single-particle phenotyping, enabling subpopulation-level quantification and 3-color colocalization for co-expression and cargo-positive estimation (design-dependent).
Do I need to purify exosomes before ExoView analysis?
Many studies can be designed with reduced over-processing by targeting EV subsets via immunocapture. The best approach depends on matrix, abundance, and goals. We confirm recommended pre-processing and controls during feasibility planning.
What markers can you analyze?
Standard designs often include CD9/CD63/CD81. Additional targets can be included in capture and/or fluorescence panels upon request, subject to feasibility and control design.
Can ExoView estimate cargo-positive fractions for engineered exosomes?
Yes—when the study includes appropriate labeling/staining and controls, colocalization can estimate cargo-positive fractions and their association with surface phenotypes (design-dependent).
What is the minimum sample volume?
ExoView workflows can be micro-volume. Typical inputs are often around ~35 µL per assay in common implementations, but exact requirements depend on matrix, abundance, and panel design.