One-carbon metabolism revolves around the capture, transfer and utilization of single-carbon units (methyl, formyl and methylene). The key pathways include:
- Folic acid cycle: one carbon unit is transferred through tetrahydrofolate (THF) to support the synthesis of nucleotides (dTMP, purine).
- Methionine cycle: S- adenosylmethionine (SAM) is produced as a "universal methyl donor" to drive the methylation of DNA, histones and small molecules.
- Sulfur conversion pathway: converting homocysteine into cysteine and regulating redox balance (glutathione synthesis).
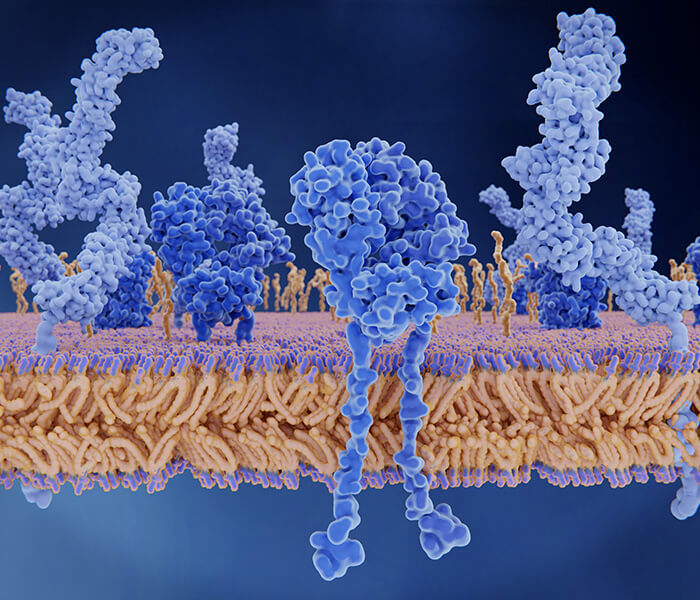
 One carbon metabolism (Ren X et al., 2024).
Determine the research objectives and experimental design
Precise positioning of scientific problems
The research on the regulation mechanism of single carbon metabolism should focus on the following core directions:
- Tumor metabolic reprogramming: analyze how cancer cells can enhance serine → glycine flux and support the balance between nucleotide synthesis and redox (such as NADPH regeneration) by up-regulating SHMT2, MTHFD2 and other enzymes.
- Nutritional intervention effect: to explore the effect of folic acid/vitamin B12 deficiency on homocysteine accumulation and its molecular correlation with metabolic syndrome (diabetes and atherosclerosis).
- Cross-tissue metabolic interaction: how the coordination of choline-betaine pathway between liver and intestine maintains systemic methyl pool homeostasis.
Select model system
- Cell models: such as various cancer cell lines (such as HeLa, MCF-7, etc.) and normal cell lines (such as liver cells and heart cells, etc.), can be used to study the changes of single carbon metabolism under different physiological conditions.
- Animal model: knockout mice or transgenic mice can help to study the role of specific genes or enzymes in single carbon metabolism.
- Clinical samples: the relationship between single carbon metabolism and disease state was evaluated by analyzing the blood and tissue biopsy samples of patients.
- Design control group and treatment group: establish a comparison between treatment group and control group. Multi-factor crossover design (such as folic acid level × drug treatment): analyze the interaction between variables to avoid single factor deviation. Time series sampling: capture the dynamic changes of metabolism (such as the fluctuation of SAM/SAH ratio) and reveal the time-dependent regulation mechanism. Standardization of internal standard: use isotope internal standard (such as d3- methionine) to correct technical errors and improve data accuracy.
Sample types and collection specifications
- Blood: plasma/serum: EDTA anticoagulation tube collection to avoid hemolysis (homocysteine is easy to oxidize).
- Whole blood: PAXgene tube preserved RNA for gene expression analysis.
- Tissue: the surgical samples were quickly frozen (liquid nitrogen) to avoid room temperature degradation (SAM half-life < 5 min). Laser microdissection (LCM) can separate tumor epithelium from stroma to reduce heterogeneous interference.
- Cell: Rapid quenching (methanol at -80℃), simultaneous extraction of metabolites and protein /RNA.
Metabolite extraction technology
- Liquid-liquid extraction: polar metabolites (SAM, SAH) were extracted from methanol/acetonitrile/water (4:4:2) mixture. Antioxidant (0.1% formic acid) is added to prevent oxidation.
- Solid phase extraction (SPE): C18 column was used to enrich fat-soluble metabolites (such as folic acid derivatives), and the recovery rate was over 85%.
- Isotope internal standard: d3- methionine and C5-glutamic acid were added to correct the ion inhibition effect.
Detection of metabolite level
Targeted metabolomics for precision
- Polar metabolites (such as SAM): Chromatographic column: HILIC-ZIC® chromatographic column is adopted, which has excellent separation performance for polar metabolites and can effectively separate and detect polar compounds. Ion mode: electrospray ionization (ESI) positive ion mode (ESI+) is adopted, because polar compounds such as SAM usually have strong signal response in positive ion mode. Limit of Quantification (LOQ): The limit of quantification of this protocol is 0.1 nM, which can sensitively detect very low concentration of SAM and provide reliable basis for accurate quantification of metabolites.
- Volatile metabolites: Chromatographic column: DB-5MS capillary column is used, which is suitable for the separation of volatile metabolites. This chromatographic column can efficiently separate volatile compounds and is suitable for analyzing volatile metabolites in complex samples. Ion mode: Electron bombardment ionization (EI) mode is adopted, which is suitable for the ionization of volatile organic compounds and usually produces stable ion signals. Limit of Quantification (LOQ): The limit of quantification of this method is 1 μM, and quantitative analysis can be carried out in a high concentration range to ensure accurate detection of volatile metabolites.
- Internal standard strategy: Stable isotope internal standard (such as d3- methionine) corrects the ion suppression effect. Antioxidants (such as DTT) are added to prevent SAM/SAH from oxidative degradation.
Isotope tracer experiment
- Marking pattern design: Location-specific marker: u-c-serine vs.3-c-serine, which distinguishes the contribution of mitochondria and cytoplasm to carbon metabolism. Double labeling strategy: C-serine+H-glycine, to analyze the coupling effect of carbon flow and nitrogen metabolism.
- Data parsing algorithm: Unsteady metabolic flow analysis (INST-MFA) was performed by using Isotopo software to calculate the instantaneous flux change. Evaluation of flux uncertainty based on Markov chain Monte Carlo (MCMC) method.
Mass spectrometry
Chromatographic separation optimization
Column selection strategy
- Reversed-phase chromatography (C18): suitable for moderately polar metabolites (such as SAM and SAH). The mobile phase was eluted with 0.1% formic acid water-acetonitrile gradient, and the retention time was stable (RSD<2%).
- Hydrophilic interaction chromatography (HILIC): It is specially designed for polar metabolites (such as 5- methyl -THF and glycine), and acetonitrile -10 mM ammonium formate (pH 3.0) is used as the mobile phase to improve the symmetry of peak shape.
- Ion-pair chromatography: For charged metabolites (like cysteine), heptafluorobutyric acid (HFBA) was added to enhance the separation efficiency.
Elution gradient optimization
- The fractional gradient (such as 5%-95% acetonitrile /20 min) is used to balance the separation efficiency and flux, so as to ensure the effective separation of folic acid derivatives and purine precursors (resolution > 1.5).
Mass spectrometry detection and mode selection
Instrument configuration
- High-resolution mass spectrometry: Orbitrap Exploris 480 (resolution 240,000 @ m/z 200) or Q-TOF (mass accuracy < 2 ppm) is used for accurate mass number determination.
- Ion source: Electrospray Ionization (ESI) switches between positive and negative ion modes, covering metabolites with different polarities (e.g. ESI+ detecting SAM, ESI- detecting 5-MTHF).
Targeted and untargeted analysis strategies
- Target metabolites: homocysteine, methionine, SAM, SAH, 5-MTHF, etc.
- Method advantages: The sensitivity is 0.1 nM(LOQ), and it can detect trace metabolites in serum. The dynamic range is wide (10), and it adapts to the difference of physiological and pathological concentrations.
- Data acquisition: DDA (data dependent acquisition) or DIA (data independent acquisition) mode, covering metabolites comprehensively.
- Innovation discovery: Identification of novel folic acid derivatives (such as 10- formyl -THF glutamic acid polymer). Found abnormal accumulation of methylation intermediates (such as S- adenosylhomocysteine) in cancer.
Services You May Be Interested In:
Additional Resources:
Data processing and bioinformatics analysis
Raw data preprocessing
- Peak extraction and alignment: Use MS-DIAL or XCMS for peak detection (SNR>3) and cross-sample retention time correction (RT deviation < 0.1 min).
- Metabolite notes: Database matching: HMDB, METLIN (quality error < 5 ppm). MS/MS spectrogram analysis: molecular network analysis was carried out on GNPS platform, and unknown metabolites were annotated.
statistical analysis
- Multivariate analysis: Differential metabolites were screened by PCA or PLS-DA (VIP>1.5, p<0.05). Thermographic clustering reveals the co-expression module of metabolites (such as the relationship between SAM/SAH ratio and DNA methylation).
- Pathway enrichment: MetaboAnalyst maps to KEGG pathway (such as map00270 methionine metabolism) and identifies the disordered pathway (FDR<0.05).
Analysis of enzyme activity and gene expression
Detection of key enzyme activities
- The activities of SHMT (serine hydroxymethyltransferase), MTHFR (methylenetetrahydrofolate reductase) and MAT (methionine adenosine transferase) can be determined by spectrophotometry, fluorescence or enzyme-linked immunosorbent assay (ELISA).
- Commercial kits (such as Abcam and Sigma-Aldrich) can be used to simplify the experimental process and improve the experimental efficiency.
Analysis of gene and protein expression
- Transcription level analysis: The expression levels of genes related to single carbon metabolism (such as MTHFR, TYMS, DHFR, etc.) were analyzed by qPCR, RNA-seq and other techniques, and their regulatory mechanisms under different physiological and pathological conditions were discussed.
- Protein expression analysis: Western blot, immunohistochemistry and other techniques can be used to detect the protein expression of key enzymes and their post-translation modifications (such as phosphorylation, acetylation, etc.) to further understand the mechanism of metabolic regulation.
Multi-omics data integration strategy
- Transcription-metabolism regulatory network: Weighted gene co-expression network analysis (WGCNA) identified gene modules significantly related to SAM/SAH ratio. Causal reasoning model (such as Bayesian network) predicts the regulatory weight of MTHFR expression on 5-MTHF level.
- Phosphorylation modification map: Phosphorylated peptides were enriched by zirconium titanate (TiO2), and the phosphorylation site of SHMT2 Thr78 was identified by Orbitrap Fusion Lumos mass spectrometry.
Epigenetic association analysis
Panoramic analysis of DNA methylation
- Single base resolution technique: Genome-wide methylation sequencing (WGBS) covers more than 90% CpG sites, revealing hypomethylated regions (such as LINE-1 repeats). Oxidized sulfite pyrophosphate sequencing (oxBS-Seq) distinguishes between 5mC and 5hmC modifications.
- Functional intervention experiment: dCas9-TET1 targeted demethylated p16INK4a promoter, restored its expression and inhibited the proliferation of cancer cells.
Dynamic tracking of histone modification
- CUT&Tag technology: Protein A-Tn5 transposase complex was used to detect the distribution of H3K27me3 in low initial samples with high sensitivity.
- Metabolic intervention response: After SAM supplementation (1 mM, 48h), ChIP-seq showed that the promoter region of tumor suppressor gene (such as CDKN1A) increased.
Modeling of metabolic flux
Model optimization process
- download Recon3D template from MetaNetX.
- Adding tissue-specific reaction (such as hepatocyte BHMT pathway)
- Introduce LC-MS metabolite concentration as a constraint condition.
- flux balance analysis (FBA) to maximize biomass synthesis
Phenotypic prediction verification
- After simulated MTHFR knockout, the predicted homocysteine increased by 20%, which was consistent with the experimental data of mouse model (p<0.05).
Target discovery driven by machine learning
- Feature engineering: extract metabolite ratio (serine/glycine) and pathway activity score (MTHFR enzyme activity /DNA methylation level) as input features.
- Model construction: XGBoost was used to predict the sensitivity of methotrexate, and the AUC reached 0.92. The key features included the expression of TYMS and the ratio of dUMP/dTMP.
- Metabolic flux analysis (MFA): Use MFA tools (such as COBRA, INCA, etc.) to combine isotope tracer experimental data with metabolite concentration, and quantitatively analyze the metabolic flow of each branch channel.
- Multiomics data integration: combining the data of transcriptomics, metabonomics and proteomics, using system biology methods (such as machine learning algorithm: random forest, deep learning, etc.) to predict key metabolic control nodes, and further analyze the regulation mechanism of single carbon metabolism.
Data analysis and interpretation of results
- SAM/SAH ratio: Under the background of metabolic flux change, the decrease of SAM/SAH ratio may mean the decrease of DNA methylation potential, thus affecting gene expression.
- Pathway enrichment analysis: Pathway enrichment analysis is carried out through KEGG, Reactome and other databases to identify the significantly changing pathways under the regulation of single carbon metabolism and reveal how single carbon metabolism interacts with other metabolic pathways.
- Clinical relevance verification: Correlate experimental data with patients' clinical information (such as prognosis, drug reaction, disease progress, etc.), explore the potential application value of single carbon metabolism in clinical diagnosis and treatment, and then provide support for accurate treatment of cancer and other diseases.
Reference
- Caffrey A, McNulty H, Rollins M, Prasad G, Gaur P, Talcott JB, Witton C, Cassidy T, Marshall B, Dornan J, Moore AJ, Ward M, Strain JJ, Molloy AM, McLaughlin M, Lees-Murdock DJ, Walsh CP, Pentieva K. "Effects of maternal folic acid supplementation during the second and third trimesters of pregnancy on neurocognitive development in the child: an 11-year follow-up from a randomised controlled trial." BMC Med. 2021;19(1):73. doi: 10.1186/s12916-021-01914-9