Integrated Metagenomic and Metabolomic Analysis
Understand Microbes and Molecules, Then Act
Pin down which organisms are present, what they're doing, and which metabolites drive your phenotype—so you can prioritize levers that actually move outcomes.
- One submission → two layers of truth: whole-community DNA + small-molecule readouts
- From taxa to pathways to metabolites: confident links, not shaky correlations
- Decision-grade outputs: QC'd data, effect sizes, and ranked actionables for R&D and process control
Submit Your Request Now
×
- What We Provide
- Advantages
- Technology Platform
- Sample Requirement
- Demo
- FAQ
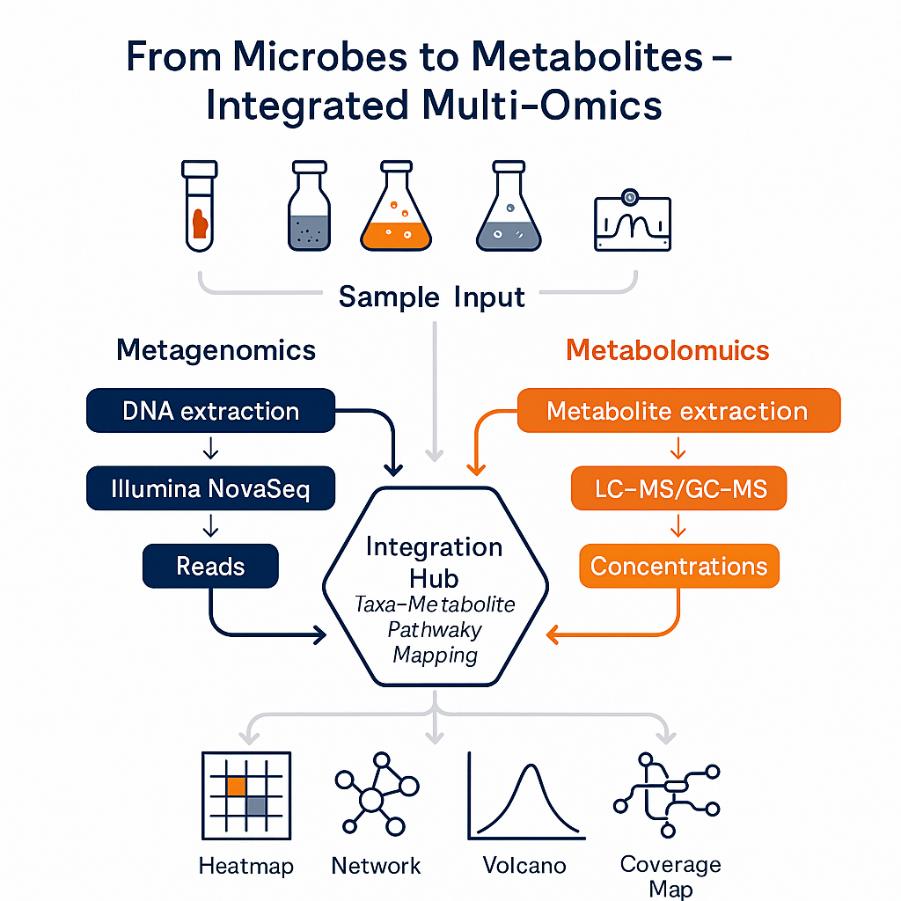
Why Integrate Metagenomic and Metabolomic in Your Study?
Integrated metagenomic and metabolomic analysis combines shotgun metagenomics (who's there, what genes and pathways they encode) with LC/GC–MS metabolomics (what molecules are produced or consumed) in the same samples. This delivers a mechanistic map from microbial community structure → functional potential → realized metabolic state.
Common challenges we solve:
- Correlation ≠ causation: Taxa alone rarely explain phenotypes. We quantify pathway capacity and connect it to metabolite flux.
- Opaque pathway claims: We move beyond broad "butyrate producers" to gene-level evidence (e.g., buk, but operons) and measured short-chain fatty acids.
- Matrix complexity: From fecal, soil, and bioreactor slurries to fermentation broths, we deploy matrix-matched prep and targeted MRM for low-abundance metabolites.
- Reproducibility & comparability: Harmonized QC across omes: pooled QC RSD% targets, lock-mass accuracy, sequencing depth controls, and batch correction.
When you need integration instead of separate assays:
- You must rank driver taxa/genes by their contribution to metabolite shifts.
- You need pathway-level KPIs for process monitoring (e.g., lactate/ethanol yield, nitrogen cycling).
- You're down-selecting strains, media, or parameters and need fast, defensible readouts.
What's Included in Our Integrated Metagenomic and Metabolomic Analysis Services
Service Contents
- Metagenomic Analysis Services
- Metabolomic Analysis Services
- Multi-Omics Integration & Analytics
- Optional Add-On Services
Metagenomic Analysis Services
| Category | Description |
|---|---|
| Shotgun Metagenomic Sequencing | High-depth, paired-end Illumina sequencing; optional long-read (PacBio/ONT) for hybrid assemblies |
| Taxonomic Profiling | Species/strain-level classification (where supported), alpha/beta diversity, rarefaction, contamination check |
| Functional Gene Annotation | Gene calling and mapping to KEGG Orthology (KO), MetaCyc pathways, eggNOG, CAZy, VFDB, and AMR genes (for research use only) |
| Pathway Reconstruction | Inference of pathway capacity per sample based on gene family abundance |
| Strain-Level Profiling (Advanced) | Metagenome-assembled genomes (MAGs), pan-genome analysis, and strain-resolved abundance |
| Category | Description |
|---|---|
| Untargeted LC–MS/GC–MS Metabolomics | High-resolution mass spectrometry profiling in positive and negative modes, HILIC + RP separation |
| Targeted Metabolite Panels | SCFAs, amino acids, bile acids, nucleotides, central carbon intermediates, organic acids, polyamines, volatiles, etc. |
| Volatile Metabolites (GC–MS / HS-SPME) | Targeted or semi-targeted analysis of fermentation volatiles and aroma-related compounds |
| Pathway Annotation & Mapping | Metabolite identification mapped to KEGG/MetaCyc pathways; insight into active metabolic processes |
Multi-Omics Integration & Analytics
| Category | Description |
|---|---|
| Taxa–Metabolite Correlation Networks | Co-occurrence and predictive models (e.g., mmvec, SparCC) |
| Pathway-Metabolite Mapping | Gene-level pathway scores correlated with downstream metabolite production/consumption |
| Multiblock Analysis | DIABLO, sPLS, and CCA models to reveal cross-omic patterns and key drivers |
| Ranked Mechanistic Insights | Prioritized taxa, pathways, and metabolites contributing to phenotype or process performance |
| Custom Visualization Package | Heatmaps, volcano plots, pathway overlays, taxa–metabolite bipartite graphs, and network maps |
Optional Add-On Services
| Module | Description |
|---|---|
| Volatile Compound Panels (GC–MS) | Profiling of alcohols, esters, aldehydes, sulfur compounds, and fermentation volatiles |
| Bile Acid Transformation Analysis | Combined metagenomic (e.g., bai, bsh gene detection) and bile acid quantification |
| SCFA & Organic Acid Panel | Acetate, propionate, butyrate, lactate, succinate, formate, valerate, etc.—with LOQs ≤ 10 ng/mL |
| Custom Targeted Panels | Tailored metabolite panel development based on project needs (e.g., nucleotides, amines, redox cofactors) |
| Standalone Data Integration | Analysis of pre-existing metagenomic and metabolomic data sets with Creative Proteomics' integration pipeline |
Advantages of Our Integrated Approach
- Mass accuracy & resolution: ≤ 3 ppm mass error; ≥ 120,000 FWHM at m/z 200 for HRMS untargeted runs.
- Targeted sensitivity: LOQs as low as 0.5–10 ng/mL (class-dependent) with matrix-matched calibration; linearity R² ≥ 0.995.
- Reproducibility: Pooled-QC RSD% ≤ 15% for targeted panels; retention-time drift control ≤ 0.1 min (indexed calibrants).
- Sequencing depth: Typical per-sample reads support species-level profiles and robust KO coverage; host-depletion and rarefaction reported.
- Integration fidelity: Cross-validated multiblock models with ≥ 70–90% variance explained (dataset-dependent), FDR-controlled discoveries (q ≤ 0.05).
- Traceability: Every figure/table linked to methods, files, and parameters for auditability and re-analysis.
Workflow for Integrated Metagenomic and Metabolomic Analysis
1. Consultation & Study Design — matrices, hypotheses, depth, targeted panels, and integration endpoints
2. Kits & SOPs — stabilization buffers, containers, and cold-chain instructions
3. Sample Receipt & Accessioning — barcode tracking, temperature logging, chain of custody
4. Parallel Lab Work — DNA extraction & library prep; metabolite extraction (polar/semi-polar/volatiles) with internal standards
5. Acquisition — sequencing and LC/GC–MS runs with bracketed QCs, blanks, and pooled QCs
6. Processing & QA — read QC, taxonomic/functional tables; peak picking, alignment, blank subtraction, ID confidence scoring
7. Integration Analytics — composition-aware stats, multiblock models, pathway-metabolite mapping, driver ranking
8. Delivery & Review — report, figures, annotated data matrices, and an executive summary with recommendations

Technology Platform for Integrated Metagenomic and Metabolomic Analysis
Shotgun Metagenomics
Sequencing Platform: Illumina NovaSeq X Plus / NextSeq 2000 (paired-end 2×150 bp)
Library Prep: Dual-indexed, insert ~350 bp
Depth: Configurable (typical: ≥ 10G/sample); host-depletion available
Annotation Tools: Kraken2, MetaPhlAn, HUMAnN, KEGG, MetaCyc, eggNOG
Output: Taxonomic abundance, KO profiles, pathway reconstructions
Targeted Metabolomics (MRM/PRM)
Instruments: SCIEX QTRAP 6500+ / Agilent 6495C
Analytes: SCFAs, organic acids, amino acids, bile acids, nucleotides, volatiles
Sensitivity: LOQ down to 0.5–10 ng/mL (matrix-dependent)
Linearity: R² ≥ 0.995; internal standards & matrix-matched calibration
QC: Pooled sample RSD% ≤ 15%; retention time drift < 0.1 min
Untargeted Metabolomics (LC–HRMS)
LC System: Thermo Vanquish or Waters ACQUITY UPLC
MS Platform: Thermo Q Exactive HF-X or Orbitrap Exploris 240
Resolution: 120,000 FWHM @ m/z 200
Modes: Positive/negative ion switching; DDA or DIA
Coverage: HILIC (polar) + C18 (semi-polar); MS/MS-based annotation (Level 2/3)
Multi-Omics Integration & Analysis
Frameworks: mixOmics (DIABLO, sPLS), mmvec, ALDEx2
Outputs: Taxa–metabolite networks, pathway–phenotype linkages, ranked key drivers
Validation: Cross-validated models with FDR correction
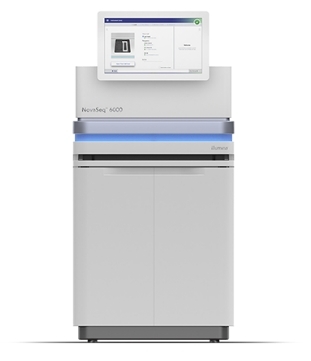
Illumina NovaSeq 6000 (Figure from Illumina)
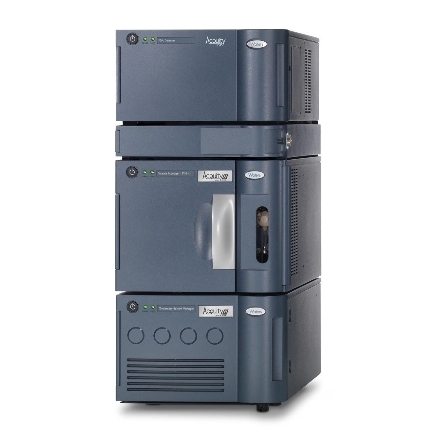
Waters ACQUITY UPLC System (Figure from Waters)
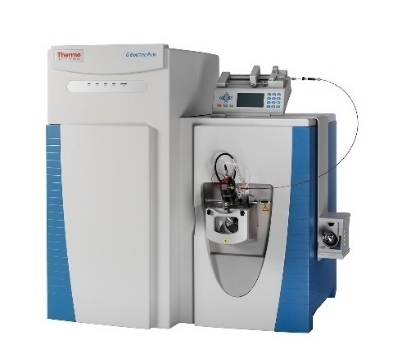
Q Exactive™ HF-X (Figure from Thermo)
SCIEX Triple Quad™ 6500+ (Figure from Sciex)
Sample Requirements for Integrated Metagenomic and Metabolomic Analysis Service
| Sample Type | Minimum Amount | Container & Additives | Storage | Shipping |
|---|---|---|---|---|
| Stool / Gut Contents | ≥ 200 mg | Sterile screw-cap tube; no guanidine preservatives | −80 °C | Dry ice |
| Soil / Sediment | ≥ 2 g | Sterile tube | −20 °C or lower | Dry ice |
| Bioreactor Slurry / Fermentation Broth | ≥ 2 mL + media | Cryovial; quench or freeze immediately | −80 °C | Dry ice |
| Cell Pellets / Microbial Biomass | Pellet from ≥10⁸ cells | DNA/RNA-free tube | −80 °C | Dry ice |
| Food / Feed / Solid Biomass | ≥ 1 g homogenate | Sterile tube | −80 °C | Dry ice |
| Water / Effluent (for filtration) | ≥ 500 mL or 0.22 μm filters | Sterile container or membrane filter | 4 °C (short term) or −80 °C | Ice packs or dry ice |
Notes & Recommendations:
- Avoid freeze–thaw cycles. Always aliquot samples if needed.
- For metabolomics, snap-freezing or methanol quenching is recommended for immediate metabolite stabilization.
- For metagenomics, host DNA depletion kits are available on request (e.g., for stool or mucosal samples).
- If submitting both omics from the same sample, please provide sufficient material for parallel extraction.
Use Cases
Microbial Fermentation Optimization
Identify taxa and pathways driving product yield. Monitor metabolite shifts to fine-tune strains, media, or process parameters.
Environmental Microbiome Function Mapping
Link functional genes (e.g., nifH, amoA, dsrA) to metabolite profiles. Reveal site-specific activity in soil, water, or sludge systems.
Gut Microbiome Studies
Correlate microbiota composition with SCFAs, bile acids, indoles, and other host-relevant metabolites in model or preclinical systems.
Engineered Consortia Validation
Verify engineered or synthetic communities by confirming gene presence and metabolic output under real conditions.
Bioprocess Monitoring & Control
Track pathway-level KPIs and metabolite trends across batches. Detect drift early and support data-driven process adjustments.
Discovery & Mechanism Studies
Connect gene/pathway changes to phenotypic metabolite shifts. Prioritize functional drivers for follow-up and publication
Demo Results

Representative LC–MS total ion chromatogram with major peaks annotated by retention time (RT). Demonstrates separation of complex metabolites.

Calibration curve of standard concentrations versus peak area. Linear regression shows excellent fit (R² > 0.99) and quantification down to low ng/mL levels.

Heatmap overlay comparing pathway gene abundance (left) and metabolite levels (right) across control and treatment groups. Concordant shifts highlight active microbial pathways.

PCA score plot of integrated metagenomic and metabolomic data. Control and treatment groups separate along PC1 and PC2, reflecting distinct functional and metabolic states.

Pathway coverage map comparing gene detection rates (blue) and metabolite detection rates (orange) across key microbial pathways.
FAQ of Integrated Metagenomic and Metabolomic Analysis
How do you ensure that functional gene data from metagenomics is meaningfully connected to metabolite readouts?
We correlate pathway-level gene abundance (e.g., KEGG Orthologs) with metabolite outputs using cross-validated multiblock models (DIABLO, sPLS) and co-occurrence analysis (mmvec), reporting only statistically supported, reproducible associations.
What makes your integration more actionable than running separate metagenomic and metabolomic assays?
All omics are processed under harmonized SOPs with shared sample identifiers, synchronized QC, and integrated analytics pipelines—allowing us to identify top-ranked taxa, genes, and metabolites that directly drive functional shifts.
How do you handle variability across complex matrices like fecal, soil, or fermentation slurry samples?
We use matrix-matched extraction, internal standards, retention time locking, and pooled QC-based normalization to ensure analytical consistency across diverse sample types.
Can I include external metadata such as treatment groups, strain identifiers, or media conditions in the analysis?
Yes. Experimental covariates are incorporated directly into our statistical models to enable conditional analysis and isolate group-specific microbial and metabolic drivers.
How are unknowns from untargeted metabolomics addressed?
Unknown features are scored based on their biological relevance (e.g., correlation to gene/pathway shifts), and we provide MS/MS spectra with Level 2/3 annotations. Custom targeted panels can be developed from these candidates on request.
Is the workflow suitable for validating engineered microbial consortia or functionally modified strains?
Yes. We confirm presence and abundance of design-specific genes, and measure corresponding metabolite changes to verify performance against intended functional endpoints.
How do you support multi-cohort or multi-timepoint study designs?
We apply randomized acquisition, pooled sample tracking, and batch-effect correction across all omics layers, ensuring comparable data across cohorts and timepoints.
What level of interpretability do the final outputs provide for downstream decisions?
Each project includes ranked driver lists (taxa, pathways, metabolites), pathway–metabolite maps, effect sizes, and executive summaries—allowing you to prioritize actionable findings without re-processing raw data.
What if I already have sequencing or metabolomics data generated elsewhere?
We can integrate your existing datasets into our cross-omics pipeline, applying the same quality control, annotation, and multi-omics statistical frameworks to generate matched insights.
Can the integration uncover functional redundancy or compensation among microbes?
Yes. Our pathway-centric analysis reveals cases where multiple taxa encode the same functions, allowing you to assess redundancy, resilience, or bottlenecks in the system.
Learn about other Q&A about proteomics technology.
Publications
Below are some of the papers published by our clients:

- Physiological, transcriptomic and metabolomic insights of three extremophyte woody species living in the multi-stress environment of the Atacama Desert. 2024.
- Thermotolerance capabilities, blood metabolomics, and mammary gland hemodynamics and transcriptomic profiles of slick-haired Holstein cattle during mid lactation in Puerto Rico. 2024.
- Pair bonding and disruption impact lung transcriptome in monogamous Peromyscus californicus. 2023.