BioID-MS Service
Creative Proteomics offers BioID services to accurately identify protein-protein interactions in living cells, overcoming the limitations of traditional methods in detecting transient and weak interactions. Our solutions support disease research, drug discovery, and protein network analysis.
Submit Your Request Now
×
- Features
- Steps of BioID Platform
- How to Choose
- Sample Requirements
- Demo
- FAQs
- Publications
What is BioID Technique?
BioID (Proximity-Dependent Biotin Identification) is an advanced in vivo protein-protein interaction (PPI) profiling technique that leverages proximity-dependent biotinylation to capture spatial and temporal interaction networks within living cells.
BioID enables the detection of weak or transient interactions in vivo, providing a more accurate representation of protein networks without the need for artificial modifications or cross-linking agents.
Features of BioID
- In Vivo Proximity Labeling
- Captures interactions in live cells, preserving spatial context and physiological relevance.
- Overcomes limitations of traditional methods (e.g., Co-IP) that require cell lysis and lose transient interactions.
- High Sensitivity & Specificity
- Detects low-abundance proteins with minimal background interference.
- The strong affinity between biotin and streptavidin enables stringent enrichment, significantly reducing false positives.
- Versatility:
- Compatible with diverse systems: mammalian cells, tissues, and in vivo models.
- Optimized protocols for fast labeling (TurboID: 10 min vs. BioID: 12–24 hrs).
- Membrane Protein Compatibility: Works with harsh lysis buffers (e.g., 1% SDS), enabling analysis of membrane-embedded complexes (e.g., GPCRs, ion channels)
- Dynamic Interaction Capture: Identifies context-dependent interactors (e.g., drug-induced or stress-responsive PPIs) using time-resolved labeling.
What Are the Steps of Our BioID Service?
(1) Vector Construction and Cell Transfection
Vector Selection: The BirA* mutant is fused with the protein of interest (POI). Fusion can be done at either the N-terminus or C-terminus, and the design should be optimized based on the functional domains and structure of the target protein.
Common Vectors: pcDNA3.1, pLVX (lentivirus), pInducer (inducible expression system).
Cell Transfection: The constructed vector is transfected into target cells (e.g., HEK293, HeLa) or stable cell lines are generated.
- Transfection Methods: Lipofection, electroporation, viral transduction.
- Quality Control: Fusion protein expression is verified by Western blot, and localization is confirmed using fluorescence microscopy.
(2) Biotin Incubation and Labeling
Biotin is added to the cell culture medium (typically at a final concentration of 50 µM). The BirA* mutant activates biotin to biotin-5'-AMP, which covalently labels nearby proteins on accessible lysine residues. The labeling radius of BirA* is approximately 10 nm, ensuring only proteins in close proximity to the target protein are labeled.
(3) Cell Lysis and Protein Extraction
Cells are lysed using a strong denaturing buffer (such as RIPA or a buffer containing 1% SDS) to fully release the labeled proteins.
(4) Affinity Purification
The cell lysate is incubated with streptavidin magnetic beads, which efficiently capture the biotin-labeled proteins. Proteins are eluted using buffers containing biotin or SDS, or by boiling the beads in sample buffer.
(5) Mass Spectrometry Identification and Analysis
Eluted proteins are separated by SDS-PAGE, and gel bands are digested with trypsin. The resulting peptides are identified using LC-MS/MS.
- Mass Spectrometry Parameters: High-resolution Orbitrap, data-dependent acquisition (DDA) mode.
- Detection Depth: Thousands of proteins can typically be identified
(6) Result Delivery
Raw Data: Mass spectrometry raw files (.raw) and identification result tables.
Analysis Report:
- Protein interaction list (including Fold Change, p-value)
- Interaction network diagram (generated using tools like Cytoscape)
- Candidate protein functional predictions and pathway annotations
Visualization Results:
- Heatmap displaying significant interacting proteins
- Venn diagram showing interaction overlap under different conditions.
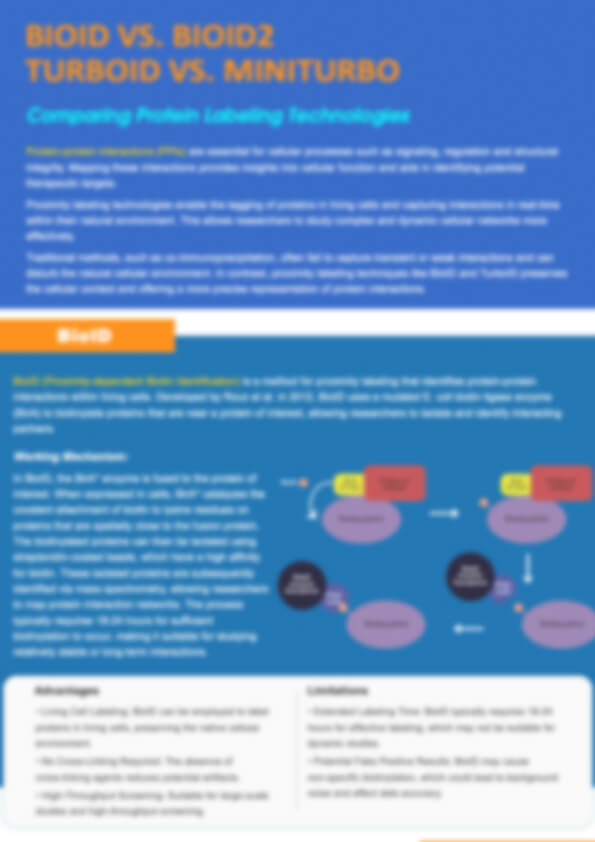
 >BioID workflow for the identification of direct and proximal protein–protein interactions (Mujeeb R et al., 2020)
Applications of BioID Analysis
Analyze Disease Mechanisms
Identify disease-associated disruptions in protein interactions to uncover novel biomarkers and therapeutic targets.
Accelerate Drug Discovery
Reveal potential drug targets and assess compound effects to accelerate the development of new therapeutics.
Characterize Protein Complexes
Identify multi-protein complexes to understand cellular machinery and disease-related pathways.
Compare Cross-Species Interactions
Perform interactome analysis across species to uncover conserved and species-specific protein networks.
Map Signal Transduction Pathways
Investigate protein interactions in signaling networks to gain insights into cellular responses and therapeutic opportunities.
Study Post-Translational Modifications
Detect PTMs and explore their impact on protein interactions to deepen understanding of cellular regulation.
Annotate Novel Proteins
Identify interaction partners of uncharacterized proteins to infer their biological functions.
Examine Membrane Proteins
Analyze membrane-associated protein networks that are essential for cell signaling, transport, and intercellular communication.
BioID vs. Other Protein Interaction Detection Methods
| Method | BioID | Co-IP | Y2H | FRET/BRET |
|---|---|---|---|---|
| Principle | Proximity labeling of proteins within 10 nm | Antibody-mediated capture of target and interacting proteins | Reconstitution of transcription factor activity in yeast cells | Fluorescence/Bioluminescence Resonance Energy Transfer |
| Detection Range | In living cells, within a 10 nm radius | In cell lysates, no spatial limitation | In yeast cells, no spatial limitation | In living cells, 1-10 nm distance |
| Dynamic Interactions | Supports (sBioID captures transient interactions) | Does not support (static capture after lysis) | Does not support (yeast system limitations) | Supports (real-time monitoring) |
| Spatial Information | Preserves (labeling occurs in situ) | Loses (spatial information destroyed after lysis) | Loses (expression in yeast cells) | Preserves (imaging in living cells) |
| Sensitivity | High (detects low-abundance proteins) | Medium (dependent on antibody quality) | High (yeast system amplifies signals) | High (fluorescence signal sensitive) |
| Specificity | High (biotin-avidin system strictly binds) | Medium (antibodies may non-specifically bind) | Low (yeast system prone to false positives) | High (dependent on fluorescence distance) |
| Applicable Samples | Mammalian cells, tissues | Cell lysates | Yeast cells | Living cells |
| Need for Antibodies | No | Yes (for target and interacting proteins) | No | No |
| Experimental Duration | 4-6 weeks | 2-4 weeks | 4-8 weeks | 2-4 weeks |
| Main Advantages | High-precision labeling in living cells, preserves spatial information | Widely used, mature technology | High-throughput screening | Real-time monitoring of dynamic interactions |
| Main Limitations | Long labeling time (sBioID optimized) | Static capture after lysis, loses spatial information | High false positives, not suitable for mammalian systems | Requires fluorescence labeling, strict distance limitations |
Scenario Comparison
| Scenario | BioID | Co-IP | Y2H | FRET/BRET |
|---|---|---|---|---|
| Membrane Protein Complex Studies | ⭐⭐⭐⭐⭐ | ⭐⭐ | ⭐ | ⭐⭐⭐ |
| Capturing Dynamic Interactions | ⭐⭐⭐⭐ | ⭐ | ⭐ | ⭐⭐⭐⭐⭐ |
| Analysis of Insoluble Structures | ⭐⭐⭐⭐⭐ | ⭐ | ⭐ | ⭐⭐ |
| High-Throughput Screening | ⭐⭐⭐ | ⭐⭐ | ⭐⭐⭐⭐⭐ | ⭐⭐ |
| Real-Time Interaction Monitoring | ⭐⭐ | ⭐ | ⭐ | ⭐⭐⭐⭐⭐ |
Sample Requirements for BioID-MS Analysis
| Sample Type | Recommended Sample Amount | Notes |
|---|---|---|
| Cell Lysate | 1-2 mg of protein | Ensure complete lysis and no protein degradation. |
| Whole Cell | 1-5 x 10⁷ cells | For optimal protein extraction, use freshly harvested cells. |
| Tissues (e.g., mouse tissue) | 50-100 mg of tissue | Fresh or frozen tissue recommended; homogenize before extraction. |
| Cultured Cells (Adherent) | 1-5 x 10⁷ cells | Recommended to use cells in the exponential growth phase. |
| Cultured Cells (Suspension) | 1-5 x 10⁷ cells | Ensure uniform suspension to avoid clumping. |
| Membrane Proteins | 1-2 mg of membrane protein | Isolate membranes carefully; use appropriate detergents for extraction. |
| Protein Complexes (Purified) | 1-5 mg of purified complex | Complexes should be free of contaminants and stored properly. |
Demo

HeLa cells, either wild type or stably expressing mBidWT–BirA*, mBidS66A–BirA*, mBidG94E–BirA* or venus BirA*, were grown with 50 µM biotin for 16 h in the presence (+) or absence (−) of nocodazole (Pedley, Robert, et al., 2020).

Venn diagram showing proteins identified as enriched by mBidWT–BirA* vs. venus BirA* under unsynchronised and nocodazole-treated conditions (Pedley, Robert, et al., 2020).
FAQ of BioID Analysis
Why is there high background noise in MS results?
Causes & Solutions:
- Incomplete washing: Use stringent buffers (e.g., 0.1% SDS + 1% Triton X-100) and increase wash cycles.
- Endogenous biotin: Block with avidin/biotin pre-treatment.
- Non-specific labeling: Include negative controls (empty vector or BirA*-only cells)
Can BioID study insoluble structures (e.g., nuclear bodies)?
Yes! BioID tolerates strong denaturing buffers (e.g., RIPA with 1% SDS), making it ideal for nuclear pore complexes, centrosomes, or aggregated proteins. TurboID is preferred for rapid labeling in such cases
How to validate BioID-identified interactors?
Validation Strategies:
- Orthogonal methods: Co-IP, in situ protein–protein interaction assays, or fluorescence colocalization.
- Functional assays: siRNA knockdown followed by phenotypic analysis.
- Bioinformatics: Filter candidates using GO/KEGG pathway enrichment (e.g., STRING database)
What if my bait protein is toxic when fused with BirA?*
Solutions:
- Use inducible promoters to control expression timing.
- Try split-BioID: Split TurboID into two fragments fused to interacting partners; reconstitution occurs only upon interaction, reducing basal activity
Can BioID work in animal models or primary cells?
Yes, but optimization is needed:
- In vivo: TurboID requires lower biotin doses (0.1–1 mg/kg) and shorter labeling times.
- Primary cells: Use lentiviral delivery for stable fusion protein expression
How to choose between BioID, TurboID, and APEX?
| Parameter | BioID | TurboID | APEX |
|---|---|---|---|
| Labeling Time | 12–24 hr | 10–30 min | 1–5 min |
| Radius | 10 nm | 10 nm | 20 nm |
| Compatibility | Mammalian | Broad | Requires H₂O₂ |
Use TurboID for fast in vivo studies; APEX for subcellular organelle mapping
Why are no interactors detected?
Troubleshooting:
- Verify fusion protein expression (Western blot with anti-BirA* antibody).
- Check biotin bioavailability (use ELISA to measure free biotin).
- Optimize cell lysis (avoid over-sonication)
Learn about other Q&A.
BioID Analysis Case Study

Publications
Here are some publications in Proteomics research from our clients:

- Lipid Membrane Engineering for Biotechnology (Doctoral dissertation, Aston University). 2023. https://doi.org/10.48780/publications.aston.ac.uk.00046663
- Multi‐omics identify xanthine as a pro‐survival metabolite for nematodes with mitochondrial dysfunction. 2019. https://doi.org/10.15252/embj.201899558
- White matter lipid alterations during aging in the rhesus monkey brain. 2024. https://doi.org/10.1007/s11357-024-01353-3
- B cell-intrinsic epigenetic modulation of antibody responses by dietary fiber-derived short-chain fatty acids. 2020. https://doi.org/10.1038/s41467-019-13603-6
- Microbial dysbiosis associated with impaired intestinal Na+/H+ exchange accelerates and exacerbates colitis in ex-germ free mice. 2018. https://doi.org/10.1038/s41385-018-0035-2