Title: Mass spectrometry imaging for in situ kinetic histochemistry
Journal: Scientific reports
Published: 2013
Background
Tissues are composed of diverse cell subpopulations with distinct metabolic characteristics, which influence overall behavior. Traditional histopathology imaging techniques are limited in their ability to capture spatially ordered metabolic dynamics. Mass spectrometry imaging (MSI) enables spatial mapping of molecular composition but lacks kinetic information about metabolic fluxes. To address this gap, a novel technique called kinetic mass spectrometry imaging (kMSI) was developed, combining soft desorption/ionization mass spectrometry with in vivo metabolic labeling using deuterium. This technique provides insights into the spatial distribution of metabolic activities in tissues, particularly in tumors, and reveals how different lipid subpopulations, including newly synthesized and pre-existing lipids, are spatially distributed.
Materials & Methods
Animal Care, Deuterium Administration, and Tissue Collection
Solid mammary tumors were induced by transplanting Trp53-null mammary epithelium fragments (from a BALB/c background) into the cleared fat pads of female F1 hybrid mice (produced by crossing BALB/c and SPRET/EiJ mice with BALB/c males). Deuterium (2H2O) was administered to these mice through an intraperitoneal bolus dose of sterile 99.9% 2H2O with 0.1% NaCl, followed by free access to drinking water containing 8% 2H2O and standard mouse chow. The animals were euthanized five days after administration, and mammary tumor tissue and serum were collected. These samples were immediately flash-frozen in dry ice and stored at -80°C. Tumor and serum were also collected from a control mouse that was not treated with 2H2O. All animal care and procedures followed protocols approved by the Animal Welfare and Research Committee at Lawrence Berkeley National Laboratory.
NIMS Imaging
For imaging, half of each tumor sample was embedded in OCT medium, sectioned at -18°C, and mounted on a NIMS chip. The other half was used for lipid extraction. Tumor sections (5 µm thick) were thaw-mounted onto the NIMS chip. Imaging was performed using a 5800 TOF/TOF mass spectrometer (AbSciex, Foster City, CA) in positive reflector MS mode with an Nd-YAG laser (200 Hz, 4650 laser intensity). Spectra were collected over a 500–1500 Da mass range, with a focus on 900 Da, and 18 shots per spot. Imaging was done in 50 µm × 50 µm steps using the 4800 Imaging Tool software and Matlab for image reconstruction.
Metabolite Extraction
Frozen tumor samples (approximately 4 mm × 4 mm) were lyophilized (20–50 mg dry weight) and homogenized using a Mini-Beadbeater. Extraction was done using 350 µL of a methanol:isopropanol:water mixture (35:35:30 v/v) for 4 seconds, repeated twice. The samples were then centrifuged, the supernatant was collected, filtered, and stored at -80°C.
NIMS of Tumor Extracts
Tumor extracts were spotted directly onto NIMS chips (0.5 µL per spot) and air-dried. Mass spectra were obtained using a 5800 TOF/TOF in positive reflector MS mode with an Nd-YAG laser (200 Hz, 2950 laser intensity). Spectra were acquired over the 250–1500 Da mass range, with 18–22 shots per spot.
LC-ESI-MS/MS of Tissue Extracts
Tissue extracts were analyzed using Liquid Chromatography-Electrospray Ionization-Mass Spectrometry (LC-ESI-MS) with both normal and reverse-phase chromatography. Normal-phase chromatography used a 2.1 mm × 150 mm 1.7 µm Acquity UPLC BEH Amide HILIC column (Waters Corp.) at a 40 µL/min flow rate. Reverse-phase chromatography used a 150 × 0.5 mm 5 µm Zorbax SB-C18 column (Agilent) at 30 µL/min. MS/MS fragmentation data were collected at 10, 20, and 40 V collision energies.
Histopathology Staining
Tumor sections (10 µm thick) were stained with hematoxylin and eosin (H&E) for histopathological examination. The Ki67 proliferation marker was detected using monoclonal antibody [SP6] to Ki67 (Abcam). Digital images were captured using a ScanScope XT system (Aperio).
Deuterium Enrichment in Serum
Serum deuterium levels were analyzed by cavity ringdown spectroscopy using a Liquid Water Isotope Analyzer (Los Gatos Research). Deuterium-enriched serum was diluted 1:100 for injection, and unenriched serum was analyzed without dilution. Each sample was analyzed in triplicate, and the average of the last three measurements was used for analysis.
NIMS Wafer Fabrication
NIMS surfaces were prepared by electrochemically etching silicon wafers (Silicon Quest International) using 25% hydrofluoric acid in ethanol under a constant current. The wafers were then coated with bis(heptadecafluoro-1,1,2,2-tetrahydrodecyl) tetramethyl-disiloxane (Gelest) to prepare the NIMS surface.
Mass Spectrometry Imaging Data Processing
Mass spectra from NIMS images (m/z values 790–880) were processed by importing raw data into Matlab. Peaks with high intensity were matched with theoretical masses of identified tumor lipids. The spectra were calibrated and further analyzed for lipid species identification.
Model of Isotopic Enrichment
The spectra from each pixel were deconvoluted into unlabeled and 2H-labeled lipid species. The isotopic enrichment was calculated based on the measured deuterium levels in body water and the maximum number of deuterium atoms that could be incorporated into lipids. The model used a fast Fourier transform method to generate isotopic patterns and fit the measured spectra using non-negative least squares fitting. The resulting data were used to calculate the relative fraction of newly synthesized lipids.
Kinetic Imaging of Lipid Flux Patterns
Kinetic images of lipid flux were generated based on the relative contributions of labeled and unlabeled lipid species in each spectrum. The isotopic enrichment model was used to calculate the relative intensity of each lipid, and these values were normalized for display in the images.
K-means Clustering
Pixels from mass spectrometry images were grouped into 9 regions using K-means clustering in Matlab. The algorithm used a correlation distance function to group pixels with similar spectral intensities. The process was repeated multiple times to ensure the accuracy of clustering.
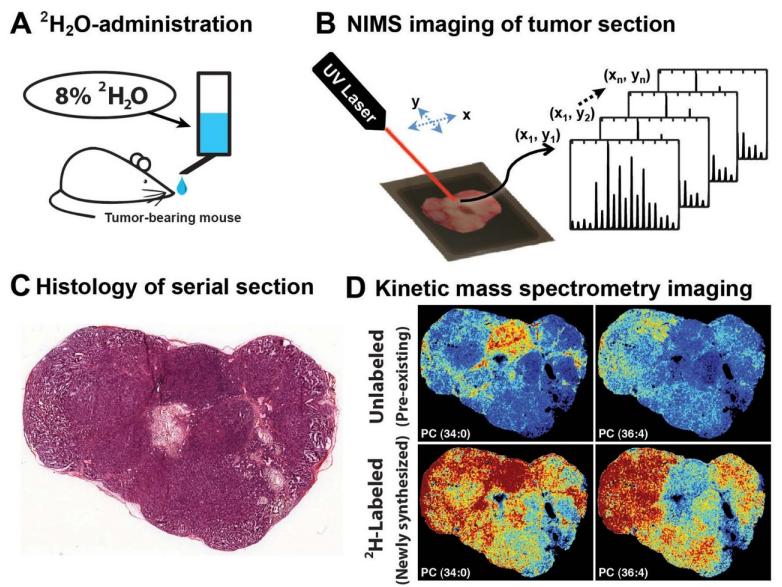
 Experimental workflow for using kMSI to define the spatial heterogeneity of lipid composition and biosynthesis.
Results
In vivo biosynthetic incorporation of deuterium into tissue:
- The kMSI workflow involved administering deuterated water (2H2O) to tumor-bearing mice, which incorporated deuterium (2H) into tissue lipids. Newly synthesized lipids became isotopically labeled with deuterium, while pre-existing lipids remained unlabeled.
- NIMS imaging of the deuterium-enriched tissue generated unique mass spectra for different lipids, which were deconvoluted to quantify specific unlabeled and newly synthesized lipids. This allowed determination of the relative amount of newly synthesized lipids and their spatial distribution.
Isotopic incorporation and validation:
- Isotopic incorporation of deuterium into lipids was confirmed by comparing mass spectra from control (untreated) and deuterium-treated mice. The spectra from treated tissues contained both labeled and unlabeled metabolites.
- LC-MS and NIMS analysis were used to identify lipids such as phosphatidylcholines (PCs), sphingomyelins (SMs), phosphatidylethanolamines (PEs), and phosphatidylserines (PSs) in tumor tissues.
Model of isotopic enrichment:
- A model was developed to quantify lipid composition and synthesis based on isotopic enrichment patterns. The model incorporated the number of deuterium atoms incorporated into lipids, based on the deuterium-enrichment of body water and lipid synthesis processes.
- The model allowed differentiation of newly synthesized (deuterium-labeled) lipids from pre-existing (unlabeled) lipids by analyzing mass spectra and determining isotopic enrichment.
Heterogeneous distribution of lipid flux:
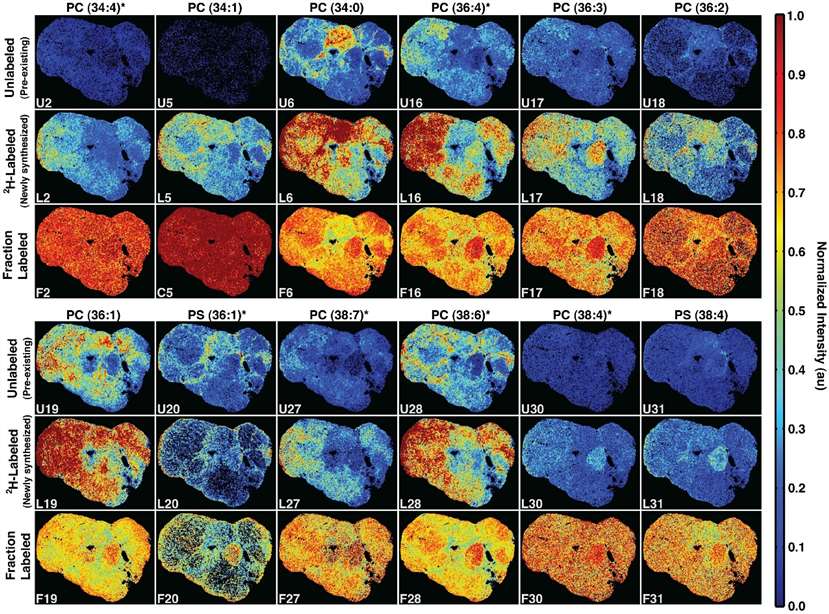
- The spatial distribution of newly synthesized and pre-existing lipids showed regional variation in lipid flux within the tumor. Newly synthesized lipids did not correspond to the distribution of pre-existing lipids, suggesting that metabolic processes were region-specific and could reflect distinct cellular subpopulations or characteristics of the tumor environment.
Identification of tumor sub-regions using kMSI spectra:
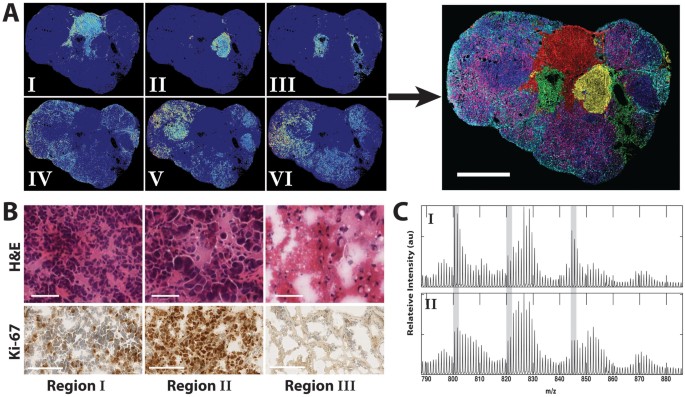
- K-means analysis was applied to the spectral data, clustering pixels into 9 distinct patterns based on spectral similarity. Three regions were identified as artifacts, while the remaining six were attributed to endogenous tumor phospholipids.
- These regions, corresponding to spatially distinct areas of the tumor, exhibited variations in lipid composition and synthesis, particularly in the tumor periphery.
Correlation with histopathology stains:
- Histopathology examination (H&E and Ki-67 stains) was used to link kMSI results with tumor morphology and cell proliferation.
- High rates of cell proliferation and high amounts of newly synthesized lipids were observed in regions with abnormal tissue architecture and nuclear pleomorphism (Regions I and II), which were identified as malignant.
- Necrotic areas in the tumor corresponded to regions with the lowest levels of lipid synthesis, while alterations in lipid composition in other regions (IV–VI) suggested the presence of heterogeneous cell subpopulations.
 Intensity images of twelve phospholipids, showing unlabeled (top), 2H-labeled (middle), and fraction labeled (bottom) levels.
 Spatial distribution of tumor phospholipids (A), H&E and Ki-67 stains (B), and average spectra for K-means regions I and II in the 2H-labeled tumor (C).
Reference
- Louie, Katherine B., et al. "Mass spectrometry imaging for in situ kinetic histochemistry." Scientific reports 3.1 (2013): 1656.


