Protein quantification — the measurement of protein abundance across experimental conditions — is a core capability in modern proteomics. Unlike qualitative identification, which answers "which proteins are present," quantification addresses the more biologically significant question: "how much does each protein change between conditions?" This distinction is critical for understanding biological mechanisms, identifying regulated pathways, and discovering protein candidates that correlate with specific phenotypes.
Mass spectrometry-based quantitative proteomics has matured dramatically over the past two decades. Early approaches relied on two-dimensional gel electrophoresis with densitometric spot comparison, which offered limited dynamic range and reproducibility. Modern LC-MS/MS-based methods now provide quantitative information across four to five orders of magnitude, with coefficients of variation below 20% for well-designed experiments, and the ability to quantify thousands of proteins from complex biological samples in a single run.
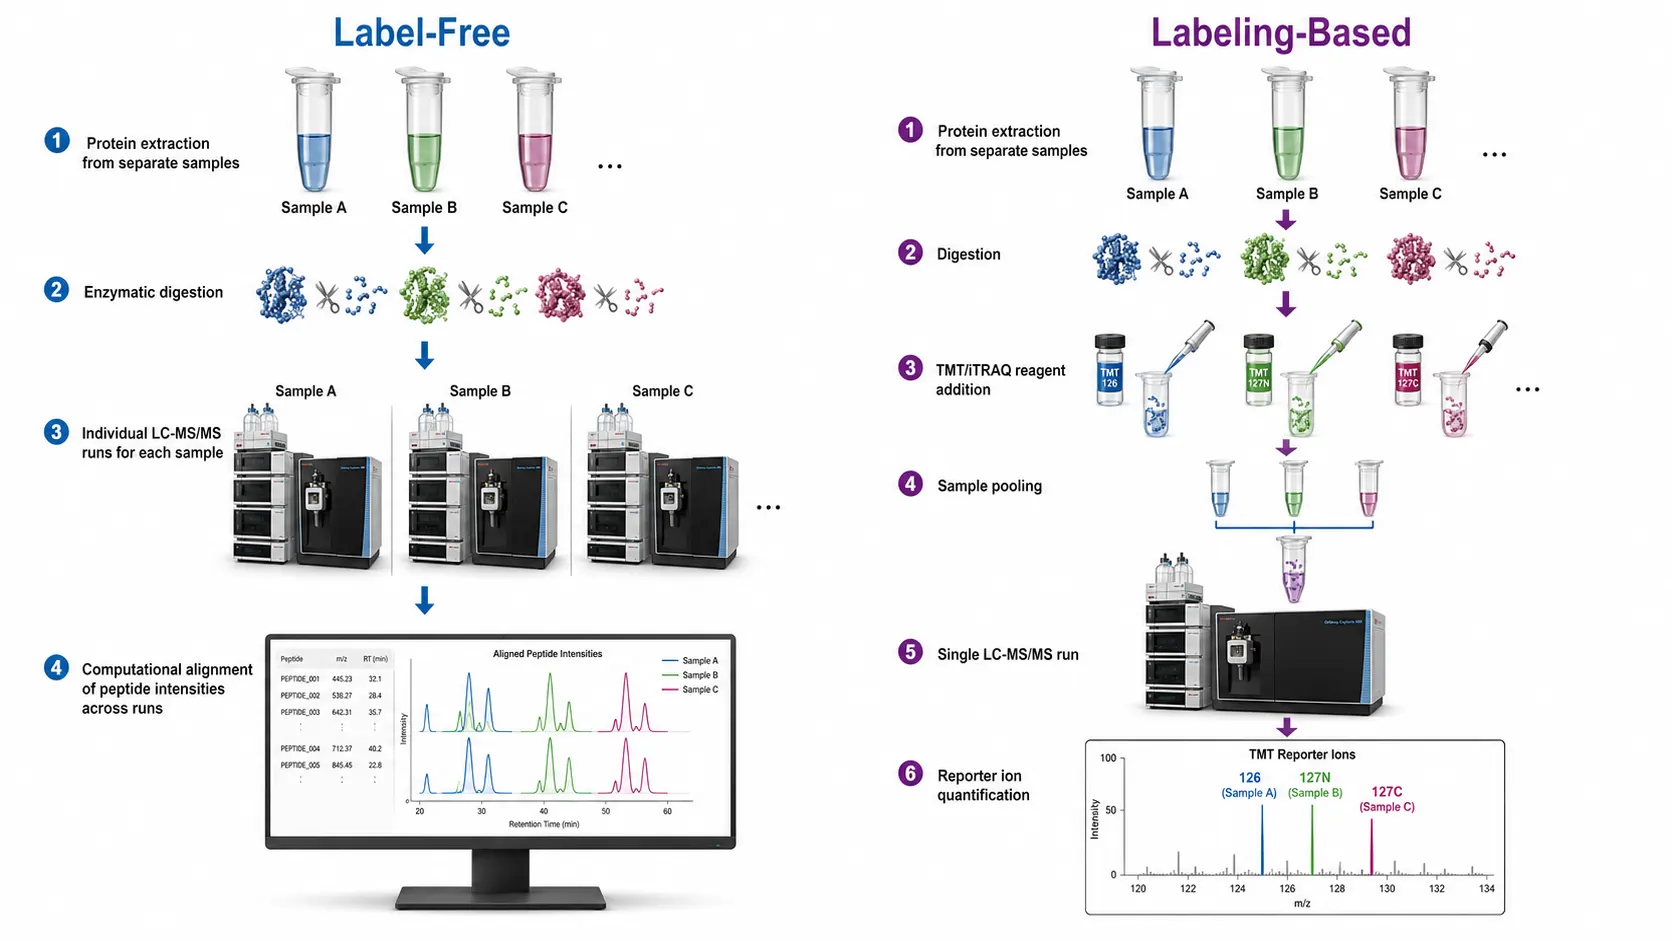
The core challenge in quantitative proteomics is that mass spectrometry is not inherently quantitative. The ionization efficiency of different peptides varies by orders of magnitude, and the same peptide ionizes differently depending on the sample matrix. Quantitative methods address this through two principal strategies: label-free approaches that compare signal intensities or spectral counts across separate LC-MS runs, and labeling approaches that introduce stable isotope tags to create internal standards that are measured within the same run. Each strategy has distinct strengths and limitations that determine its suitability for specific experimental designs.
Figure 1: Quantitative Proteomics Workflow Comparison — Label-Free vs. Labeling-Based Approaches
Principles of Quantitative Proteomics
Quantitative proteomics methods operate at two different mass spectrometry measurement levels, which fundamentally affects their precision and multiplexing capacity.
MS1-level quantification measures the intensity of intact peptide ions in the full-scan mass spectrum. In label-free experiments, the extracted ion chromatogram (XIC) areas of peptide precursors are compared across runs. In SILAC experiments, the ratio of light to heavy isotopolog peak pairs is calculated from MS1 spectra. MS1-level quantification provides broad proteome coverage because every identified peptide contributes quantitative data, but it requires high-resolution mass spectrometers (≥ 60,000 resolving power) to separate closely spaced isotopolog peaks.
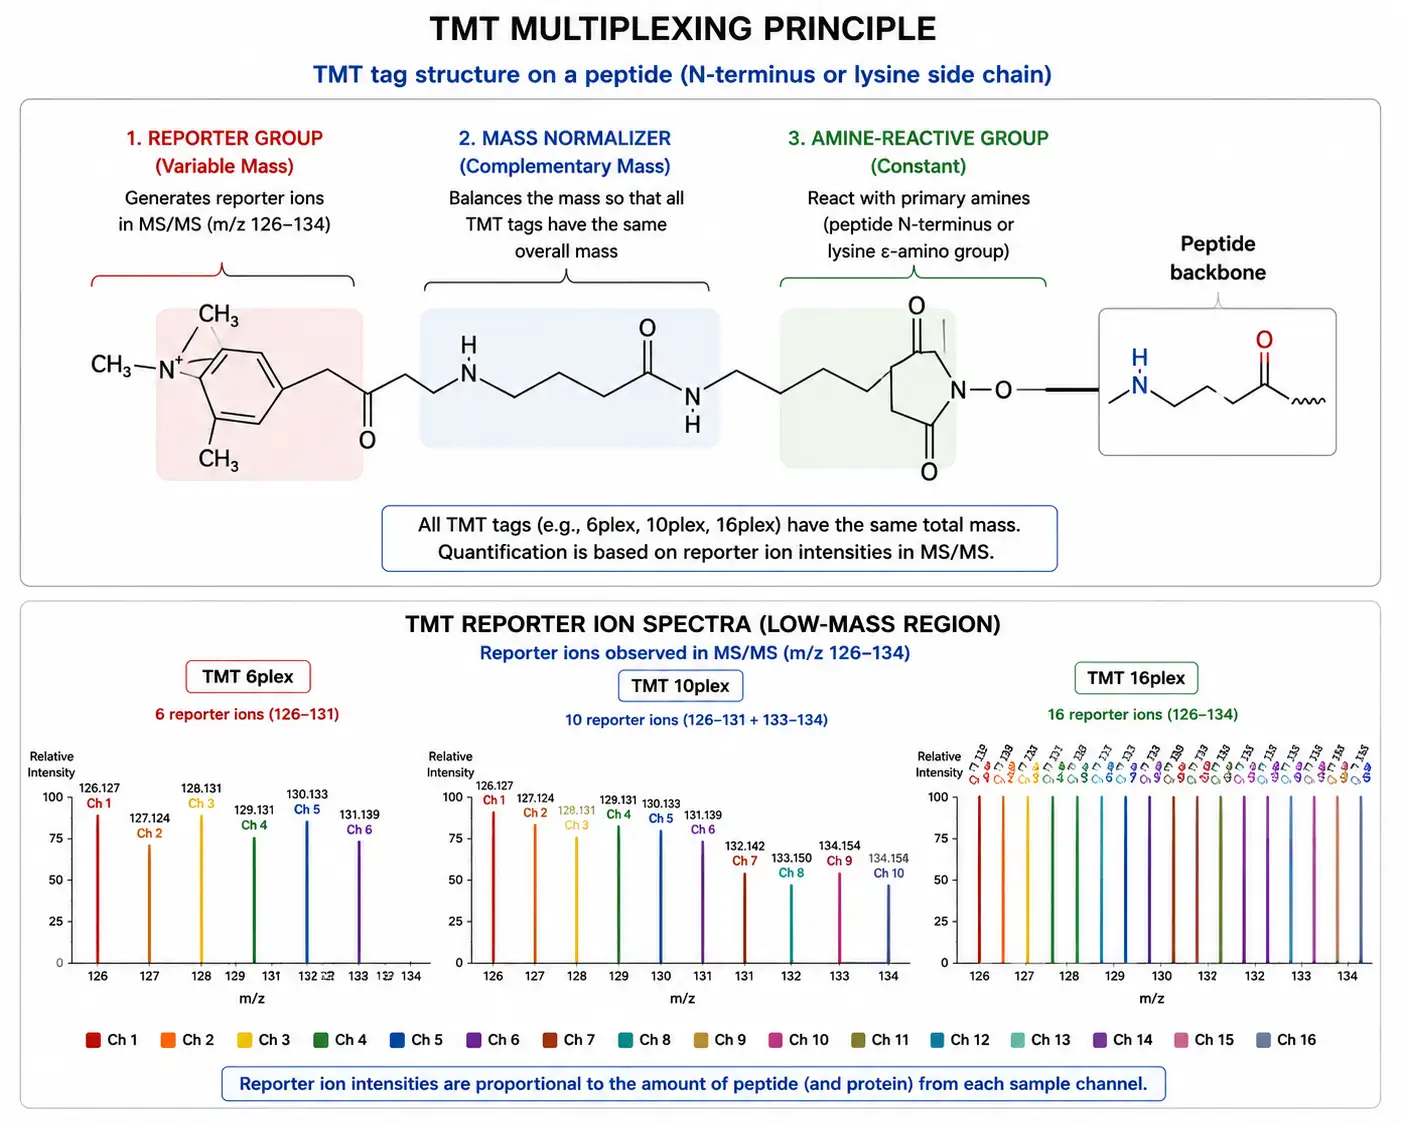
MS2-level quantification measures the intensity of fragment ions generated during peptide fragmentation. This is the basis for isobaric tagging methods such as iTRAQ and TMT, where reporter ions released during MS/MS fragmentation are used for quantification. MS2-level quantification enables higher multiplexing (up to 18 samples in a single experiment with TMTpro) but requires careful normalization because ratio compression due to co-isolated interfering peptides can reduce observed fold changes.
Absolute vs. relative quantification: Most proteomics experiments measure relative changes — fold differences between conditions — rather than absolute protein copy numbers. Relative quantification is sufficient for comparative experiments (treated vs. control, time course studies) and is the standard approach for discovery proteomics. Absolute quantification requires internal standards of known concentration, such as stable-isotope-labeled synthetic peptides (AQUA) or concatenated synthetic proteins (QconCAT), and is typically used for targeted validation of specific proteins.
Label-Free Quantification (LFQ)
Label-free quantification is the most straightforward and widely used approach in quantitative proteomics. The sample is digested into peptides, analyzed by LC-MS/MS, and the resulting data are processed to quantify protein abundance without any chemical or metabolic labeling. Two complementary quantification strategies are used: spectral counting and ion intensity-based quantification.
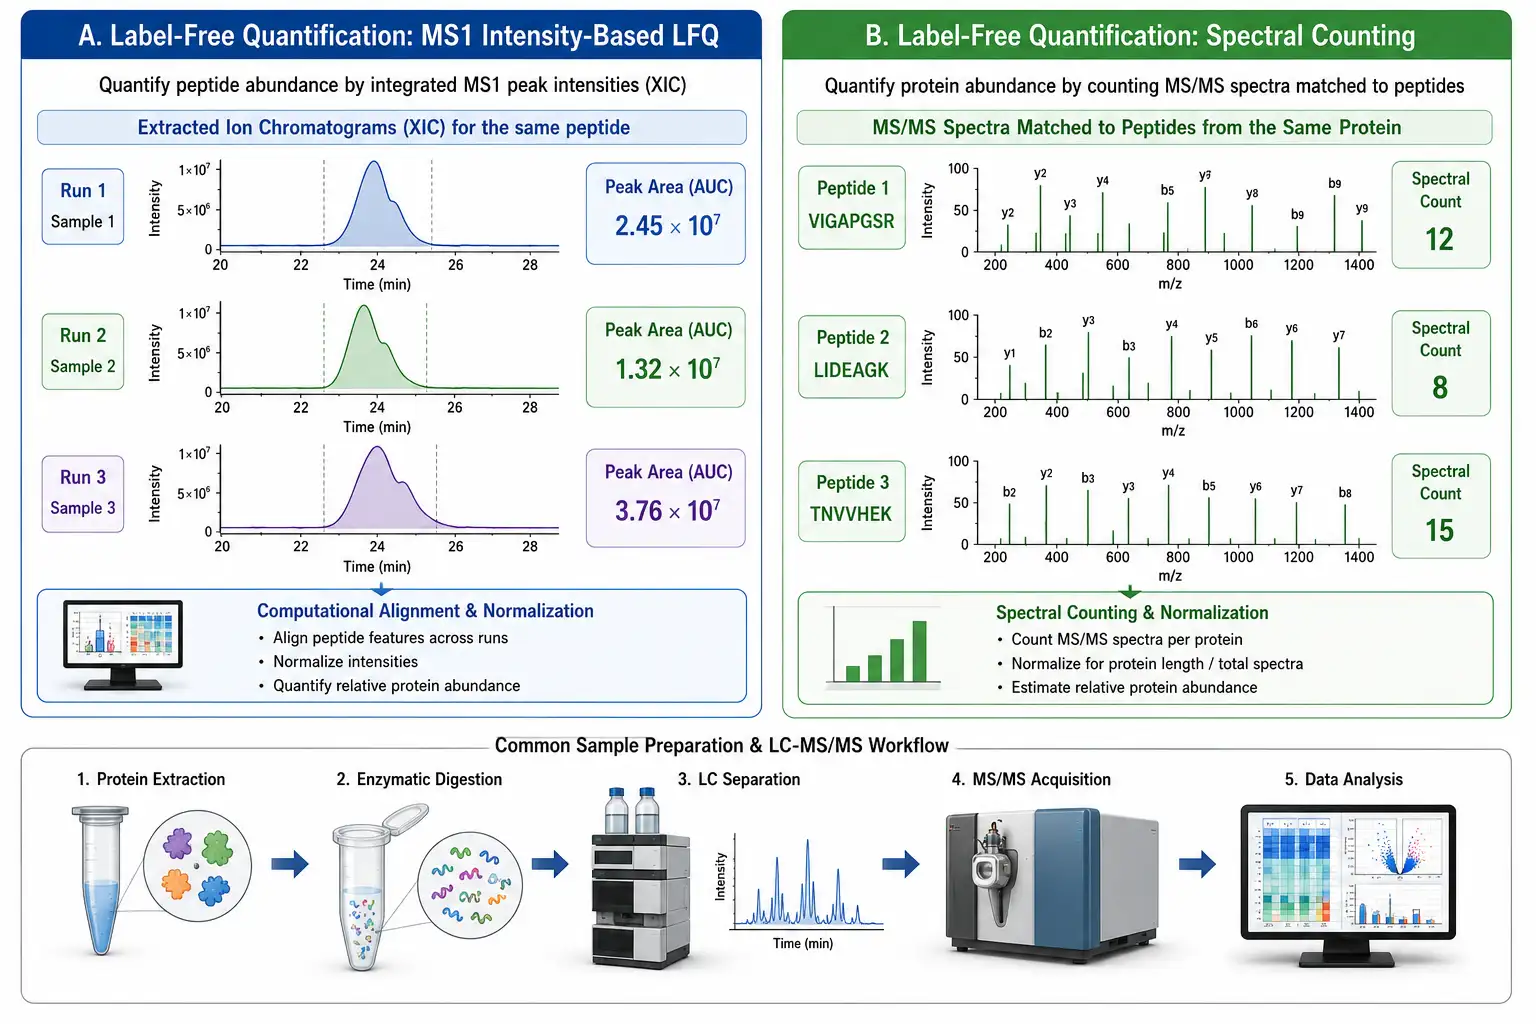
Spectral counting is based on the observation that more abundant proteins generate more peptide fragmentation events (MS/MS spectra) in a data-dependent acquisition experiment. The number of spectra matched to each protein — the spectral count — correlates linearly with protein abundance over approximately two orders of magnitude. Spectral counting is computationally simple and works without specialized software, but its quantitative precision is limited, with coefficients of variation typically in the 30-50% range.
Ion intensity-based quantification (MS1 LFQ) extracts the chromatographic peak area of each peptide precursor ion across the LC-MS run and compares the integrated intensities between samples. Software platforms such as MaxLFQ (integrated into MaxQuant) use the peptide intensity ratios to calculate protein abundance ratios with significantly better precision than spectral counting, achieving CVs of 10-20% for well-behaved proteins across triplicate analyses. The MaxLFQ algorithm requires at least two quantified peptides per protein and uses a robust least-squares regression to combine peptide-level ratios into protein-level ratios, minimizing the influence of outlier peptides.
Label-free quantification offers the broadest proteome coverage of any quantitative method because there is no labeling efficiency limitation and no reduced MS/MS sampling due to tag fragmentation. A typical label-free experiment can quantify 4,000-6,000 proteins from a 2-hour gradient analysis of a mammalian cell lysate. The absence of labeling reagents also makes label-free the most cost-effective approach for large sample sets, with per-sample costs limited to LC-MS/MS instrument time and standard reagents. However, the lack of an internal standard means that each sample must be analyzed in a separate LC-MS run, and run-to-run variability in chromatography and ionization efficiency introduces technical variation that must be controlled through careful experimental design.
Data normalization and missing value handling: After acquisition, label-free data require computational normalization to correct for systematic differences between runs. The MaxLFQ algorithm uses a delayed normalization approach that first identifies peptides quantified across all samples, calculates pairwise intensity ratios, and then uses robust regression to derive protein-level ratios that are resistant to outlier peptides. For datasets with high proportions of missing values — common in label-free experiments where low-abundance peptides are detected in some runs but not others — imputation strategies such as replacing missing values with noise-level intensities drawn from a normal distribution near the detection limit are standard practice. The choice of imputation method significantly affects downstream statistical analysis, particularly for proteins with abundance near the detection limit where missing values are not random but correlated with low abundance (missing not at random, MNAR). Advanced tools such as DEP (Differential Enrichment Analysis of Proteomics) and MSstats provide integrated normalization, imputation, and statistical testing workflows specifically designed for label-free proteomics data.
Label-free Quantification services provide standardized acquisition and data analysis workflows for reproducible quantitative comparisons.
Figure 2: Label-Free Quantification Workflow — MS1 Intensity-Based LFQ vs. Spectral Counting
SILAC (Stable Isotope Labeling with Amino Acids in Cell Culture)
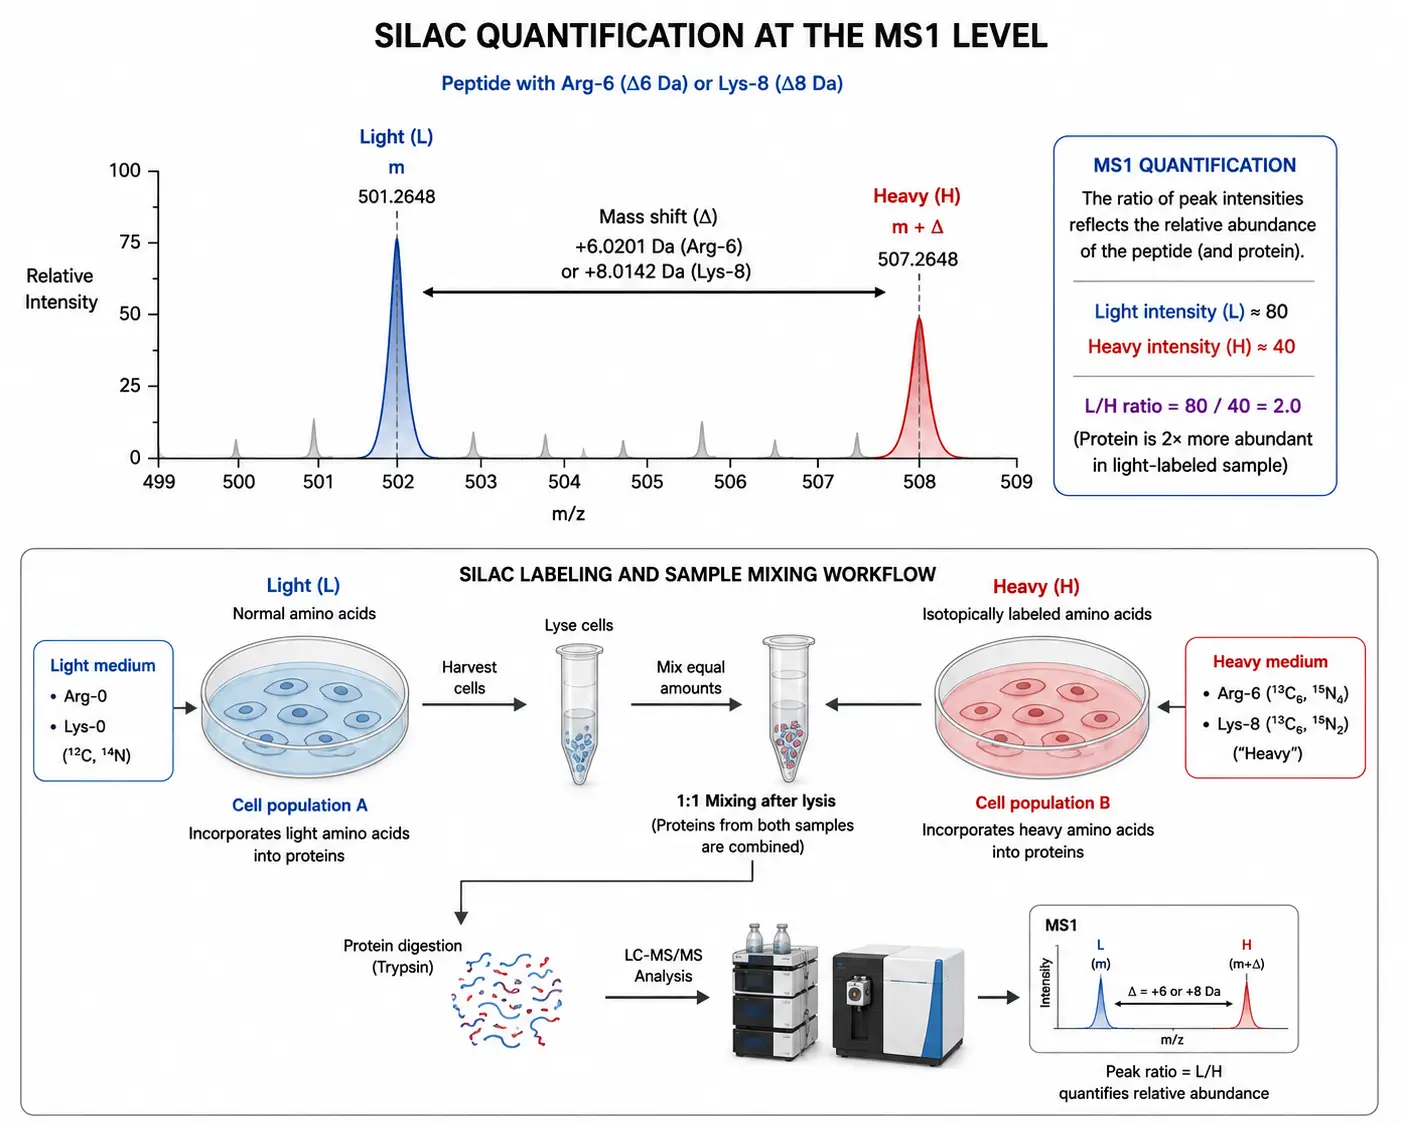
SILAC is a metabolic labeling strategy in which stable isotope-labeled amino acids — typically lysine and arginine with 13C or 15N substitutions — are incorporated into proteins during cell culture. The cell population of interest is grown in medium containing light (natural isotope abundance) or heavy (isotope-labeled) amino acids. After four to five cell doublings, the proteome reaches complete isotopic incorporation, and the heavy-labeled population can be mixed with the light-labeled population at the time of harvest. Because labeling occurs during cell growth, the samples can be combined immediately after harvesting, and all subsequent processing steps — lysis, digestion, fractionation, and LC-MS/MS analysis — are performed on the combined sample, eliminating processing-induced quantitative variation.
The SILAC quantification principle is straightforward. Each peptide from the heavy-labeled population appears in the MS1 spectrum with a mass shift of 6 Da (for 13C6-Arg) or 8 Da (for 13C6-Lys) relative to the corresponding light peptide. The ratio of the heavy to light peptide peak intensities in the MS1 spectrum reflects the relative abundance of that protein in the two conditions. Because each peptide serves as its own internal standard, SILAC provides the highest quantitative accuracy of any proteomics method, with CVs below 10% for well-designed experiments.
SILAC is most powerful for cell culture experiments, where complete labeling is achievable. The method has been extended to multicellular organisms — super-SILAC uses labeled cell lines as internal spike-in standards for tissue proteomics — enabling SILAC-based quantification of clinical tissue samples. The super-SILAC approach incorporates heavy-labeled proteins from cultured cells into tissue lysates as internal standards, allowing accurate quantification even when the tissue itself cannot be metabolically labeled. This strategy has been applied to quantify proteome differences in tumor tissue microenvironments, providing insights into cancer biology through research-focused study designs.
The limitations of SILAC are primarily practical. The labeled amino acids are expensive, and the method is largely restricted to cell culture systems (or model organisms fed labeled diets). For tissue samples or clinical specimens that cannot be metabolically labeled, super-SILAC or alternative labeling methods are required. Additionally, the number of conditions that can be compared simultaneously is limited by the available isotope variants — typically two or three (light, medium, heavy), although higher-order SILAC variants have been developed. SILAC-based Proteomics Analysis services provide complete experimental design, labeling, and data analysis for quantitative comparison studies.
Figure 3: SILAC Quantification Principle — MS1 Peptide Isotopolog Pairs
iTRAQ (Isobaric Tags for Relative and Absolute Quantification)
iTRAQ is a chemical labeling strategy that uses isobaric amine-reactive tags to label peptides after proteolytic digestion. The tag consists of three functional groups: a reporter group (with mass ranging from 113 to 121 Da for 8-plex iTRAQ), a balancer group (with a complementary mass that ensures the total tag mass is constant), and an amine-reactive group that attaches to peptide N-termini and lysine side chains. Because all iTRAQ-labeled peptides from different samples have identical masses at the MS1 level, labeled peptides co-elute and are co-isolated for MS/MS fragmentation, where the reporter ions are released and quantified.
The key advantage of iTRAQ is multiplexing — up to eight samples can be compared in a single LC-MS/MS experiment using the 8-plex format. This reduces the total instrument time per sample and eliminates run-to-run variability because all labeled samples are analyzed simultaneously. iTRAQ is particularly useful for time-course experiments, dose-response studies, and multi-condition comparisons where internal consistency across all conditions is critical.
The main technical challenge of iTRAQ quantification is ratio compression. During MS/MS fragmentation, co-isolated background peptides contribute their reporter ions to the MS/MS spectrum, diluting the measured fold changes. This effect is more pronounced for complex samples and limits the dynamic range of iTRAQ quantification. Advanced acquisition strategies such as multi-stage MS (MS3) on Orbitrap instruments can reduce ratio compression but require specialized instrumentation and reduce the number of quantified peptides. iTRAQ reagents are also more expensive per sample than label-free or SILAC approaches, making them most cost-effective for experiments where the multiplexing benefit outweighs the reagent cost.
Applications of iTRAQ in research settings include comparative proteomic profiling of cell lines under different treatment conditions, mapping of signaling pathways through phosphoproteomics, and identification of protein expression changes in response to genetic perturbations. iTRAQ-based Proteomics Analysis services offer full 8-plex experimental design and data interpretation for multi-condition comparison studies.
TMT (Tandem Mass Tags)
Tandem mass tags (TMT) are isobaric labeling reagents conceptually similar to iTRAQ but designed for higher multiplexing capacity. The TMT reagent structure consists of an amine-reactive group, a mass normalizer, and a reporter ion, with the reporter ion masses spaced by increments that are resolved by high-resolution mass spectrometry. The standard TMT 6-plex and 10-plex formats have been widely adopted, and the more recent TMTpro 16-plex and 18-plex formats have further expanded multiplexing capacity, enabling comparison of up to 18 samples in a single experiment.
The higher multiplexing capacity of TMT compared to iTRAQ provides several practical advantages. For time-course experiments with multiple time points, TMT enables all samples to be analyzed in a single run, eliminating inter-run variability entirely. For large cohort studies, TMT multiplexing reduces total instrument time by a factor equal to the multiplexing level — an 18-plex TMT experiment requires approximately one-eighteenth the instrument time of an equivalent label-free experiment. The reduced number of runs also conserves precious samples, as each sample is consumed only once for the combined analysis rather than in separate runs.
TMT quantification faces the same ratio compression challenge as iTRAQ, and the effect can be more pronounced at higher multiplexing levels where more labeled samples contribute to the co-isolation background. The use of MS3-based quantification on Tribrid Orbitrap instruments (Fusion, Eclipse) effectively eliminates ratio compression by isolating and fragmenting the reporter ions from a second stage of fragmentation, but at the cost of reduced MS/MS sampling depth. Synchronous precursor selection (SPS) MS3 improves sampling efficiency by co-isolating multiple MS2 fragment ions for MS3 analysis, providing accurate quantification with minimal loss of identifications.
Another practical advantage of TMT is that all labeled samples are processed through digestion and labeling simultaneously, reducing the variability introduced by separate processing workflows. This is particularly valuable for experiments comparing samples collected at different times or processed by different operators, as the labeling step effectively normalizes any pre-labeling variation. For large-scale TMT studies employing multiple multiplex sets — for example, comparing 100 clinical tissue samples across ten 10-plex TMT experiments — batch effects between multiplex sets become a critical consideration. The inclusion of a common reference channel (a pooled sample labeled in every multiplex set) enables normalization across batches, allowing data from different multiplex experiments to be combined for integrated analysis. Statistical tools such as ComBat and limma are adapted from transcriptomics to correct for TMT batch effects, identifying and removing systematic differences between multiplex sets while preserving biological variation. TMT based proteomics service provides complete experimental design, labeling, fractionation, and data analysis for high-plex quantitative proteomics studies, including multi-batch normalization strategies for large cohort projects.
Figure 4: TMT Multiplexing Strategy — 6-Plex to 18-Plex Reporter Ion Quantification
A Practical Decision Framework for Method Selection
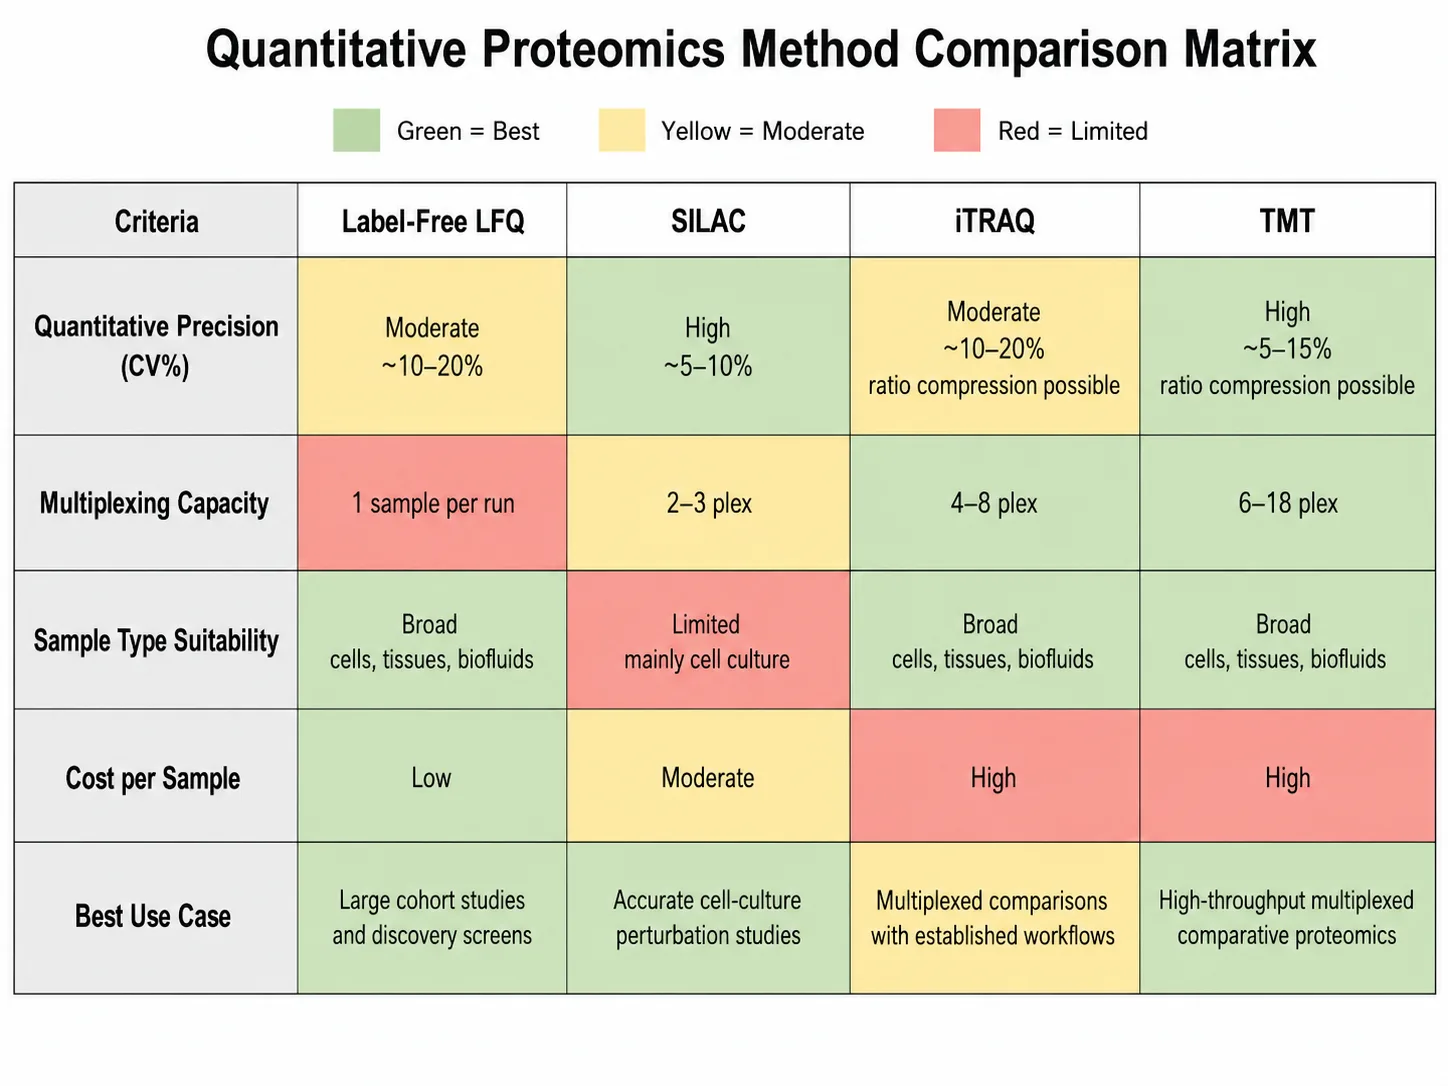
The choice between label-free, SILAC, iTRAQ, and TMT depends on the specific experimental constraints, including sample type, number of conditions, available instrument time, required quantitative precision, and budget. The following framework guides method selection based on the most common research scenarios.
For cell culture experiments comparing up to three conditions: SILAC is the method of choice when complete metabolic labeling is achievable. It provides the highest quantitative accuracy (CV below 10%) and eliminates processing-induced variation because labeled samples can be combined at harvest. The cost of labeled amino acids is justified by the superior data quality for hypothesis-driven mechanistic studies.
For large sample sets (50+ samples) with limited budget: Label-free quantification (MS1 LFQ) is the most practical approach. Per-sample costs are limited to instrument time and standard reagents, making it feasible for large cohort studies. The trade-off is higher technical variability (CV 10-20%) and the requirement for consistent acquisition over extended time periods, which requires robust instrument performance and regular quality control checks.
For multi-condition comparisons (4-18 samples): TMT or iTRAQ is preferred. The multiplexing benefit is most significant when comparing 6 or more conditions, as the ability to analyze all samples in a single run eliminates inter-run variability and reduces total instrument time. TMTpro 16-plex or 18-plex is recommended for the highest multiplexing capacity, while iTRAQ 8-plex remains a viable option for laboratories without access to the latest TMT chemistries.
For targeted quantification of specific proteins: Parallel reaction monitoring (PRM) or selected reaction monitoring (SRM/MRM) provides the highest sensitivity and specificity. These targeted approaches quantify predefined peptides using scheduled acquisition windows on triple quadrupole or quadrupole-Orbitrap instruments, achieving CVs below 5% for well-optimized assays. Targeted quantification is the preferred method for validation of biomarker candidates and precise measurement of protein abundance in clinical research samples.
For absolute quantification: AQUA (absolute quantification) using isotopically labeled synthetic peptide standards is required. The labeled standard peptides are spiked into the digest at known concentrations, and the ratio of endogenous to standard peptide signal provides absolute copy numbers. This approach is used when the biological question requires protein concentration rather than relative fold changes.
Figure 5: Protein Quantification Method Selection Decision Matrix
DIA and Emerging Quantification Strategies
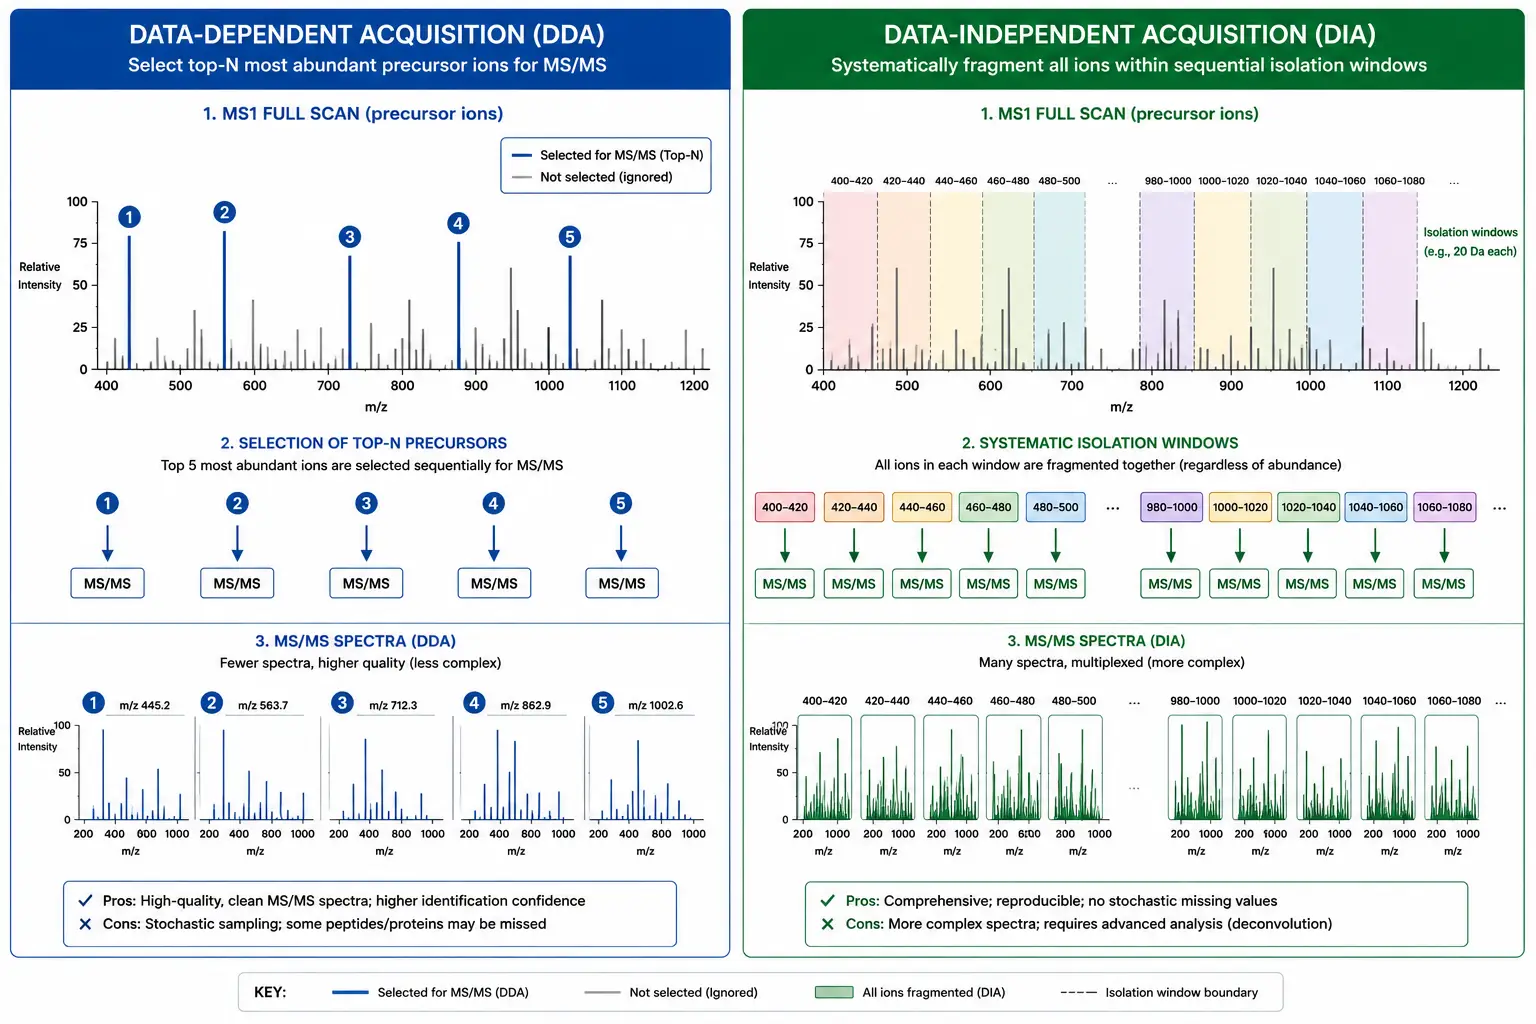
Data-independent acquisition (DIA) represents a paradigm shift in quantitative proteomics that addresses several limitations of traditional data-dependent acquisition (DDA) methods. In DIA, the mass spectrometer systematically fragments all precursor ions within defined isolation windows (typically 10-25 Da) across the full mass range, rather than selecting only the most abundant precursors for fragmentation as in DDA. The result is a complete digital map of all fragment ions from all detectable peptides in the sample.
The key advantage of DIA for quantification is its comprehensive and consistent sampling. Because all peptides are fragmented regardless of abundance, DIA provides quantitative information for every detectable precursor, including low-abundance peptides that may be missed by DDA's intensity-based precursor selection. The MS/MS spectra in DIA are more complex — they contain fragment ions from multiple co-fragmented peptides — but advanced computational tools using spectral libraries and machine learning algorithms (DIA-NN, Spectronaut, Skyline) deconvolute these spectra with high accuracy.
Spectral library-based vs. library-free DIA analysis: DIA data analysis follows two complementary strategies. Spectral library-based approaches match experimental DIA data against a pre-built library of peptide fragmentation spectra generated from prior DDA experiments of the same sample type. Libraries containing retention time, precursor mass, and fragment ion information for each peptide enable highly specific identification, with library-based tools such as Spectronaut and DIA-NN achieving identification rates of 40,000-80,000 peptides per 90-minute DIA run. The limitation is that library construction requires separate DDA runs, and the library may not contain all peptides present in the DIA data, particularly for low-abundance proteins and post-translational modifications. Library-free (direct) DIA analysis uses computational prediction of fragment ion spectra from peptide sequences, eliminating the need for a spectral library. Tools such as DIA-Umpire and the library-free mode of DIA-NN predict fragment ion patterns and match them directly to DIA data, enabling identification in sample types without prior DDA characterization. The trade-off is that library-free approaches typically identify 20-30% fewer peptides than library-based methods for the same dataset, although this gap is narrowing with improved prediction algorithms.
Quantitative performance comparison: In benchmark experiments using standard HeLa proteome samples, DIA with spectral library-based analysis consistently identifies 6,000-8,000 protein groups per 90-minute gradient at 1% FDR, compared to 4,000-5,500 for DDA under identical instrument conditions (Demichev et al., 2021). The quantitative reproducibility of DIA, measured as the median coefficient of variation across triplicate injections, ranges from 5-10% for medium- to high-abundance proteins to 15-25% for proteins near the detection limit. This represents a significant improvement over DDA, where stochastic precursor selection leads to higher missing value rates — typically 30-50% of peptides are quantified in fewer than half the runs in a DDA experiment, compared to 10-20% for DIA. The comprehensive nature of DIA data also enables retrospective re-analysis, where newly developed analysis methods can be applied to previously acquired DIA raw files without re-running the samples.
Recent advances in DIA technology (2024-2026):
- 4D-DIA proteomics incorporates ion mobility separation (TIMS) as an additional dimension of separation before MS/MS fragmentation, providing four dimensions of separation: retention time, ion mobility (1/K0), precursor mass, and fragment mass. The additional ion mobility dimension reduces spectral complexity and improves the specificity of peptide identification, enabling quantification of over 8,000 protein groups from a 90-minute gradient.
- Narrow-window DIA (nDIA) uses smaller isolation windows (2-4 Da instead of the standard 10-25 Da) to reduce the number of co-fragmented peptides per window, producing cleaner MS/MS spectra that can be analyzed without spectral libraries. The nDIA strategy was published in Nature Biotechnology in 2024 and demonstrated quantification of over 6,000 proteins from single cells.
- PASEF (Parallel Accumulation-Serial Fragmentation) on timsTOF platforms synchronizes ion mobility separation with MS/MS acquisition, achieving MS/MS acquisition rates above 100 Hz while maintaining high sensitivity. The combination of PASEF with DIA (diaPASEF) provides deep proteome coverage with quantitative reproducibility comparable to TMT.
These emerging strategies are increasingly adopted in research settings where the combination of deep coverage, high quantitative accuracy, and the ability to re-mining data for new hypotheses is valued. DIA Quantitative Proteomics Service and 4D-DIA Quantitative Proteomics Service provide state-of-the-art DIA-based quantification for research projects requiring comprehensive proteome coverage.
Figure 6: DDA vs DIA Acquisition Comparison — Comprehensive Sampling in DIA
Key Considerations for Accurate Protein Quantification
Regardless of the quantification method chosen, several experimental factors critically affect data quality and should be carefully controlled.
Sample preparation consistency: Variation introduced during protein extraction, digestion, and peptide cleanup is the largest source of technical noise in quantitative proteomics. All samples in a comparison should be processed in parallel using identical protocols, reagents, and incubation times. Using a protease digestion kit with standardized conditions reduces digestion variability. Peptide quantification after digestion (by A280 absorbance or fluorometric assay) ensures equal loading onto the LC-MS system, which is particularly important for label-free experiments where loading differences directly affect measured intensities.
Normalization strategies: Global normalization corrects for systematic differences in total peptide signal between runs. For label-free experiments, normalization to total peptide intensity (the sum of all quantified peptide intensities) or to a set of consistently identified housekeeping proteins is standard practice. For labeling experiments, normalization ensures that the total reporter ion intensity is equal across all channels, correcting for any differences in total protein amount after labeling. Median normalization is more robust than mean normalization because it is less affected by extreme values from highly abundant proteins that may change between conditions.
Statistical analysis and multiple testing correction: Identifying significantly changing proteins requires appropriate statistical testing that accounts for the multiple comparison problem inherent in proteomics experiments. For two-condition comparisons, Student's t-test or Welch's t-test is applied to the log-transformed intensity values for each protein — log transformation is essential because protein intensity distributions are approximately log-normal, and variance stabilization improves statistical performance. For multi-group comparisons, ANOVA or linear models are used. Since 4,000-8,000 statistical tests are performed simultaneously, correction for multiple hypothesis testing is mandatory. The Benjamini-Hochberg false discovery rate (FDR) procedure is the most widely used correction, controlling the expected proportion of false positives among proteins declared significant. A q-value threshold of 0.05 (5% FDR) is standard. For experiments with limited replicates (n=2-3), empirical Bayes methods such as limma (originally developed for microarrays, now adapted for proteomics) borrow information across all measured proteins to stabilize variance estimates, improving statistical power while maintaining FDR control. Tools such as MSstats and DEP integrate these statistical workflows specifically for proteomics data, supporting both label-free and labeled experimental designs with appropriate data transformations and model assumptions.
False discovery rate control: For identification, a 1% FDR at both the peptide and protein level is the standard threshold for publication and regulatory submission. For quantification, the FDR for detection of differential expression depends on the fold change threshold and the number of replicate analyses. For label-free experiments with three biological replicates, a fold change threshold of 1.5- to 2-fold combined with a t-test p-value below 0.05 typically provides adequate statistical power. For TMT and iTRAQ experiments, the ratio compression effect means that higher fold change thresholds are recommended — typically 1.5- to 2.5-fold for TMT versus 2- to 3-fold for label-free.
Replicate design: Biological replicates (independent samples from different subjects or cultures) are essential for generalizable conclusions. Technical replicates (re-analysis of the same sample) measure instrument variability but do not improve statistical power for detecting biological differences. For discovery proteomics, three to five biological replicates per condition is the standard recommendation. Increasing replicates improves statistical power but with diminishing returns — the gain from adding a fourth replicate is approximately half the gain from adding the third.
Applications of Quantitative Proteomics in Biomedical Research
Quantitative proteomics methods have been applied across a wide spectrum of biomedical research areas, from basic cell biology to translational studies. The techniques described in this guide enable researchers to address fundamental questions about protein expression dynamics, signaling pathway activation, and cellular responses to experimental perturbations.
Comparative proteomic profiling: The most common application of quantitative proteomics is comparing protein expression between experimental conditions — treated versus control cells, different developmental stages, or genetically modified versus wild-type organisms. Label-free and TMT methods are the most frequently used for this purpose, with TMT offering the advantage of multiplexed comparison across multiple conditions in a single experiment. These studies identify differentially expressed proteins that serve as candidates for further functional validation.
Post-translational modification analysis: Quantitative phosphoproteomics, ubiquitinomics, and acetylomics use enrichment strategies combined with SILAC or TMT quantification to measure changes in site-specific modification occupancy. The combination of PTM enrichment with quantitative methods allows researchers to identify signaling nodes that are activated or suppressed under specific conditions, providing mechanistic insight into cellular regulatory networks.
Protein-protein interaction dynamics: Quantitative proteomics is used to characterize changes in protein interaction networks in response to stimuli or genetic perturbations. Affinity purification followed by quantitative MS (AP-MS) compares bait-associated proteins between conditions, identifying condition-specific interaction partners. SILAC-based quantitative AP-MS provides the highest accuracy for these studies because the metabolic labeling minimizes processing variability. The combination of cross-linking mass spectrometry with quantitative methods further enables identification of interaction interfaces and conformation-dependent binding changes.
Differential proteomics in drug development: Quantitative proteomics is increasingly integrated into drug development pipelines to characterize target engagement, assess on- and off-target effects, and identify mechanisms of drug resistance. Label-free and TMT methods enable comprehensive profiling of proteome-wide changes following compound treatment in cell-based models, providing a systems-level view of drug action that complements transcriptomic and phenotypic data. Time-resolved quantitative proteomics using TMT multiplexing can map the temporal dynamics of signaling pathway modulation, revealing early versus late proteomic responses to therapeutic interventions.
Biomarker discovery in research models: Quantitative proteomics of cell lines, organoids, and animal models enables the identification of protein candidates that correlate with specific phenotypes — drug resistance, metastatic potential, or response to genetic perturbations. These research findings form the foundation for subsequent validation studies and contribute to understanding disease mechanisms at the molecular level.
Frequently Asked Questions
What is the difference between label-free and labeling-based quantification?
Label-free quantification compares peptide intensities across separate LC-MS runs without internal standards. Labeling-based methods (SILAC, iTRAQ, TMT) incorporate stable isotope tags that serve as internal standards, enabling quantification within a single run with higher precision.
Which quantification method provides the highest accuracy?
SILAC provides the highest accuracy (CV below 10%) because samples are combined at the protein level before any processing. TMT and iTRAQ have CVs of 10-20%, and label-free LFQ has CVs of 15-25% for well-designed experiments.
How many samples can be compared in a single TMT experiment?
Standard TMT formats support 6-plex and 10-plex. TMTpro extends to 16-plex and 18-plex, allowing comparison of up to 18 samples in a single LC-MS/MS experiment.
What is ratio compression in isobaric labeling?
Ratio compression occurs when co-isolated interfering peptides contribute their reporter ions during MS/MS, diluting the measured fold changes. MS3-based quantification reduces this effect but requires specialized instrumentation.
How much protein is needed for a quantitative proteomics experiment?
For label-free experiments, 1-100 micrograms of total protein digest per sample. For TMT or iTRAQ, 10-200 micrograms per channel. For SILAC, 100-500 micrograms of labeled protein per condition is typical.
What is the difference between DDA and DIA?
DDA (data-dependent acquisition) selects the most abundant precursor ions for MS/MS, while DIA systematically fragments all precursors within defined isolation windows. DIA provides more complete and reproducible quantification but requires more sophisticated data analysis.
Can I combine different quantification methods in the same study?
Yes. A typical workflow uses label-free or TMT for discovery-phase screening, followed by PRM/SRM for targeted validation of specific candidates. The methods are complementary, not mutually exclusive.
How many biological replicates are needed?
Three to five biological replicates per condition is the standard recommendation for discovery proteomics. More replicates improve statistical power but with diminishing returns beyond five.
References
- Cox, J., Hein, M. Y., Luber, C. A., Paron, I., Nagaraj, N., & Mann, M. (2014). Accurate proteome-wide label-free quantification by delayed normalization and maximal peptide ratio extraction, termed MaxLFQ. Molecular and Cellular Proteomics, 13(9), 2513-2526. doi:10.1074/mcp.M113.031591
- Ong, S. E., Blagoev, B., Kratchmarova, I., Kristensen, D. B., Steen, H., Pandey, A., & Mann, M. (2002). Stable isotope labeling by amino acids in cell culture, SILAC, as a simple and accurate approach to expression proteomics. Molecular and Cellular Proteomics, 1(5), 376-386. doi:10.1074/mcp.M200066-MCP200
- Luo, Y., Mok, J. C. H., Lee, A. S., & Michael Siu, K. W. (2022). A benchmarking protocol for intact protein-level Tandem Mass Tag (TMT) labeling for quantitative top-down proteomics. MethodsX, 9, 101848. doi:10.1016/j.mex.2022.101848
- Demichev, V., Messner, C. B., Vernardis, S. I., Lilley, K. S., & Ralser, M. (2021). A benchmark study of data-independent acquisition (DIA) software tools for quantitative proteomics. Nature Communications, 12, 789. doi:10.1038/s41467-022-35740-1