Amino Sugars Analysis Service
Amino sugar profiles tell the hidden story of glycosylation, cell wall integrity, and biomaterial performance. Whether you are mapping the hexosamine pathway, characterizing microbial peptidoglycan, or validating glycoconjugates, your data must be both precise and reproducible. We deliver the clarity you need with workflows that go beyond generic carbohydrate analysis.
What We Offer:
- Covering What Matters Most – From GlcN and GalNAc to sialic acids, UDP-HexNAc, and muramic acid in one integrated workflow.
- Data You Can Trust – Sub-ng/mL sensitivity, calibration verified at every batch, and cross-platform confirmation.
- Built for Complex Matrices – From fermentation broth to purified polysaccharides, with validated extraction and hydrolysis strategies.
- Custom When It Counts – Tailored methods for rare targets and isotope-based quantification for absolute accuracy.
Submit Your Request Now
×
Deliverables
- Quantitative tables & QC report
- Annotated chromatograms
- Method files & raw data snippet
- Optional pathway mapping visuals
- What We Provide
- Advantages
- Technology Platform
- Sample Requirement
- Demo
- Case
- FAQs
What are Amino Sugars?
Amino sugars are hexose derivatives in which a hydroxyl group is replaced by an amino group (e.g., glucosamine, galactosamine, mannosamine). Their N-acetylated forms—GlcNAc, GalNAc, ManNAc—are central building blocks of glycoproteins, glycolipids, proteoglycans, bacterial peptidoglycan (muramic acid), and sialylated structures (Neu5Ac/Neu5Gc). Cellular pools also include phosphorylated intermediates (e.g., GlcN-6-P) and nucleotide-activated donors (e.g., UDP-GlcNAc, UDP-GalNAc) that drive glycosylation.
 Figure. Amino sugars. The monosaccharides glucosamine and galactosamine are amino sugars with the amino group in place of a hydroxyl group.
When and Why You Need Amino Sugars Analysis
Designed around typical research questions:
- Glycosylation pathway mapping: Quantify UDP-HexNAc pools to infer flux through the hexosamine biosynthetic pathway and O-GlcNAcylation potential.
- Cell wall/bioprocess analytics: Track muramic acid and GlcN/GalN to characterize microbial biomass, peptidoglycan turnover, or contamination in upstream/downstream processes.
- Biomaterials & polysaccharides: Characterize chitin/chitosan hydrolysates, hyaluronan monomers (GlcNAc), and GAG building blocks.
- Nutritional & plant studies: Profile amino sugars and sialic acids in food, feed, plant tissues, and fermentation broth.
- Quality assessment of glycoconjugates: Verify amino sugar composition in research-grade glycoproteins, vaccines, or exopolysaccharides.
Creative Proteomics's Amino Sugars Analysis Solutions
Hexosamine Pathway Flux Analysis
Quantify intracellular pools of amino sugars and nucleotide-activated donors to assess glycosylation potential and cellular metabolism. Ideal for studying O-GlcNAcylation, UDP-HexNAc synthesis, and signaling crosstalk.
Sialic Acid Profiling and O-Acetyl Variant Detection
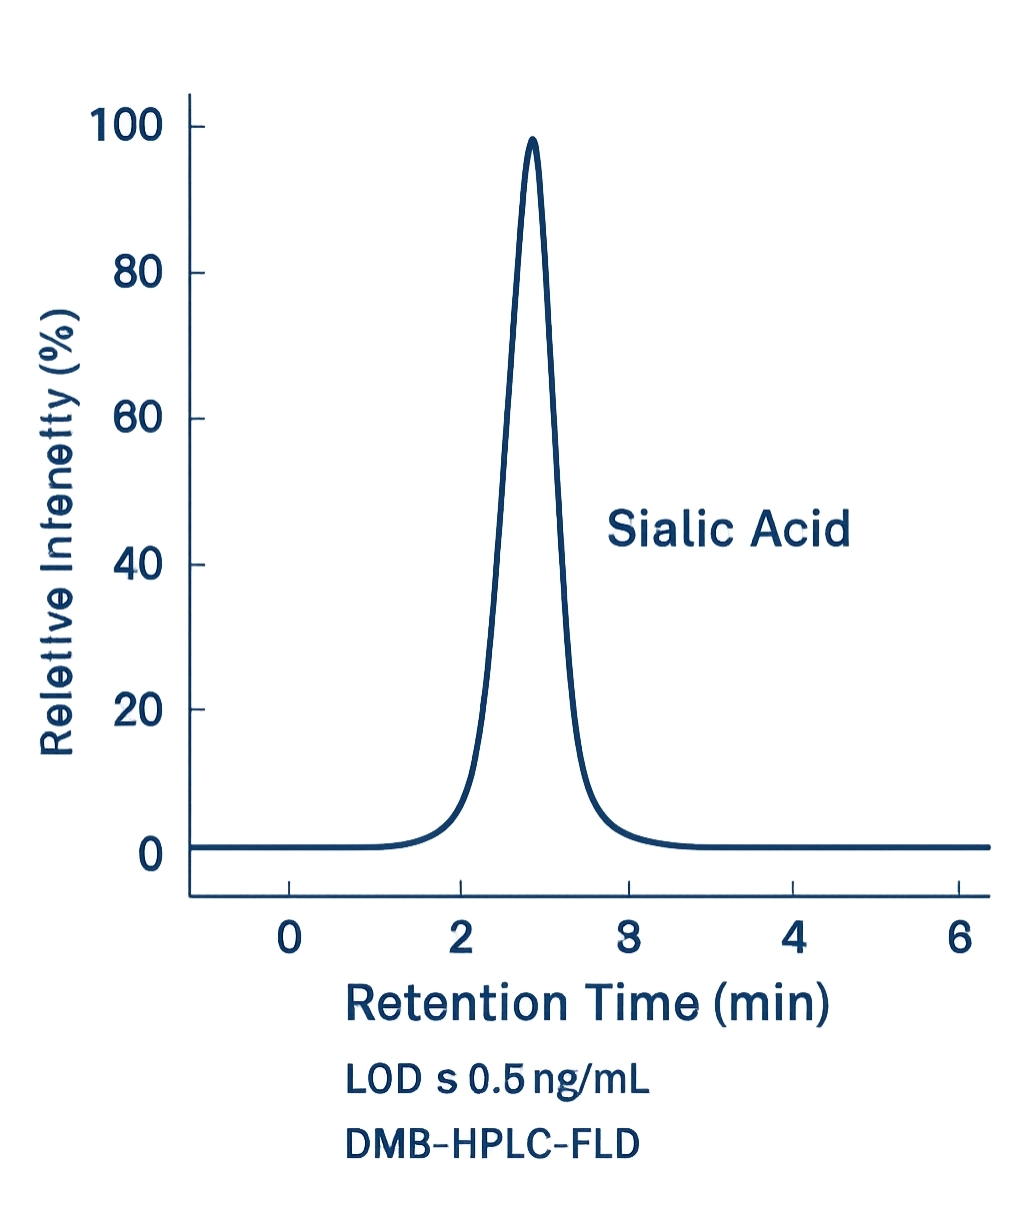
High-sensitivity DMB-HPLC-FLD and LC-MS/MS workflows to distinguish Neu5Ac, Neu5Gc, KDN, and rare O-acetylated derivatives—critical for glycoprotein characterization, vaccine component evaluation, and nutritional research.
Microbial Biomass and Peptidoglycan Fingerprinting
Targeted analysis of muramic acid and related amino sugars for microbial cell wall integrity studies, contamination assessment, and process control in fermentation and cell-based systems.
Polysaccharide and Glycoconjugate Composition Analysis
Deconstruct complex matrices such as chitin, chitosan, and hyaluronan into their amino sugar building blocks to support biomaterial development and functional food studies.
Custom Method Development for Unconventional Targets
Fit-for-purpose assays for rare or modified amino sugars, isotope-labeled standards integration, and validation across diverse sample types—from plant tissues to engineered cell lines.
List of Detected Amino Sugars and Related Metabolites
| Category | Representative Analytes | Extended/Optional Targets | Primary Analytical Methods |
|---|---|---|---|
| Free Amino Sugars | Glucosamine (GlcN), Galactosamine (GalN), Mannosamine (ManN) | GlcN-1-P, GlcN-6-P, ManNAc-6-P | HPAEC-PAD; LC-MS/MS (HILIC) |
| N-Acetylated Sugars | N-Acetylglucosamine (GlcNAc), N-Acetylgalactosamine (GalNAc), N-Acetylmannosamine (ManNAc) | GlcNAc-6-P, GalNAc-4S, GalNAc-6S | HPAEC-PAD; LC-MS/MS |
| Sialic Acids | Neu5Ac, Neu5Gc, KDN | Neu5,7Ac₂, Neu5,8Ac₂, Neu5,9Ac₂, O-Acetylated variants, CMP-Neu5Ac | DMB-HPLC-FLD; LC-MS/MS |
| Nucleotide Sugars | UDP-GlcNAc, UDP-GalNAc, UDP-Glc, UDP-Gal | CMP-Neu5Ac, CMP-Neu5Gc, GDP-Man, GDP-Fuc, UDP-Xyl | LC-MS/MS (HILIC), Orbitrap/Triple Quad |
| Polysaccharide-Derived Monomers | Chitin/chitosan hydrolysates (GlcNAc) | Fucosamine (FucN), Quinosamine (QuiN), Bacillosamine, Abequosamine | Acid/enzymatic hydrolysis + LC-MS/MS |
| Peptidoglycan Markers | N-Acetylmuramic acid (MurNAc) | MurNAc-L-Ala-D-Glu (fragment), N-Acetylglucosamine-1,6-lactam ring structures | LC-MS/MS; GC-MS confirmatory |
Advantages of Our Amino Sugars Analysis Services
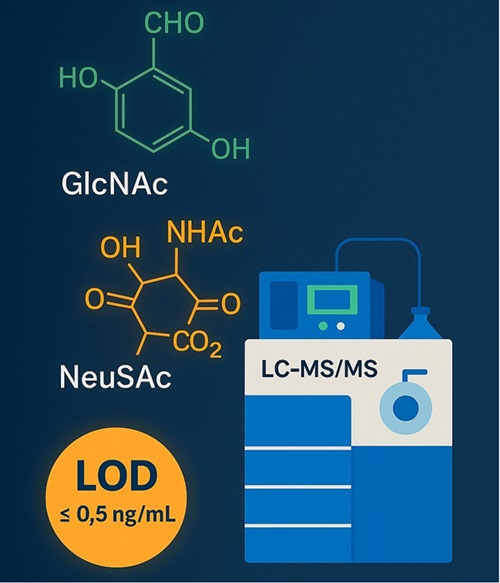
- High sensitivity: LOD down to 1–5 ng/mL for free HexNAc in clean matrices by HPAEC-PAD; ≤0.5 ng/mL for DMB-labeled sialic acids (Neu5Ac/Neu5Gc) by HPLC-FLD; ≤2 ng/mL for nucleotide sugars by LC-MS/MS (matrix-dependent).
- Wide linear range: ≥4 orders of magnitude (R² ≥ 0.995) across primary panels.
- Robust precision: Intra-assay CV ≤ 8%, inter-assay CV ≤ 12% with stable-isotope internal standards.
- High recovery: Spike-recovery typically 90–110% after matrix-matched calibration and SPE/online cleanup.
- Cross-platform confirmation: Orthogonal readouts (HPAEC-PAD ↔ LC-MS/MS; optional GC-MS) minimize false positives.
- Matrix versatility: Validated extraction and hydrolysis schemes for aqueous, proteinaceous, and polymeric samples; salt-tolerant gradients for bioprocess media.
Workflow for Amino Sugars Analysis Service
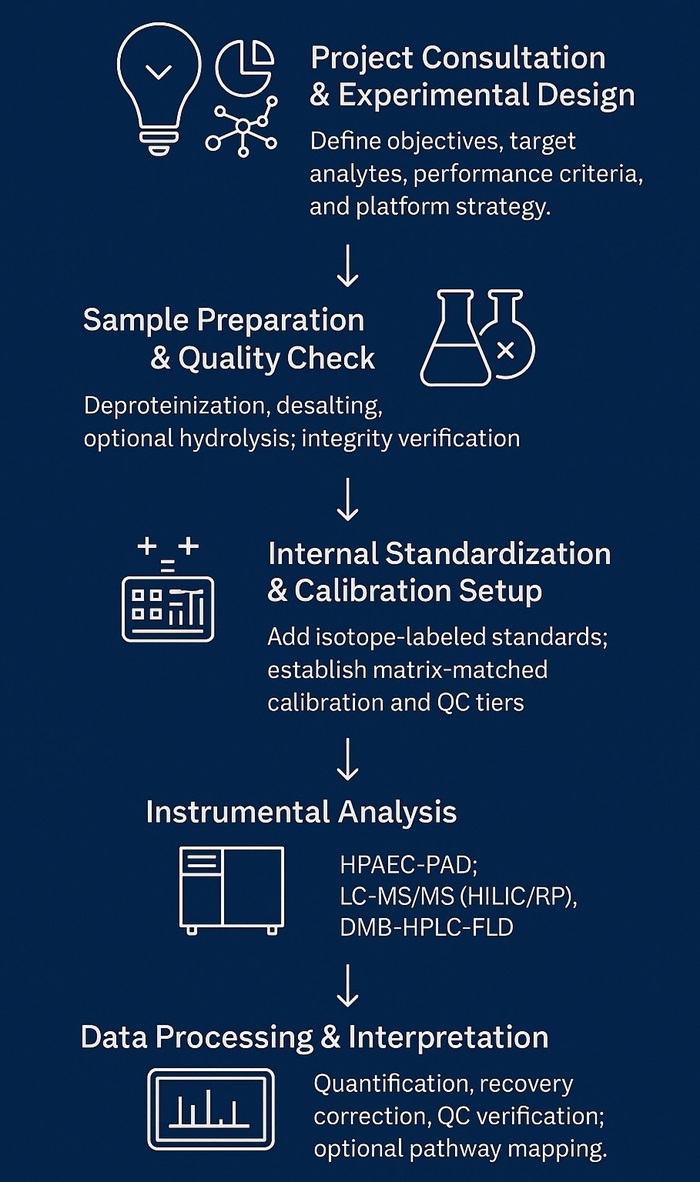
Consultation & Panel Design – Define targets, matrices, required LOD/LOQ, and acceptance criteria.
Sample Preparation – Deproteinization (MeOH/ACN), desalting/SPE; optional enzymatic or acid hydrolysis for polymers and peptidoglycan.
Internal Standardization – Stable-isotope standards where available; matrix-matched calibration and QC tiers (low/mid/high).
Acquisition – Platform selected per analyte: HPAEC-PAD, LC-MS/MS (HILIC/RP), DMB-HPLC-FLD, optional GC-MS.
Data Processing – Isotope-dilution quant, blank subtraction, recovery correction, and carryover checks.
Review & Delivery – Method files, raw data, processed tables, figures, and a concise interpretation memo aligned to your research questions
Technology Platform for Amino Sugars Analysis Service
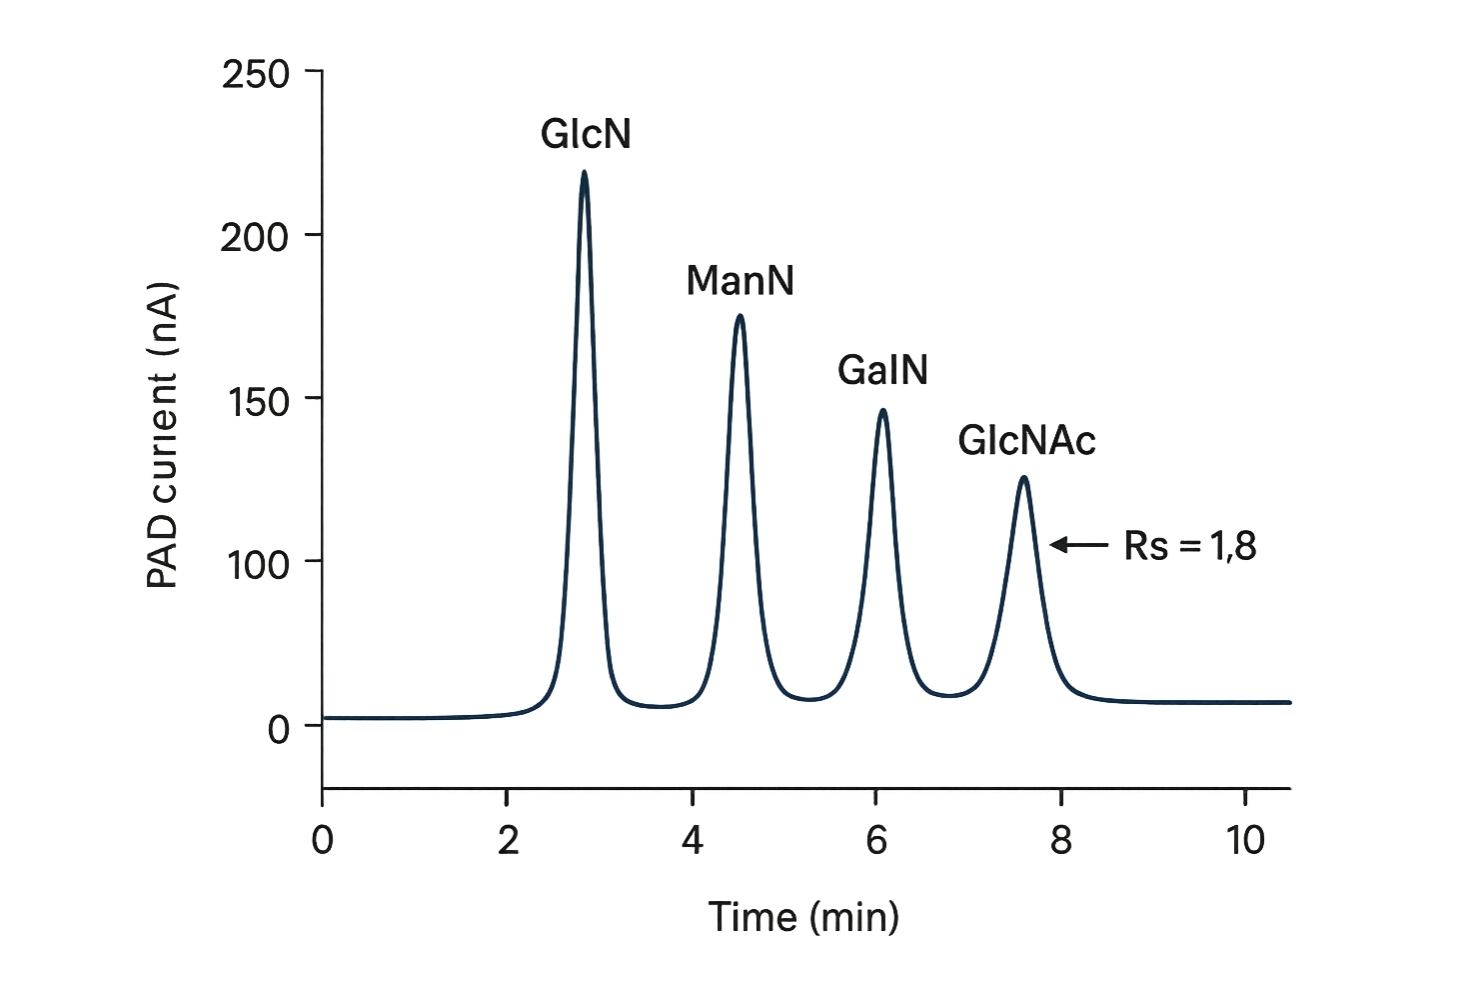
HPAEC-PAD for Free Amino Sugars/HexNAc
- System: Thermo Scientific™ Dionex™ ICS-6000 or ICS-5000+.
- Column: Dionex™ CarboPac™ PA20 (3×150 mm, 6.5 µm) or PA1 (4×250 mm).
- Eluent: Carbonate-free NaOH (2–18 mM) with NaOAc (0–250 mM) gradients; degassed.
- Flow/Temp: 0.4–0.5 mL/min; 30 °C.
- Detection: Pulsed amperometry (triple-potential waveform) with gold electrode; post-column suppressor as required.
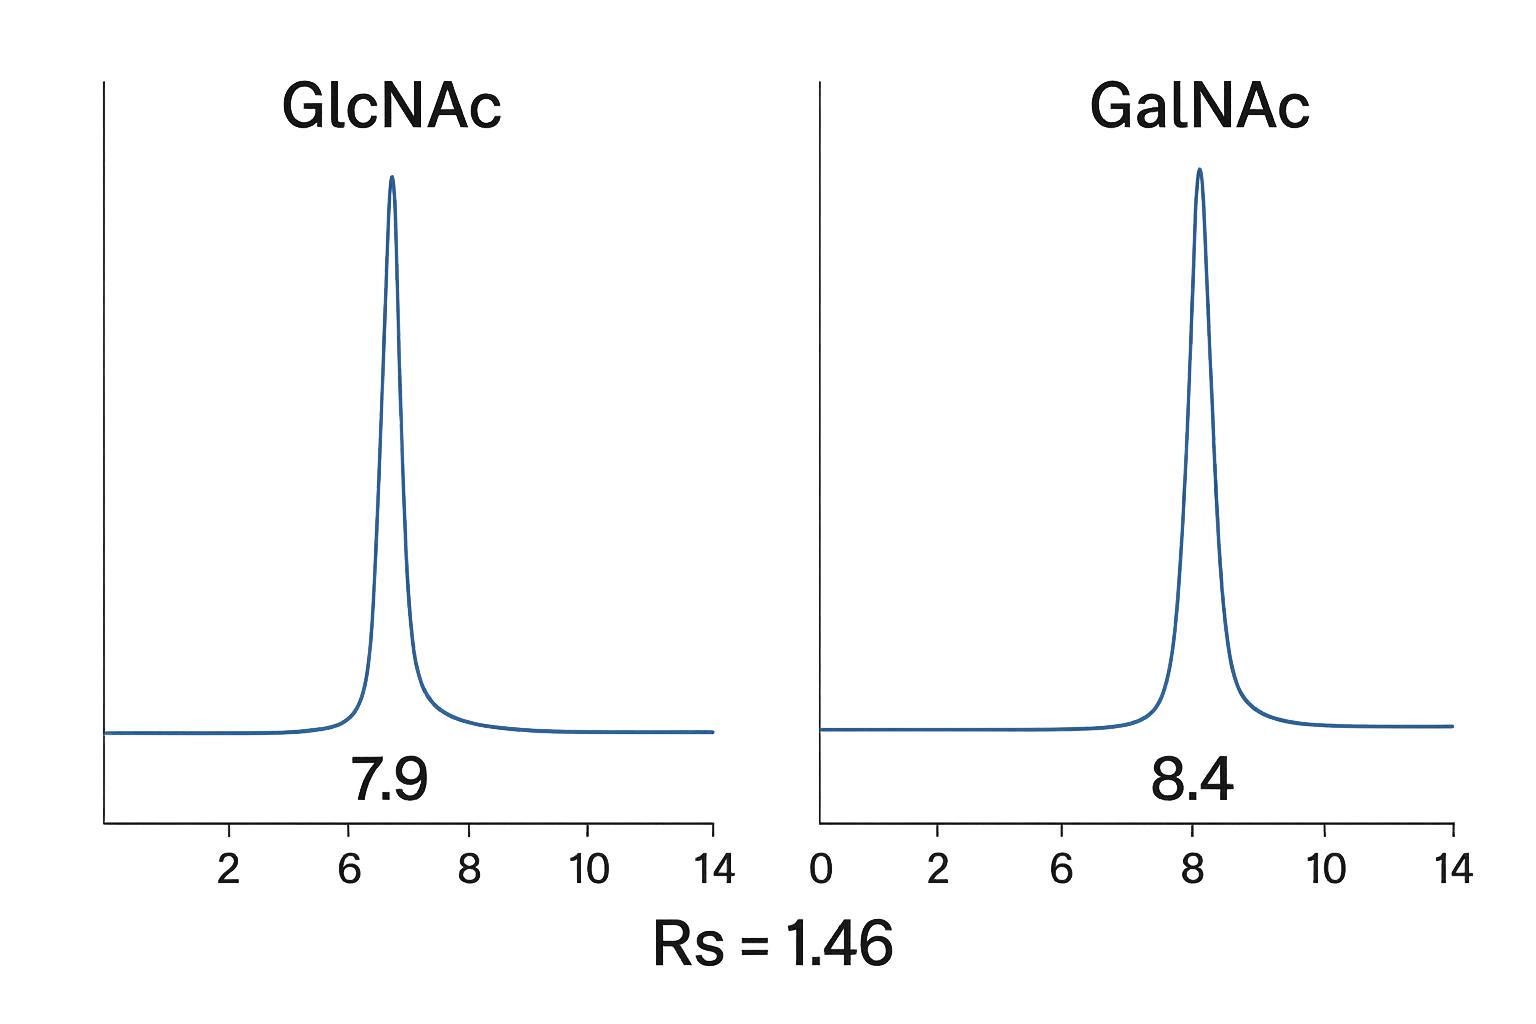
Notes: Excellent baseline resolution for GlcN/GalN/ManN and GlcNAc/GalNAc without derivatization.
 Dionex ICS-6000 or ICS-5000+ (Figure from Thermo Scientific)
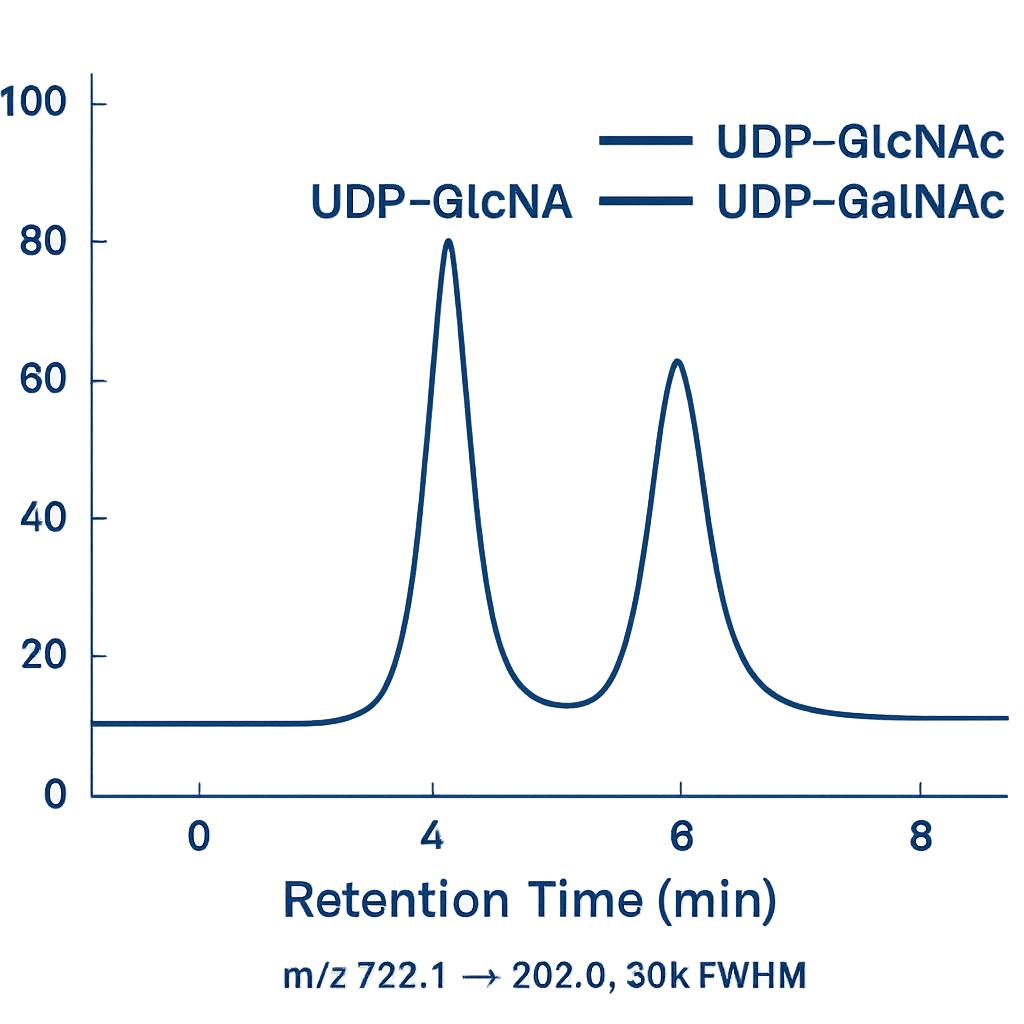
LC-MS/MS (HILIC & RP) for HexNAc, Phosphates, and Nucleotide Sugars
- UHPLC: Thermo Vanquish™ or Waters ACQUITY™ UPLC I-Class.
- MS/MS: Thermo Q Exactive™ Plus/Orbitrap Exploris™ (PRM/full-scan) or SCIEX 6500+/7500 (MRM).
- HILIC Column: Waters BEH Amide 2.1×100 mm, 1.7 µm or SeQuant® ZIC-HILIC 2.1×100 mm, 3.5 µm.
- Mobile Phases: A: 10–50 mM ammonium formate or acetate, pH 3.5–4.5; B: acetonitrile; 70–90% B start with stepwise decrease.
- ESI: Positive mode for HexNAc/nucleotide sugars; negative mode option for phosphates; capillary 3.5–4.0 kV; sheath gas optimized.
- Acquisition: Targeted MRM/PRM with isotope-dilution; resolving power ≥30,000 FWHM (Orbitrap) for isobaric separation.
Notes: Enables simultaneous quantification of UDP-GlcNAc/UDP-GalNAc and free HexNAc with sub-ng/mL sensitivity.
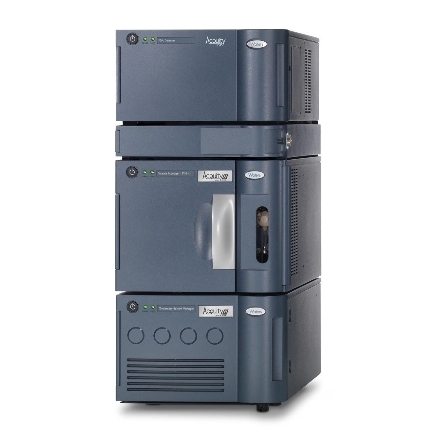 Waters ACQUITY UPLC System (Figure from Waters)
Sialic Acids via DMB Derivatization (HPLC-FLD)
- Chemistry: 1,2-Diamino-4,5-methylenedioxybenzene (DMB) labeling under mild acidic conditions.
- UHPLC: Agilent 1290 Infinity II or Thermo Vanquish.
- Column: RP C18 2.1×100 mm, 1.7–2.6 µm.
- Detection: Fluorescence Ex 373 nm / Em 448 nm; Neu5Ac, Neu5Gc, KDN baseline separation; O-acetyl variants resolvable with adjusted gradients.
- LOD: ≤0.5 ng/mL (matrix-dependent).
 Agilent 1260 Infinity II HPLC (Fig from Agilent)
Sample Requirements for Amino Sugars Analysis Service
| Sample Type | Minimum Amount Required | Handling Instructions |
|---|---|---|
| Cell Lysates / Culture Media | ≥ 200 µL per replicate | Keep on ice immediately after collection; store at −80 °C. Avoid repeated freeze–thaw cycles. |
| Microbial Pellets (Bacteria/Fungi) | ≥ 25–50 mg wet weight | Snap-freeze after collection; ship on dry ice. |
| Plant Tissues (Leaves, Roots) | ≥ 50 mg (fresh or dry) | Freeze in liquid nitrogen; store at −80 °C; avoid moisture contamination. |
| Purified Glycoconjugates / Polysaccharides | ≥ 50–100 µg | Dissolve in water or mild buffer (no strong detergents); store at −20 °C. |
| Food / Feed Extracts | ≥ 200 µL or 50 mg dry powder | Seal properly to avoid moisture uptake; store at −20 °C. |
| Custom Matrices (e.g., Biomaterials) | Contact for assessment | Provide details on composition and solvent compatibility. |
Demo Results
Amino Sugars Analysis Service Case Study

Reevaluation and novel insights into amino sugar and neutral sugar necromass biomarkers in archaea, bacteria, fungi, and plants.
Journal: Science of the Total Environment
Published: 2024
- Background
- Materials & Methods
- Results
- Reference
Soil organic matter (SOM) constitutes the largest reservoir of terrestrial organic carbon (C), primarily influenced by soil microbes, which play a crucial role in its formation and long-term storage. Microbial necromass, comprised mainly of dead microbial biomass, such as cell wall residues and extracellular polymeric substances (EPS), constitutes a significant portion of SOC. This necromass is stabilized through organo-mineral interactions, organic-organic associations, and necromass-necromass interactions. Amino sugars like Glucosamine (GlcN) and Muramic acid (MurA) are prominent biomarkers used to trace microbial necromass in soils due to their specific origins in fungal chitin and bacterial peptidoglycan, respectively. Neutral sugars also serve as potential biomarkers, distinguishing between microbial and plant-derived polysaccharides in soil ecosystems. Despite advancements in biomarker research, there remain gaps in understanding the variability of these biomarkers among different microbial groups and plants, highlighting the need for further investigation and development of new biomarkers and conversion factors.
Standards and Reagents:
Amino sugar and neutral sugar standards (e.g., GlcN, MurA, GalN, Glc, Ara, Xyl) sourced from Sigma-Aldrich were employed. Chemical derivatization utilized 1-phenyl-3-methyl-5-pyrazolone (PMP) to facilitate analysis.
Sample Biomass Preparation:
Biomass from 120 species representing archaea (13), bacteria (23), fungi (56), and plants (28) was analyzed. Microbial biomass underwent freeze-drying, while plant materials were dried at 70°C. Acid hydrolysis with 6 M HCl and subsequent PMP derivatization were conducted as described.
UPLC-Orbitrap MS System:
Analysis was performed using a UPLC Ultimate 3000 system coupled to an Orbitrap Q Exactive HRMS with H-ESI source. Separation was achieved using a Waters AccQ. Tag Ultra C18 column, with data acquisition and processing following established protocols.
Targeted mass-to-charge ratios (m/z) were used for the identification and quantification of amino sugars and neutral sugars. Data analysis utilized FreeStyle™ 1.7 software for spectral processing and compound quantification.
Statistical comparisons among taxonomic groups were conducted using Kruskal-Wallis, Dunn, and Wilcoxon tests to assess differences in sugar content. Spearman correlations examined relationships such as between MurA and GlcN in bacterial groups.
Non-metric multidimensional scaling (NMDS) was employed to visualize clustering patterns based on sugar profiles. Analysis of similarity (ANOSIM) tested for significant group distinctions. Partial least squares discriminant analysis (PLS-DA) identified discriminatory metabolites among taxa.
Indicator Species Analysis:
Biomarkers associated with specific taxa were identified using the multipatt function from the indicspecies package, with multiple permutations ensuring robustness.
Amino Sugar and Neutral Sugar Composition Across Taxa
We conducted comprehensive analyses of amino sugar and neutral sugar contents in biomass samples from archaea, bacteria, fungi, and plants using advanced metabolomic techniques.
Amino Sugar Profiles:
- Glucosamine (GlcN): Predominant in all groups, highest in fungi (45.9 μg/mg dw) and lowest in plants (1.4 μg/mg dw).
- Muramic Acid (MurA): Exclusive to bacteria, significantly higher in gram-positive (24.7 μg/mg dw) than gram-negative bacteria (3.9 μg/mg dw). Positive correlation with GlcN observed in gram-positive bacteria.
- Galactosamine (GalN): Highest in archaea (15.2 μg/mg dw), lower in bacteria, fungi, and plants (1.1-4.0 μg/mg dw).
- Talosaminuronic Acid (TalA): Found only in Euryarchaeota (6.4 μg/mg dw).
Neutral Sugar Profiles:
- Hexoses (Glucose, Galactose, Mannose): Predominant neutral sugars, with higher content in fungi and plants compared to bacteria and archaea.
Biomarker Significance and Taxonomic Differentiation
NMDS Ordination:
Amino sugar biomarkers distinguish gram-positive and gram-negative bacteria from archaea, fungi, and plants. MurA content is pivotal for bacterial separation.
 Fig. 2. Non-metric multidimensional scaling (NMDS) analysis based on amino sugar contents. Ellipses represent 95% confidence intervals.
PLS-DA Discrimination:
Discriminant analysis reveals distinct metabolic profiles among bacteria, fungi, and plants based on amino and neutral sugar contents. GlcN, MurA, Glc, and Gal are key discriminatory markers.
 Fig. 3. Partial least squares discriminant analysis (PLS-DA) score plot based on amino sugar and neutral sugar contents.
Indicator Species Analysis:
Specific biomarkers like GlcN for archaea, bacteria, and fungi, MurA for bacteria, and Glc and Gal for fungi and plants indicate taxon associations.
Implications for Ecological Roles and Conversion Factors
Conversion Factors:
Estimated factors convert sugar biomarkers into microbial necromass C, highlighting significant variations across taxa.
These findings underscore the metabolic diversity and ecological implications of sugar biomarkers in delineating taxonomic distinctions and ecological roles within soil microbial communities and plant interactions.
Reference
- Salas, Erika, et al. "Reevaluation and novel insights into amino sugar and neutral sugar necromass biomarkers in archaea, bacteria, fungi, and plants." Science of the Total Environment 906 (2024): 167463.
FAQ of Amino Sugars Analysis Service
Can your platform distinguish between structural isomers like GlcNAc and GalNAc?
Yes. We employ HPAEC-PAD and HILIC-LC-MS/MS, which provide baseline resolution of GlcNAc, GalNAc, and ManNAc. These methods are optimized with reference standards and retention time matching.
ow do you ensure accurate quantification of nucleotide sugars and labile intermediates?
We use isotope-dilution strategies whenever possible, coupled with matrix-matched calibration and stable temperature conditions during analysis. This minimizes ion suppression and degradation of sensitive species like CMP-Neu5Ac.
Are your workflows compatible with highly viscous or protein-rich samples such as fermentation broth?
Yes. Our pre-analytical protocols include deproteinization and desalting steps. We can also adapt SPE-based cleanup or ultrafiltration for challenging matrices to ensure high recovery and minimal matrix effect.
Can you detect modified sialic acids, such as O-acetylated or di-acetylated derivatives?
Yes. Our DMB-derivatization method combined with LC-MS/MS can profile Neu5,7Ac₂, Neu5,9Ac₂, and other rare O-acetyl variants. We also offer customization for detection of KDN derivatives.
Is it possible to integrate amino sugar analysis with glycomics or metabolomics workflows?
Absolutely. We offer amino sugar profiling as a standalone service or as part of integrated glycomics, glycoproteomics, and targeted metabolomics solutions. This enables correlation between amino sugar flux, glycan structures, and metabolic pathways.
How do you handle samples that contain polysaccharides like chitin or hyaluronan?
We apply controlled acid or enzymatic hydrolysis to depolymerize these materials into their monomeric units (e.g., GlcNAc), ensuring accurate quantification without significant degradation.
What detection limits can you achieve for amino sugars and sialic acids?
Typical LODs: 1–5 ng/mL for free amino sugars (HPAEC-PAD), ≤0.5 ng/mL for DMB-labeled sialic acids, and ≤2 ng/mL for nucleotide sugars by LC-MS/MS, depending on matrix complexity.
Can you accommodate custom method development for uncommon or rare amino sugars?
Yes. We provide fit-for-purpose method development, including selection of appropriate derivatization chemistry, isotope-labeled standards, and validation parameters tailored to your research needs.
Learn about other Q&A about proteomics technology.
Publications
Here are some of the metabolomics-related papers published by our clients:

- Comparative metabolite profiling of salt sensitive Oryza sativa and the halophytic wild rice Oryza coarctata under salt stress. 2024. https://doi.org/10.1002/pei3.10155
- The Brain Metabolome Is Modified by Obesity in a Sex-Dependent Manner. 2024. https://doi.org/10.3390/ijms25063475
- Regulation of host metabolism and defense strategies to survive neonatal infection. 2024. https://doi.org/10.1016/j.bbadis.2024.167482
- White matter lipid alterations during aging in the rhesus monkey brain. 2024. https://doi.org/10.1007/s11357-024-01353-3
- Multiomics of a rice population identifies genes and genomic regions that bestow low glycemic index and high protein content. 2024. https://doi.org/10.1073/pnas.2410598121
