Adenosine Monophosphate (AMP) Analysis Service
Creative Proteomics offers high-sensitivity adenosine monophosphate (AMP) analysis using advanced LC-MS/MS technology to support research in energy metabolism, AMPK signaling, and purine pathway profiling.
We help you:
- Accurately quantify AMP and related nucleotides (e.g., ATP, ADP) across a wide range of biological samples
- Investigate metabolic imbalances and shifts in energy status under disease or stress conditions
- Assess drug-induced effects on nucleotide pools and AMPK pathway activation
- Identify potential biomarkers linked to metabolic disorders, inflammation, or cellular stress
Advance your biomedical, pharmaceutical, or systems biology research with robust, quantitative metabolite data.
Submit Your Request Now
×
What You Will Receive
- Absolute AMP & AMP/ATP/ADP quant data
- 20 related metabolites included
- LC-MS/MS-based MRM reports
- Method validation & QC metrics
- Custom pathway heatmaps (optional)
- What We Provide
- Advantages
- Technology Platform
- Sample Requirements
- Demo
- FAQs
- Case Study
What Is Adenosine Monophosphate?
Adenosine monophosphate (AMP) is a central metabolite in the purine nucleotide cycle and an essential indicator of cellular energy status. As a key intermediary in ATP degradation and an allosteric regulator of AMP-activated protein kinase (AMPK), AMP influences numerous physiological processes—from glycolysis and mitochondrial respiration to cell signaling, lipid metabolism, and immune response.
Understanding AMP dynamics and its interplay with related metabolites is indispensable in fields such as metabolic disease research, cancer biology, neurodegeneration, pharmacodynamics, and functional food development.
Why Quantitative AMP Analysis Matters
AMP serves as a vital molecular signal for intracellular energy balance. Fluctuations in AMP levels, particularly the AMP/ATP ratio, directly activate AMPK—a master regulator of catabolic and anabolic metabolism. Dysregulation of this pathway is implicated in various conditions, including:
- Type 2 diabetes and insulin resistance
- Cardiovascular dysfunction
- Inflammatory and autoimmune diseases
- Neurodegenerative disorders
- Cancer cell metabolism and drug response
Therefore, targeted AMP analysis provides critical insights for:
- Energy metabolism profiling
- Drug efficacy assessment
- Metabolomics-based biomarker discovery
- Nutraceutical research and functional ingredient validation
- Toxicological impact evaluations in preclinical studies
AMP Analysis Service Offered by Creative Proteomics
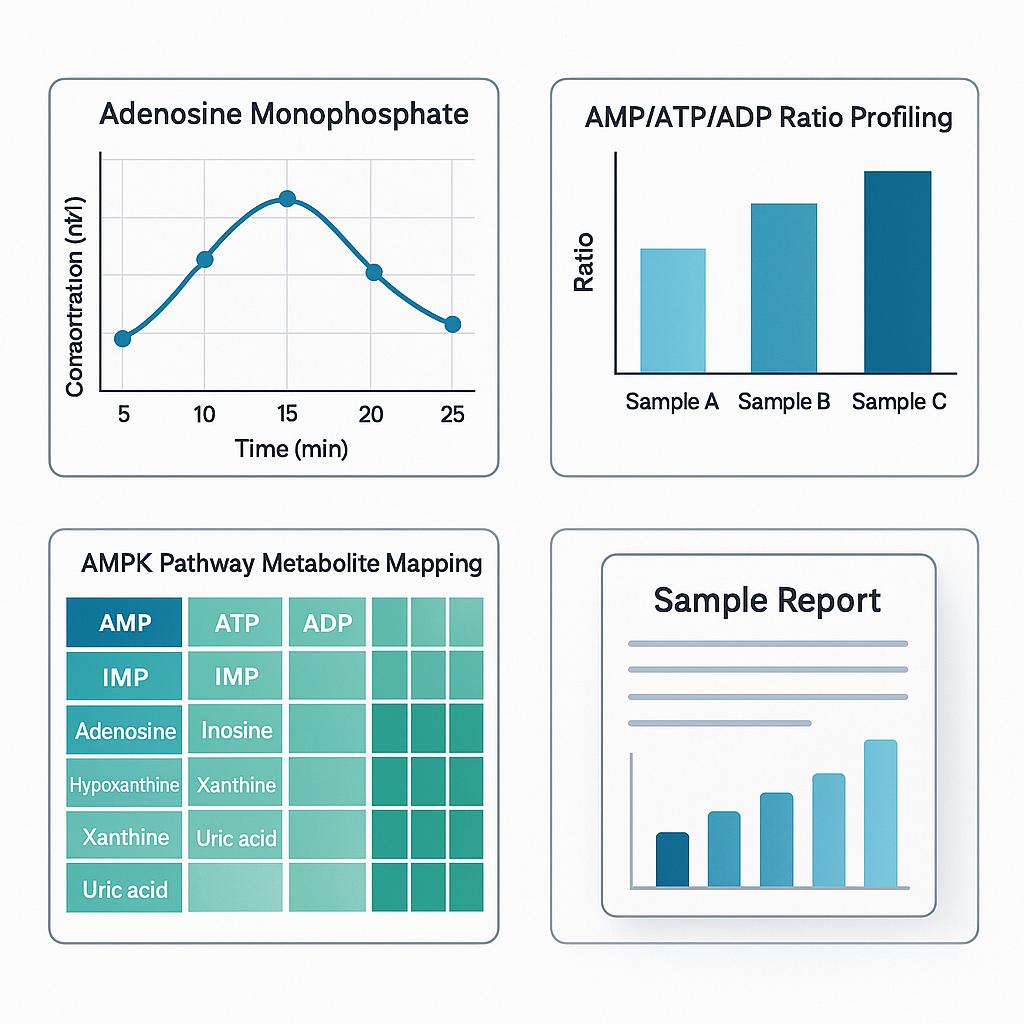
- Absolute Quantification of AMP: Using isotope-labeled internal standards and LC-MS/MS, we provide accurate concentration data across biological matrices such as plasma, serum, cerebrospinal fluid, tissue lysates, urine, and cell extracts.
- AMP/ATP/ADP Ratio Profiling: A critical readout for evaluating mitochondrial health, metabolic flux, and pharmacological activation of AMPK.
- AMPK Pathway Metabolite Mapping: Simultaneous detection of upstream and downstream molecules involved in nucleotide salvage, glycolysis, β-oxidation, and TCA cycle integration.
- Time-course and Stress Response Studies: Designed for evaluating AMP fluctuation under nutrient stress, drug treatment, or hypoxia models in vitro or in vivo.
- Customizable Analysis Panels: Tailored metabolite sets based on your experimental focus (e.g., purine metabolism, nucleotide turnover, AMPK activation).
List of Detected AMP and Related Metabolites
| Metabolite | Pathway Association | Biological Role |
|---|---|---|
| AMP (Adenosine monophosphate) | Purine metabolism, AMPK pathway | Energy sensor, signaling molecule |
| ATP (Adenosine triphosphate) | Energy metabolism, oxidative phosphorylation | Cellular energy currency |
| ADP (Adenosine diphosphate) | Mitochondrial respiration, glycolysis | Intermediary in ATP regeneration |
| IMP (Inosine monophosphate) | Purine salvage pathway, nucleotide biosynthesis | Precursor to AMP and GMP |
| Adenosine | Adenosine signaling, vasodilation | Neurotransmission, anti-inflammatory role |
| Inosine | Purine metabolism, hypoxia response | Neuroprotection, immune modulation |
| Hypoxanthine | Purine degradation | Oxidative stress marker |
| Xanthine | Uric acid cycle | Precursor to uric acid |
| Uric acid | Antioxidant, inflammation marker | End product of purine catabolism |
| GMP / GDP / GTP | Guanine metabolism | Parallel purine nucleotide pathway |
| Nicotinamide adenine dinucleotide (NAD⁺/NADH) | Redox metabolism | Links nucleotide and energy metabolism |
| Phosphocreatine / Creatine | Energy buffering system | Supports ATP regeneration in muscle and brain |
Custom pathway panels can be added upon request to include metabolites from:
- TCA Cycle
- β-Oxidation
- Nucleotide salvage pathways
- Pentose phosphate pathway
Advantages of AMP Assay
- Quantification CV <5%: High reproducibility across replicates with isotope-labeled internal standards.
- LOD as low as 1 nM: Ultra-sensitive LC-MS/MS detection suitable for low-biomass or CSF samples.
- AMP/ATP/ADP ratio with <10% error: Reliable energy profiling in serum, liver, and cell lysates.
- Compatible with 10+ sample types: Validated for plasma, tissues, urine, CSF, and cell-based matrices.
- 20+ related metabolites covered: Broad profiling of purine metabolism and AMPK-linked pathways.
Workflow for AMP Analysis Service
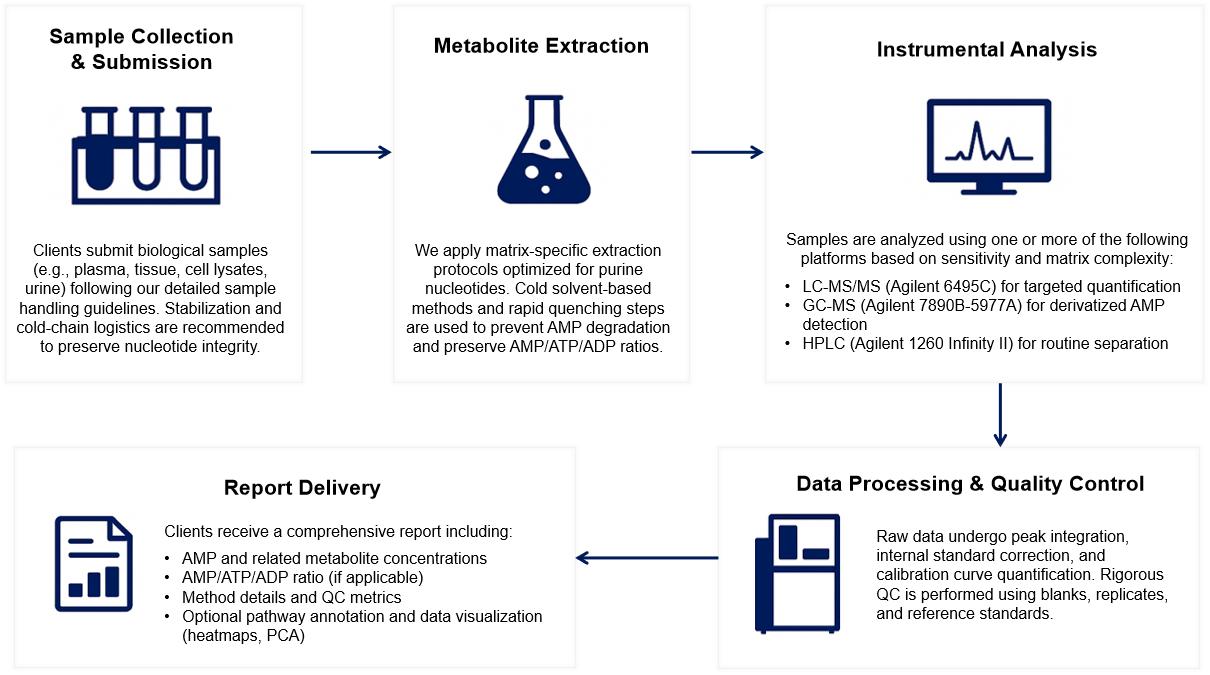
Methods and Instrumentation for AMP Analysis
Agilent 6495C Triple Quadrupole LC-MS/MS
- Application: Targeted quantification of AMP and related nucleotides
- Strengths: High sensitivity (MRM mode), ideal for low-abundance metabolites in plasma, tissue, or CSF
- Best For: AMP/ATP/ADP ratio analysis, AMPK pathway studies
Agilent 7890B-5977A GC-MS
- Application: Volatile AMP derivatives via derivatization
- Strengths: High-resolution separation, stable performance for metabolic flux studies
- Best For: Plant samples, environmental metabolomics, specific bioenergetics research
Agilent 1260 Infinity II HPLC
- Application: Routine AMP separation and detection
- Strengths: Cost-effective, compatible with UV or fluorescence detection
- Best For: Fermentation samples, purified extracts, high-throughput workflows
Agilent 6495C Triple Quadrupole (Figure from Agilent)
Agilent 7890B-5977A (Figure from Agilent)
Agilent 1260 Infinity II HPLC (Fig from Agilent)
Sample Requirements for AMP Analysis Service
| Sample Type | Minimum Amount | Storage | Shipping | Notes |
|---|---|---|---|---|
| Plasma / Serum | ≥ 100 μL | -80 °C | Dry ice, overnight | Use EDTA/heparin tubes; avoid hemolysis |
| Tissue | ≥ 50 mg (wet weight) | -80 °C | Dry ice | Snap-freeze immediately after dissection |
| Cell Pellets | ≥ 1×10⁶ cells or 50 μg protein | -80 °C | Dry ice | Wash with cold PBS before freezing |
| Urine | ≥ 200 μL | -80 °C | Dry ice | Midstream preferred; no preservatives |
| CSF | ≥ 50 μL | -80 °C | Dry ice | Collect with care; avoid contamination |
| Culture Media | ≥ 500 μL | -80 °C | Dry ice | Collect after defined incubation period |
Demo Results

Representative LC-MS/MS chromatogram showing AMP and internal standard (IS) peaks in plasma.

Calibration curve of AMP quantification showing excellent linearity (R² = 0.9984) across 0–800 ng/mL.

Heatmap of AMP pathway metabolites under control and stress conditions.

AMP/ATP ratio significantly increases after drug exposure compared to control.

Box plot showing high technical repeatability of AMP detection (CV < 5%).
FAQ of AMP Analysis Service
Can AMP be measured alongside other nucleotides or metabolites in a single run?
Yes. We offer multi-target panels that quantify AMP together with ATP, ADP, IMP, and related purine metabolites in a single LC-MS/MS run. This saves time and ensures consistent data across analytes.
How should I normalize AMP levels across different sample types?
We recommend total protein quantification for tissue or cell samples and volume-based normalization for biofluids. We can assist with protein concentration measurement upon request.
Are there specific pre-treatment steps I need to perform before sample submission?
No pre-treatment is needed. Simply snap-freeze the sample immediately after collection. Avoid adding buffers or stabilizers unless specifically instructed.
Can Creative Proteomics help interpret AMP fluctuations in response to drug treatment or stress models?
Yes. Our bioinformatics team can assist in interpreting AMP/ATP ratio shifts, identifying pathway-level changes, and integrating results with other omics data if available.
Is it possible to perform time-course or dose-response AMP profiling?
Absolutely. We support custom experimental designs, including kinetic studies, with batch-consistent processing and aligned analytical parameters.
Do you offer method transfer or on-site assay development for AMP quantification?
For CRO/biotech clients requiring in-house implementation, we offer method transfer support, including SOP documentation and remote consulting for LC-MS platforms.
Learn about other Q&A.
AMP Analysis Service Case Study

Title: PAP content in wild-type C24 and fry1 seedlings treated with either salt, ABA, or cold.
Journal: PLOS ONE
Published: 2011
- Background
- Methods
- Results
- Reference
Abiotic stresses such as salinity, drought, and low temperatures can significantly affect plant development and crop yield. Stress-responsive gene regulation is a key adaptive mechanism, but its upstream metabolic controls remain incompletely understood. The Arabidopsis mutant fry1—defective in the bifunctional nucleotidase/phosphatase FRY1/SAL1—exhibits hyperactivation of stress-inducible reporters like RD29A-LUC. While FRY1's inositol polyphosphatase function was previously linked to stress signaling, the physiological role of its nucleotide-related activity, specifically in degrading 3′-phosphoadenosine-5′-phosphate (PAP), was unclear due to technical limitations in measuring PAP in planta.
To investigate the role of PAP accumulation in fry1-related phenotypes, the authors developed a targeted LC-MS/MS method for precise quantification of PAP and related nucleotides (AMP, ADP, ATP) in Arabidopsis.
Key Analytical Highlights:
Sample Preparation:
Fresh tissues were extracted using a −20°C solvent mixture of chloroform, methanol, and acetonitrile with 0.4% formic acid to minimize nucleotide degradation.
Instrument Platform:
LC-MS/MS with triple quadrupole detection (QTRAP 4000), optimized in negative ion mode for PAP.
Ion-pair chromatography with n-hexylamine-modified mobile phases enabled baseline resolution between PAP, ADP, and ATP.
MRM Transitions:
Three transitions (e.g., m/z 426→134 and 426→79) were used to distinguish PAP from isomers with high specificity.
LOD: 4 nM (40 fmol on-column); dynamic range: 4 nM–10 µM (R² = 0.9998)
Validation:
- Consistent AMP/ADP/ATP levels aligned with enzymatic/spectroscopic benchmarks.
- Repeatability: RSD = 15.98% for PAP quantification (n = 3).
- Ion suppression: Negligible, confirmed by matrix-spike recovery.
Creative Proteomics offers similar LC-MS/MS-based nucleotide profiling platforms, optimized for:
- Sub-femtomole quantification of nucleotide intermediates (e.g., PAP, AMP)
- Purine metabolism and stress signaling studies
- Pathway-wide mapping in plant, microbial, and mammalian systems
- Matrix compatibility with plant extracts, plasma, tissues, or culture media
In Vivo PAP Accumulation in fry1
- Wild-type Arabidopsis showed undetectable PAP levels; fry1 mutants accumulated >10 nmol/g FW.
- Salt (NaCl), ABA, and cold treatments did not alter PAP levels significantly in either genotype.
Specificity of FRY1 Activity
Among FRY1 homologs (SAL2–SAL4, AHL), only fry1 and hos2 mutants accumulated PAP, confirming FRY1 as the dominant PAP-hydrolyzing enzyme in planta.
Functional Rescue via Overexpression
Overexpressing truncated FRY1 (cytosolic/nuclear), full-length FRY1 (chloroplastic), SAL2, or yeast MET22 restored wild-type morphology and reduced PAP levels in fry1 mutants. These transgenes also suppressed superinduction of RD29A-LUC under stress.
Suppression of PAP by Precursor Limitation
- Triple mutants (fry1 apk1 apk2) showed >70% reduction in PAP compared to fry1 alone.
- Corresponding normalization of morphology and RD29A-LUC expression further supports PAP's role as a regulatory metabolite.
Genetic Interaction with ABA Signaling Components
abh1 mutation suppressed RD29A-LUC superinduction in fry1, while abi1 did not, implicating PAP in non-canonical ABA signaling pathways.
Salt Tolerance Unaffected by FRY1 Overexpression
Despite full enzymatic activity and restored PAP levels, FRY1-overexpressing plants did not exhibit improved tolerance to NaCl or LiCl, unlike yeast, suggesting plant-specific stress adaptation pathways.
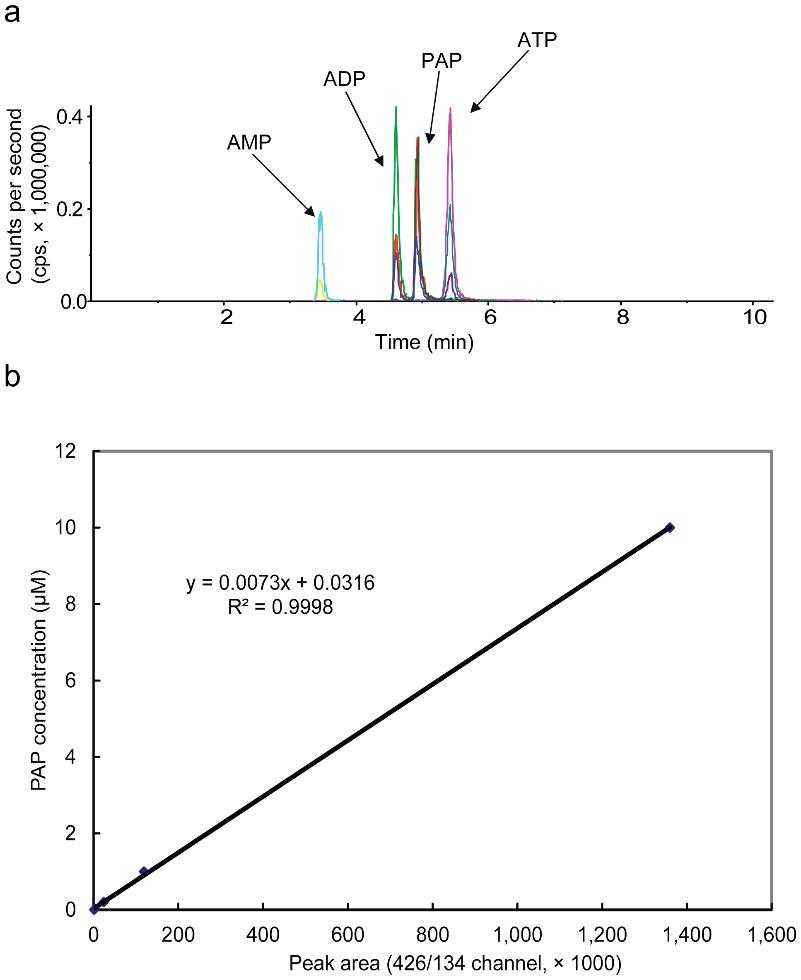 LC-MS/MS analysis of PAP, AMP, ADP, and ATP.
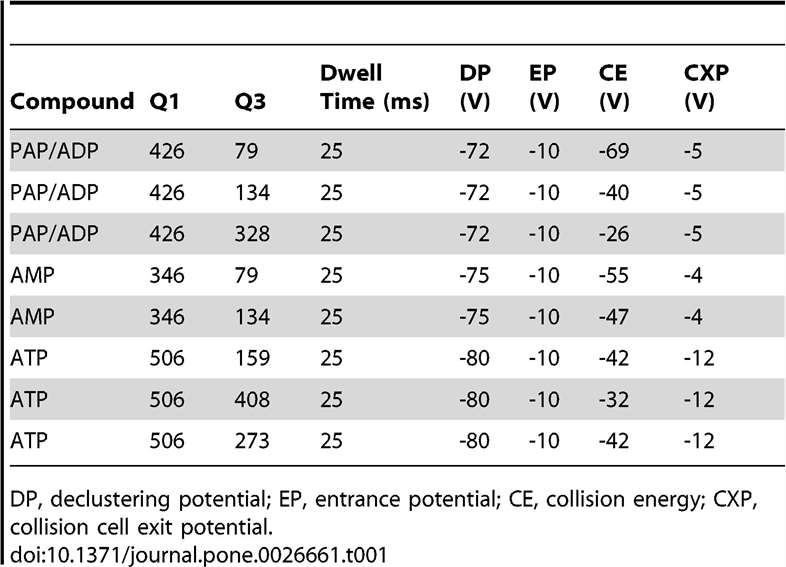 MRM transitions for AMP, ADP, ATP, and PAP.
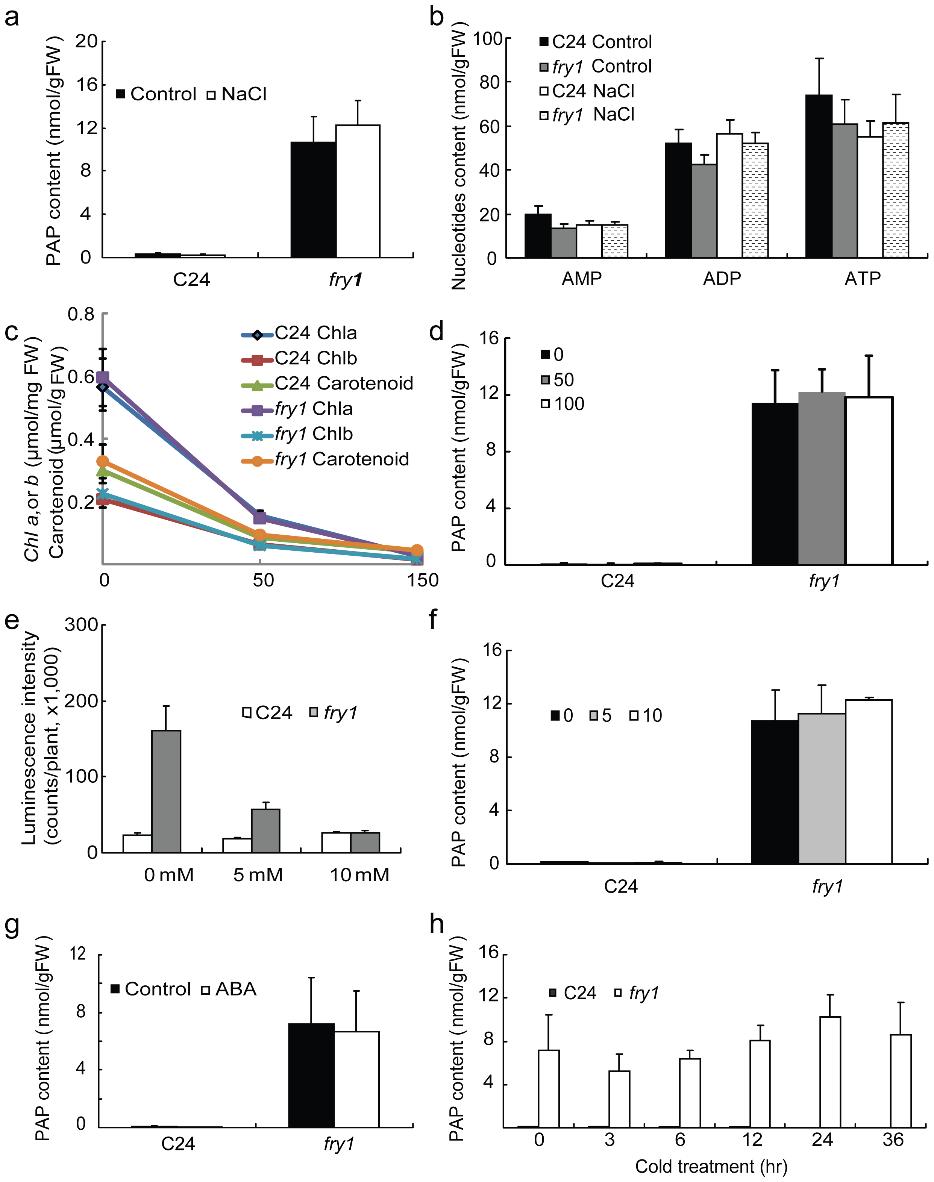 PAP content in wild-type C24 and fry1 seedlings treated with either salt, ABA, or cold.
Reference
- Chen, Hao, et al. "A nucleotide metabolite controls stress-responsive gene expression and plant development." PLoS One 6.10 (2011): e26661. https://doi.org/10.1371/journal.pone.0026661
Publications
Here are some of the metabolomics-related papers published by our clients:

- Methyl donor supplementation reduces phospho‐Tau, Fyn and demethylated protein phosphatase 2A levels and mitigates learning and motor deficits in a mouse model of tauopathy. 2023. https://doi.org/10.1111/nan.12931
- A human iPSC-derived hepatocyte screen identifies compounds that inhibit production of Apolipoprotein B. 2023. https://doi.org/10.1038/s42003-023-04739-9
- The activity of the aryl hydrocarbon receptor in T cells tunes the gut microenvironment to sustain autoimmunity and neuroinflammation. 2023. https://doi.org/10.1371/journal.pbio.3002000
- Lipid droplet-associated lncRNA LIPTER preserves cardiac lipid metabolism. 2023. https://doi.org/10.1038/s41556-023-01162-4
- Inflammation primes the kidney for recovery by activating AZIN1 A-to-I editing. 2023. https://doi.org/10.1101/2023.11.09.566426
- Anti-inflammatory activity of black soldier fly oil associated with modulation of TLR signaling: A metabolomic approach. 2023. https://doi.org/10.3390/ijms241310634
- Plant Growth Promotion, Phytohormone Production and Genomics of the Rhizosphere-Associated Microalga, Micractinium rhizosphaerae sp. 2023. https://doi.org/10.3390/plants12030651