Tartaric Acid Analysis Service
Creative Proteomics offers high-sensitivity tartaric acid analysis using LC-MS/MS, GC-MS, and HPLC platforms to support food science, plant physiology, and metabolic research.
We help you:
- Achieve precise quantification and stereoisomer profiling of tartaric acid (D-, L-, and meso-forms)
- Analyze a wide range of sample types including food products, plant tissues, plasma, and fermentation broths
- Support quality control, authenticity verification, and biochemical investigations
- Deliver reproducible, publication-ready data with validated, high-throughput workflows
Ensure confidence in your results—whether for regulatory compliance, product development, or scientific discovery.
Submit Your Request Now
×
What You Will Receive
- PDF report with quantitative data
- XIC + MS/MS spectrum (on request)
- Raw data (.mzML or .cdf)
- Multiplex metabolite summary
- Custom method notes (if applicable)
- What We Provide
- Advantages
- Technology Platform
- Sample Requirements
- Demo
- FAQs
- Case Study
What Is Tartaric Acid?
Tartaric acid (2,3-dihydroxybutanedioic acid) is a naturally occurring dicarboxylic acid widely distributed in grapes, bananas, and tamarinds. It exists in several stereoisomeric forms, with L-(+)-tartaric acid being the biologically active enantiomer. In industrial and scientific contexts, tartaric acid plays critical roles in food and beverage production (as an acidulant and stabilizer), pharmaceuticals (as a chiral resolving agent), and agriculture (as a chelating component in micronutrient formulations).
Its importance as a metabolic intermediate, quality marker, and environmental indicator in biological, agricultural, and fermentation systems underlines the need for precise, reproducible quantification.
Why Analyze Tartaric Acid?
Quantitative and qualitative analysis of tartaric acid is critical for multiple sectors where organic acid profiling impacts product quality, process optimization, and biochemical pathway elucidation.
- Food & Beverage Industry: Ensure acid balance and sensory attributes in wine and juice.
- Biochemical Research: Trace metabolic flux in microbial or plant fermentation models.
- Agricultural Science: Determine acid distribution in various crop cultivars.
- Industrial Production: Maintain consistency in tartaric acid used for chelating or stabilizing agents.
- Chemical Manufacturing: Monitor purity and stereochemistry in synthetic pathways.
Tartaric Acid Analysis Service Offered by Creative Proteomics
- Absolute Quantification of Tartaric Acid: High-precision quantification using isotope-labeled internal standards and LC-MS/MS technology. Suitable for both low- and high-abundance samples across diverse matrices.
- Stereoisomer Separation and Profiling: Chiral HPLC-based differentiation and quantification of L-(+)-tartaric acid and D-(−)-tartaric acid enantiomers. Ideal for evaluating natural vs. synthetic origins and enantiopurity.
- Multiplex Organic Acid Profiling: Simultaneous detection of tartaric acid with other key acids (e.g., malic, citric, succinic, fumaric) in a single analytical run for integrated metabolic insight.
- Fermentation Process Monitoring: Time-resolved analysis of tartaric acid levels during microbial, yeast, or plant-based fermentation. Enables optimization of yield, acid balance, and microbial performance.
- Plant Stress and Metabolomics Studies: Quantitative tartaric acid profiling in plant tissues under various abiotic stress conditions (e.g., drought, salinity). Can be integrated into untargeted or semi-targeted metabolomics workflows.
- Food and Beverage Quality Authentication: Detection of tartaric acid content and profile in juices, wines, vinegars, and natural products to support label claims, authenticity, and adulteration checks.
- Custom Method Development and Validation: Tailored assay development for novel sample types or regulatory submissions. Includes linearity, sensitivity, repeatability, and inter-day variation validation parameters.
List of Detected Tartaric Acid and Related Metabolites
| Category | Representative Metabolites | Functional Relevance |
|---|---|---|
| Primary Target | L-(+)-Tartaric acid, D-(–)-Tartaric acid | Main analytes; critical for wine acid balance, grape maturity, and fermentation profiling |
| Krebs Cycle Intermediates | Citric acid, Isocitric acid, Succinic acid, Fumaric acid, Malic acid | Reflect mitochondrial respiration and fermentation progression |
| Shikimate Pathway | Shikimic acid, Quinic acid, Gallic acid | Linked to plant defense, phenolic biosynthesis, and fruit flavor |
| Sugar Acids & Alcohols | Gluconic acid, Glucuronic acid, Glyceric acid, Glycerol, Xylitol | Markers of microbial activity, sugar metabolism, spoilage indicators |
| Amino Acid Derivatives | Proline, Glutamic acid, Aspartic acid, γ-Aminobutyric acid (GABA) | Tied to nitrogen metabolism and stress response |
| Wine-Specific Acids | Lactic acid, Acetic acid, Pyruvic acid, Galacturonic acid | Key for wine type classification (MLF, spoilage, varietal differences) |
| Phenolic Precursors | Caffeic acid, p-Coumaric acid, Ferulic acid, Vanillic acid | Often co-analyzed with tartaric acid in flavor/aroma fingerprinting |
| Alcohol Fermentation Markers | Ethanol, Methanol, Higher alcohols (e.g., Isoamyl alcohol, Propanol) | Useful for fermentation tracking and contaminant screening |
| Grape-Specific Markers | Tartaric acid, Malic acid, Glucose, Fructose, Sucrose | Define varietal profiles and ripening stages |
| Exogenous Contaminants (Optional) | Sorbic acid, Benzoic acid, Ascorbic acid, Triethyl citrate | Food preservatives or additives sometimes detected in commercial samples |
Advantages of Tartaric Acid Assay
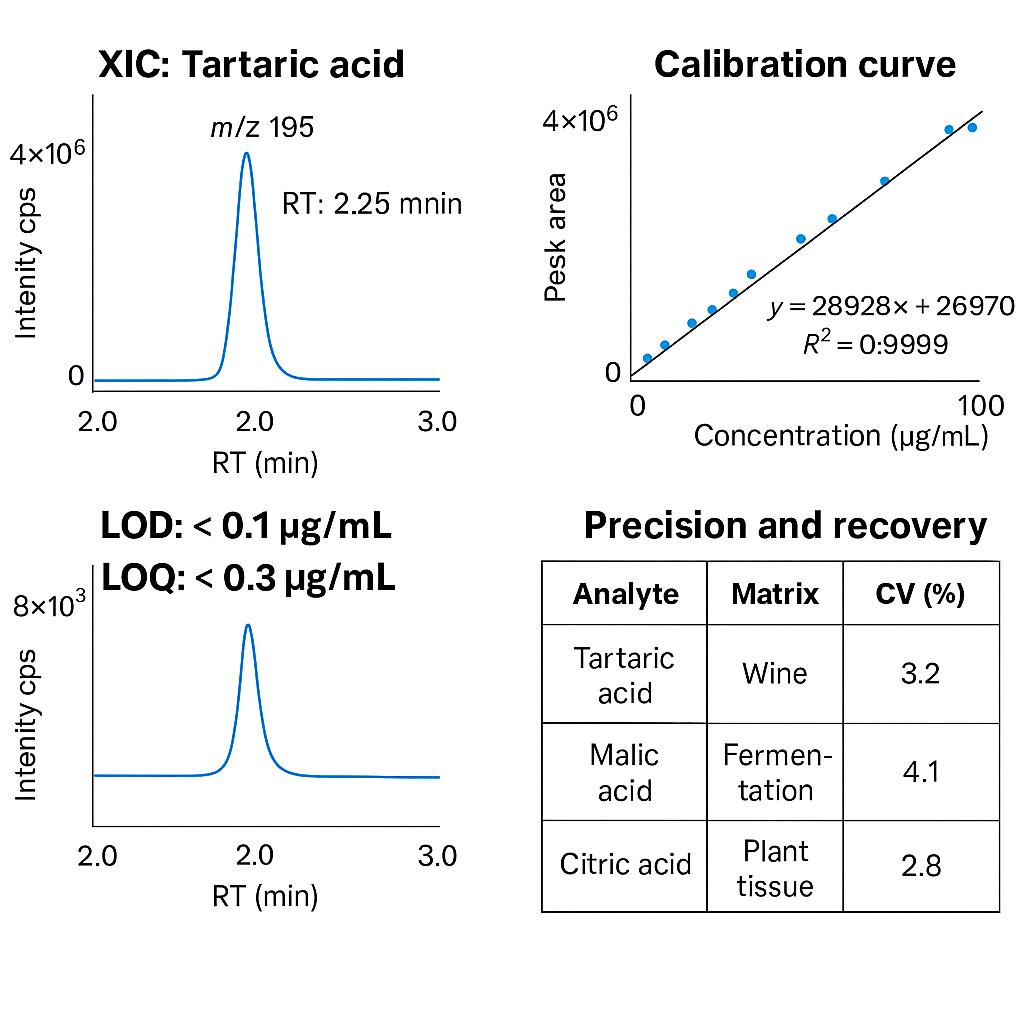
- Ultra-Low Detection Limit: LOD as low as 0.1 µg/mL using LC-MS/MS with isotope-labeled standards
- High Quantitative Precision: Reproducibility ensured with<5% CV across technical replicates
- Enantiomer Separation Capability:Chiral HPLC resolves L- and D-tartaric acid with >98% baseline separation
- Comprehensive Acid Profiling: Simultaneous detection of 20+ organic acids including malic, citric, and succinic acid
- Matrix Versatility: Validated across plasma, plant tissue, wine, fermentation broth, and more
- Wide Dynamic Range: Quantification range spans 5–6 orders of magnitude, suitable for trace to abundant levels
- Accurate and Linear Results: Method linearity R² > 0.995, recovery rates within 90–110%
- Tandem MS/MS Identification: MS/MS fragmentation confirms compound structure with high specificity
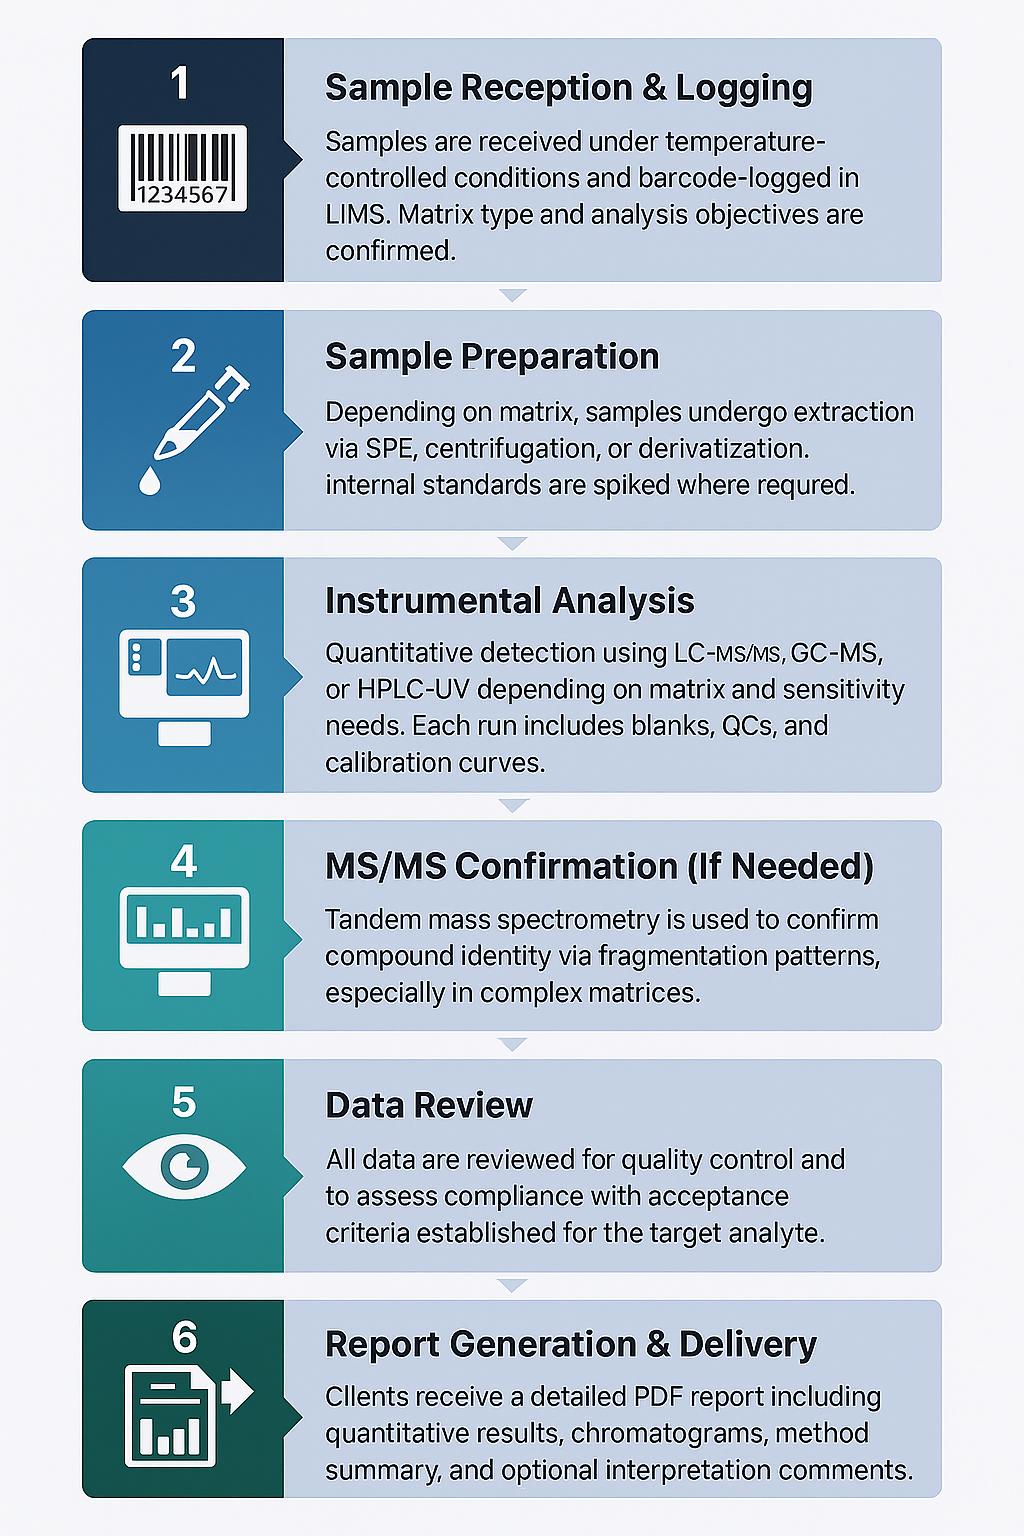
Workflow for Tartaric Acid Analysis Service
Technology Platform for Tartaric Acid Analysis Service
LC-MS/MS
Best for: High-sensitivity quantification in complex biological samples
| Parameter | Specification |
|---|---|
| Platform | Agilent 6495C Triple Quadrupole LC-MS/MS |
| Technique | Targeted Multiple Reaction Monitoring (MRM) |
| Sensitivity | LOD < 0.1 µg/mL |
| Matrices | Plasma, plant tissue, microbial broth |
| Calibration | Internal standard (e.g., ¹³C₄-tartaric acid) |
| Throughput | High—suitable for multi-sample analysis |
 Agilent 6495C Triple Quadrupole (Figure from Agilent)
GC-MS
Best for: Food and beverage analysis with derivatization
| Parameter | Specification |
|---|---|
| Platform | Agilent 7890B + 5977A MSD |
| Technique | GC-MS after silylation derivatization |
| Target Compounds | Tartaric acid, volatile and semi-volatile acids |
| Use Case | Wine profiling, juice authentication |
| Additional Capability | Confirmation via MS spectra of derivatives |
 Agilent 7890B-5977A (Figure from Agilent)
HPLC-UV
Best for: Routine monitoring and cost-effective workflows
| Parameter | Specification |
|---|---|
| Platform | Agilent 1260 Infinity II HPLC |
| Detection | UV absorbance (210–220 nm) |
| Separation Time | <15 min for tartaric/malic/citric acids |
| Matrix Compatibility | Wine, juice, fermentation media |
| Use Case | Quality control, fermentation tracking |
 Agilent 1260 Infinity II HPLC (Fig from Agilent)
Sample Requirements for Tartaric Acid Analysis Service
| Sample Type | Minimum Volume/Weight | Storage Condition | Notes |
|---|---|---|---|
| Fruit Juice / Wine | ≥ 1.0 mL | 4°C (short-term), -20°C (long-term) | Filtered; avoid preservatives if possible |
| Fermentation Broth | ≥ 0.5 mL | -20°C | Centrifuge to remove cells/debris; provide fermentation stage info |
| Plant Tissue (Fresh) | ≥ 100 mg | Flash-frozen at -80°C | Indicate species, part (e.g., leaf, fruit), and growth condition |
| Plant Tissue (Dry) | ≥ 50 mg | Room temp (sealed, dry) | Grind to fine powder recommended |
| Plasma / Serum | ≥ 200 µL | -80°C | EDTA preferred; avoid hemolysis |
| Food Product (Solid) | ≥ 2.0 g | 4°C or -20°C | Homogenized sample preferred; indicate composition |
| Standard Solution | ≥ 0.5 mL (optional) | 4°C | If customer-prepared standards are supplied |
Demo Results

Representative LC-MS/MS results for tartaric acid quantification, including XIC, calibration curve, LOD/LOQ evaluation, and method precision data across sample matrices.

Tartaric acid MS/MS spectrum showing characteristic fragment ions at m/z 195, 113, and 86.

Overlaid chromatograms of tartaric acid in standard, wine, and serum matrices showing consistent retention time.

Tartaric acid recovery at LLOQ and low concentration levels (n = 5), demonstrating >95% accuracy.
FAQ of Tartaric Acid Analysis Service
Can I submit both fresh and dried plant tissue for tartaric acid analysis?
Yes. We accept both forms. For fresh samples, we recommend immediate flash-freezing and -80°C storage. For dried samples, store in sealed containers at room temperature. Please indicate sample preparation method when submitting.
How should I handle fermentation samples that contain yeast or bacteria?
Please centrifuge to remove biomass before submission. If not feasible, inform us in advance so we can apply additional cleanup during sample preparation to prevent matrix interference.
Can I send samples preserved with acid or ethanol?
We prefer unpreserved samples to avoid ion suppression during LC-MS/MS. If acidified, please specify the preservative used. Ethanol is acceptable but should be noted on the submission form.
Do you provide reference standards or internal standards for validation?
Yes. We use isotopically labeled tartaric acid as internal standard for quantitative calibration. You do not need to provide standards unless custom comparison is required.
Can I combine tartaric acid analysis with other organic acids in the same run?
Absolutely. Our method allows multiplex detection of up to 20+ organic acids including malic, citric, succinic, and lactic acid. Please indicate if multi-acid profiling is desired.
What is the minimum sample number for batch submission?
There is no strict minimum, but pricing may be more cost-effective when submitting 5 or more samples per batch. For high-throughput studies, bulk packages are available.
Can I get raw data along with the report?
Yes. We can provide raw chromatographic files (e.g., .mzML or .cdf) upon request, along with peak tables and QA/QC documentation.
How stable is tartaric acid during shipping?
Tartaric acid is relatively stable under cold chain transport. For optimal results, ship samples on dry ice or with cold packs. Avoid repeated freeze-thaw cycles.
Can this method distinguish between synthetic and natural tartaric acid?
Yes, if enantiomeric analysis is requested. We can separate and quantify L-(+)- and D-(–)-tartaric acid via chiral HPLC.
Learn about other Q&A.
Tartaric Acid Analysis Service Case Study
Title: Revealing Individual Lifestyles through Mass Spectrometry Imaging of Chemical Compounds in Fingerprints
Journal: Scientific Reports
Published: 2018
- Background
- Methods
- Results
- Reference
Fingerprints are not only unique identifiers based on ridge patterns, but also rich in chemical residues that reflect an individual's interactions with external substances. Traditional forensic fingerprint analysis has largely focused on pattern recognition. However, advances in mass spectrometry imaging (MSI)—particularly MALDI-MSI (Matrix-Assisted Laser Desorption/Ionization Mass Spectrometry Imaging)—allow researchers to visualize both the spatial distribution and molecular identity of chemical compounds present in fingerprints. These exogenous compounds, including personal care products, food oils, and alcohols, may serve as biochemical clues to a person's lifestyle, environment, or recent activities.
The study utilized multiplex MALDI-MSI to simultaneously obtain high-resolution mass spectrometry (HRMS) data and tandem mass spectrometry (MS/MS) spectra from single fingerprints. The analytical workflow included:
- Sample Preparation: Fingerprints were collected on glass slides after deliberate exposure to products such as bug sprays, sunscreens, food oils, citrus fruits, and alcoholic beverages.
- Matrix Application: Matrices tested included traditional organic matrices (CHCA, DHB) and metal nanoparticles (gold, silver). Silver sputtering proved most effective for ionizing a broad range of hydrophobic exogenous compounds.
- MSI Acquisition: Conducted using a MALDI-LTQ Orbitrap Discovery mass spectrometer, operated in both positive and negative ion modes. Multiplex imaging mode allowed simultaneous ridge detail capture and chemical fragmentation.
- Data Analysis: MS images were processed using Thermo's ImageQuest and QualBrowser. Principal Component Analysis (PCA) via MetaboAnalyst was used for brand/source differentiation.
Creative Proteomics provides advanced MALDI-MSI services, enabling:
- Visualization of exogenous and endogenous compounds in biological traces
- Identification of trace chemical signatures in forensic and biomonitoring studies
- Targeted and untargeted metabolomics mapping in complex tissue or surface samples
- Custom compound confirmation using MS/MS and database matching
Our platform supports simultaneous acquisition of spatial and molecular data for complex surface chemistries—including cosmetics, contaminants, and lifestyle biomarkers.
Matrix Performance: Silver nanoparticles yielded superior ionization for a wide range of sunscreen, food oil, and citrus-derived compounds, particularly in forming stable [M+Ag]+ adducts for hydrophobic analytes.
Bug Spray & Sunscreen Differentiation: Each brand was chemically distinguishable by its unique active ingredients (e.g., DEET, IR3535, oxybenzone). PCA confirmed brand separation based on chemical signatures.
Food Oil Profiling: Different cooking oils left distinct triglyceride (TG) profiles in fingerprints. For example, TG 54:3 was dominant in olive and canola oil, while TG 54:6 was most abundant in grapeseed oil. These profiles clearly differed from endogenous TGs in human fingerprints.
Alcohol and Citrus Markers: Compounds like tartaric acid, malic acid, and citric acid from wine and citrus fruits were readily detectable. Their relative intensities and presence of supporting markers (e.g., naringenin, hesperetin) allowed differentiation among fruit types and wine contamination.
Mock Fingerprint Imaging: Overlapping fingerprints contaminated with different substances were successfully resolved using chemical-specific imaging. This demonstrated the real-world potential of multiplex MALDI-MSI in forensic applications.
Multiplex MS/MS Advantage: Enabled confident compound identification in a single acquisition, improving trace-level detection of lifestyle-relevant chemicals.
 (A) Representative negative and positive mode mass spectra of wine by MALDI-MSI with silver sputter. (B) Chemical images of wine related compounds from contaminated fngerprints.
 (A) Negative mode mass spectrum and MS/MS spectra of three exogenous compounds from a mock experiment, obtained in a single multiplex acquisition by MALDI-MSI with silver sputter. (B) Chemical images of two compounds diferentiating the overlapped fngerprints.
Reference
- Hinners, Paige, Kelly C. O'Neill, and Young Jin Lee. "Revealing individual lifestyles through mass spectrometry imaging of chemical compounds in fingerprints." Scientific reports 8.1 (2018): 5149. https://doi.org/10.1038/s41598-018-23544-7
Publications
Here are some of the metabolomics-related papers published by our clients:

- A human iPSC-derived hepatocyte screen identifies compounds that inhibit production of Apolipoprotein B. 2023. https://doi.org/10.1038/s42003-023-04739-9
- The activity of the aryl hydrocarbon receptor in T cells tunes the gut microenvironment to sustain autoimmunity and neuroinflammation. 2023. https://doi.org/10.1371/journal.pbio.3002000
- Lipid droplet-associated lncRNA LIPTER preserves cardiac lipid metabolism. 2023. https://doi.org/10.1038/s41556-023-01162-4
- Inflammation primes the kidney for recovery by activating AZIN1 A-to-I editing. 2023. https://doi.org/10.1101/2023.11.09.566426
- Anti-inflammatory activity of black soldier fly oil associated with modulation of TLR signaling: A metabolomic approach. 2023. https://doi.org/10.3390/ijms241310634
- Plant Growth Promotion, Phytohormone Production and Genomics of the Rhizosphere-Associated Microalga, Micractinium rhizosphaerae sp. 2023. https://doi.org/10.3390/plants12030651