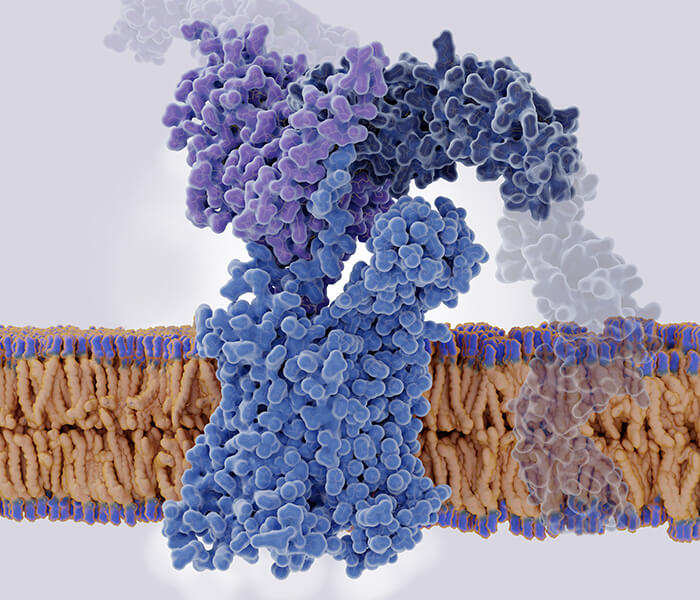
Antibodies are highly complex molecules: they are multi-chain protein with tertiary and quaternary structures, which are stabilized by the network of intramolecular and intermolecular disulfide bonds; In addition, they can include a variety of chemical sources (such as post-translational modification, glycosylation and deamidation) and genetic variation (such as single amino acid substitution from snp), most of which may affect the key parameters of antibody biological activity, such as half-life, efficacy and affinity for antigens.
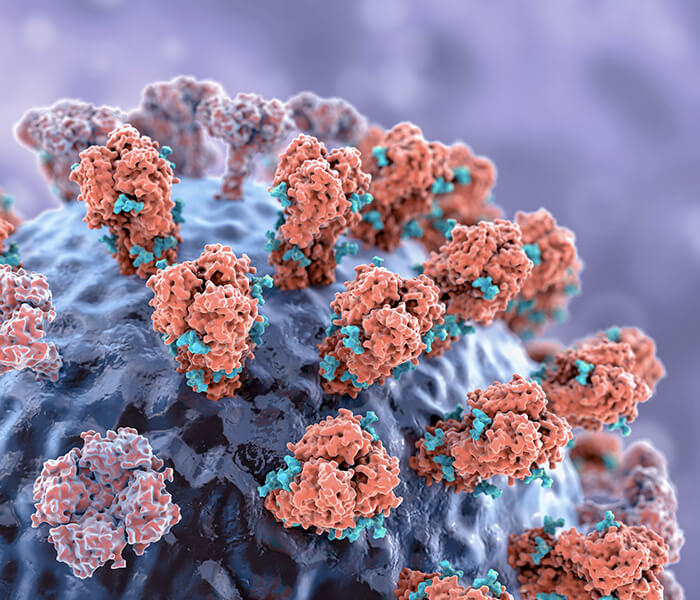
Monoclonal antibody (mAb) is a specific antibody against a specific antigenic determinant produced by a B lymphocyte. At present, monoclonal antibody drugs based on mAb are widely used in clinic because of their unique advantages of high targeting, direct access to diseased cells, reducing the damage of normal cells and reducing side effects, and are widely promoted in the fields of anti-tumor and treatment of autoimmune system defects. In order to obtain more information about human mAb, antibody sequencing method based on mass spectrometry (MS) came into being. MS has high sensitivity, Qualcomm and versatility.
At present, top-down, bottom-up and bottom-up mass spectrometry are the three main methods used in PTMs characterization, disulfide bond localization and protein sequence verification in the analysis of therapeutic monoclonal antibodies. Among the three methods, the bottom-up method combining liquid chromatography (LC) and tandem mass spectrometry (MS/MS) is usually used in pharmaceutical industry because of its standardized workflow, instrument selection and software availability. However, bottom-up mass spectrometry may be affected by lengthy sample preparation, limited protease selection to cover all protein sequences, and loss of protein form information in complex peptide libraries. Contrary to the bottom-up method, top-down mass spectrometry directly analyzes the complete protein, with minimal sample preparation, providing an overview of major protein forms and minimizing sample artifacts. However, the large size of monoclonal antibody (~ 150 kDa) and intra-chain and inter-chain disulfide bonds limit the effective cleavage of complete protein, so only 35% bond cleavage can be achieved in top-down MS/MS analysis.
 Process comparison between BU MS and TD MS (Jiang Y et al., 2024).
Besides bottom-up and top-down methods, middle-down MS is also commonly used to characterize monoclonal antibodies by analyzing subunits from limited protein hydrolysis or disulfide bond reduction. For example, Fornell and others. High resolution orbital trap Fourier transform mass spectrometry (FTMS) combined with electron transfer dissociation (ETD) was used to analyze therapeutic monoclonal antibodies and their oxidized forms. Recently, Kose and others. The performance of 193 nm ultraviolet photolysis (UVPD) in the characterization of low-grade monoclonal antibody subunits was studied, and the cleavage efficiency of UVPD and ETD was compared. Fornell and others. It also shows that in six LC runs, by combining three different cleavage techniques, UVPD, ETD and Electron Transfer/High Energy Collision Dissociation (EThcD), up to 90% of mAb subunit sequence information can be obtained in low-end MS. Compared with the bottom-up method, the middle-lower MS reduces the chance of protein form information loss by analyzing larger peptides (> 3 kDa) which may contain multiple PTM and unique isoform sequences. 28-30 In addition, because the typical bond cleavage of mAbs is 50%~ 70% in the middle-down experiment, this middle-down method improves the coverage of bond cleavage in the restricted protein representation in the top-down MS.
BU MS
BU MS can be understood as: protein is digested into a peptide with predictable end by protease during protein analysis, and then the peptide is analyzed by MS/MS instrument, and protein information in the sample is inferred by using the mass-to-charge ratio and predicted sequence of the peptide. This method, BU MS, determines the open reading frame of the peptide from the protein database by analyzing the peptide in the complete protein digestive juice.
BU MS is a peptide-centered method, which relies on the hydrolysis and digestion of whole protein protein into shorter peptides, so it is easier to separate and detect in the gas phase. After the protein sample is digested by one or more proteases, the produced peptide (protein is digested into peptide before mass spectrometry) is separated by some form of liquid chromatography (LC, usually reversed-phase high performance liquid chromatography), and then the mass of the peptide is recorded (labeled as MS1). Then select high-content precursor ions for fragmentation (dissociate the precursor ions into fragment ions in the collision zone of mass spectrometer), and record the mass of the fragment ions (labeled as MS2).
Step of BU MS
(1) separating protein mixture from the studied biological sample.
Protein is extracted and separated from complex biological samples (which can come from various biological sources, such as cells, tissues, blood, urine or other biological body fluids). Common separation methods include:
- Centrifugation: The liquid sample after cell lysis is separated into different components (such as cell membrane, nucleus, cytoplasm, etc.) by differential centrifugation, so as to extract protein.
- Protein extraction kit: The specially designed kit can be used to extract protein from different types of biological samples.
- Pretreatment: Low molecular weight impurities may be removed by salting-out and solvent precipitation first, so as to improve the purity of protein.
In this step, it is necessary to remove non-protein pollutants such as DNA, sugar and lipid, remove residual salts that may form complexes during ionization, and conduct protein classification to reduce the complexity of the sample.
(2) protein concentration of quantitative separation.
After protein is separated, it needs to be quantitatively analyzed to ensure that an appropriate amount of samples are used in subsequent analysis. Commonly used protein quantitative methods include:
- Bradford method: By detecting the combination of protein and Bradford dye and measuring the color change, the protein concentration can be estimated.
- Colorimetry: such as BCA(Bicinchoninic Acid) method or Lowry method.
- Ultraviolet absorption method: based on the absorption characteristics of aromatic amino acids in protein, the ultraviolet light is quantified.
- Spectrophotometer: These methods can usually be completed in a few hours, and the requirements for protein samples are relatively simple.
(3) separating protein by gel electrophoresis or liquid chromatography.
After quantification, the next step is to separate the protein in the sample, usually using the following techniques:
- Gel electrophoresis (SDS-PAGE): Under the action of electric field, protein was separated by gel medium according to the size (molecular weight) and charge of protein. SDS (sodium dodecyl sulfate) is a surfactant, which is used to remove the natural conformation of protein and make it negatively charged, so that it can migrate in the gel by molecular weight.
- Two-dimensional gel electrophoresis: combining SDS-PAGE with isoelectric focusing, protein was separated by isoelectric point first, and then by molecular weight, so that protein in complex samples could be separated better.
- Liquid chromatography (LC): protein was separated by a liquid chromatography column. Commonly used liquid chromatography methods include reversed-phase chromatography (RPC) and ion exchange chromatography (IEC), and protein is separated according to different physical and chemical properties.
(4) protein is hydrolyzed and cleaved by enzymes (usually trypsin).
After protein separation, it is usually necessary to use enzymes for hydrolytic cleavage. Trypsin is a commonly used enzyme, which can specifically cleave the peptide chain of protein, usually on the carboxyl side of lysine (Lys) and arginine (Arg) residues. This process is called "enzymolysis":
- Optimization of Enzymatic Hydrolysis Conditions: Enzymatic hydrolysis is carried out under different buffers, temperatures and time to ensure that protein is completely hydrolyzed into small peptide segments, which are usually between 5 and 30 amino acids in length.
- Quality control in the process of enzymolysis: In order to improve the efficiency of enzymolysis, it is sometimes necessary to add some coenzyme, adjust the pH value, or improve the activity of enzyme by means of ultrasonic treatment and heating.
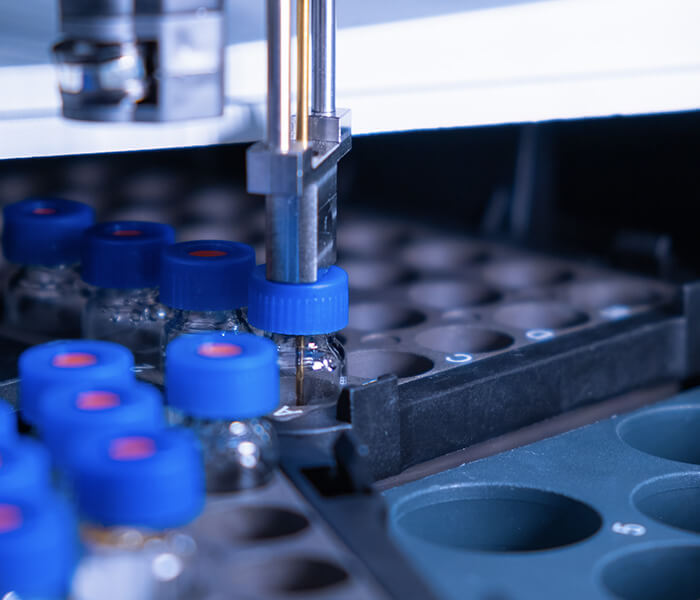
(5) performing mass spectrometry measurement on the obtained peptide.
The peptides obtained by hydrolysis need to be analyzed by mass spectrometer. Mass spectrometry measurement is to ionize the peptide, analyze its mass-to-charge ratio (m/z), and infer its amino acid sequence by mass spectrometry fragment map. Common mass spectrometry techniques include:
- LC-MS/MS: Liquid chromatography combined with mass spectrometry, which is a very effective means. The separated peptides are sent to mass spectrometry for analysis online. In mass spectrometry, the peptide was ionized and detected in the first step of mass spectrometry, and then its fragment ions were further analyzed by tandem mass spectrometry (MS/MS), thus obtaining the amino acid sequence information of the peptide.
- MALDI-TOF: Matrix-assisted laser desorption ionization time-of-flight mass spectrometry, which is a commonly used analytical method, is suitable for large-scale sample analysis, especially for Qualcomm protein omics research.
(6) Search the database for protein identification.
Finally, the peptide sequence information obtained by mass spectrometry was compared with the sequence in the known protein database, so as to identify protein. Common protein databases include:
- NCBI: Provides a large number of public protein series data.
- Swiss-Prot: Provides a manually annotated protein sequence database.
- UniProt: It is a protein database with detailed annotations and functional descriptions.
- PeptideAtlas is a database containing peptide fragments and protein information, which is specially used for mass spectrometry data analysis.
Through database search, we can get the identification information of protein, and further understand its features such as function, decoration and structure. Common search software includes:Mascot, SEQUEST, MaxQuant. Data comparison usually requires multiple analysis to confirm the reliability of protein's appraisal results.
TD MS
Top-down protein omics (TDP) provides an overall view of protein Group by analyzing the whole protein without digestion, which can decipher the function of protein, reveal the disease mechanism and promote precision medicine. TDP gave up protein digestion and directly analyzed the complete protein to obtain clear molecular details of protein form analysis. This enables accurate protein identification, PTM localization and quantification of different protein forms. TDP can inherently capture information in the form of protein because modification changes the molecular weight of protein. Subsequent fragmentation of complete protein identified protein and all its modifications, as well as any correlation between the modifications.
 The pillars of top-down proteomics (Jiang Y et al., 2024).
Step of TD MS
(1) Sample preparation and control
Protein extraction usually uses Good's buffer with high salt concentration (> 100 mM), supplemented by protease inhibitors, phosphatase inhibitors and surfactants (such as SDS or Triton X-100) to achieve total protein dissolution. However, these reagents are not compatible with Top-Down protein Tomography (TDP) because they will interfere with protein ion detection and suppress mass spectrometry signals. Therefore, incompatible salts and small molecules must be removed by ultracentrifugation filter or size exclusion chromatography (SEC) rotating column. TDP workflow usually requires complete removal of buffer salts, rather than simple buffer exchange. TDP Alliance (CTDP) has developed a standardized sample preparation scheme to ensure best practices and performance benchmarks. TDP performance can be evaluated by standard complete protein mixtures such as ubiquitin, myoglobin, trypsinogen and carbonic anhydrase. Protein degradation and modification should be minimized during sample preparation, for example, by adding protease and phosphatase inhibitor, and treating the sample at low temperature (~ 4 ℃) to slow down the modification process such as oxidation.
(2) Front-end separation and concentration strategy
By separating organelles (such as nucleus, mitochondria and endoplasmic reticulum) by differential centrifugation, protein can be extracted from subcellular components for mass spectrometry analysis. Selective separation of sub-protein formation is helpful to enrich low-abundance protein, thus improving the detection sensitivity.
(3) Equipment and workflow
TDP mainly includes three steps:
- Ionization: protein is converted into gas phase ions.
- Mass spectrometry: the complete protein was analyzed by MS1, and the sequence information was generated by MS2 cleavage.
- Data processing: protein forms were identified and quantified through database search.
TDP usually requires analyte separation, which can be achieved by direct injection or gel electrophoresis, SEC and reversed-phase liquid chromatography (RPLC).
(4) Tandem mass spectrometry
Tandem mass spectrometry (MS/MS) analyzes the primary structure and modification of proteins by selecting precursor ions and splitting them into fragment ions. TDP commonly uses mixed instruments (such as QTOF and quadrupole orbital trap) to support space or time series design.
(5) Data collection and analysis
When TDP is used to analyze various protein, chromatographic separation and mass spectrometer duty ratio should be considered. Data acquisition requires high-resolution instruments to ensure peak resolution and sensitivity. Data analysis includes mass spectrometry pretreatment, deconvolution, database search, false discovery rate (FDR) control, final identification and quantitative protein form.
(6) Identification and characterization of protein forms
TDP provides a comprehensive understanding of the formal landscape of protein by analyzing the complete protein, including combined post-translational modifications (PTMs) and subtype identification. For example, TDP revealed the expression specificity of ventricular myosin light chain 2(MLC2v) and analyzed the complex modification pattern of histone.
(7) Protein form quantification
TDP quantitative methods include:
- Unmarked quantification: based on protein formal strength.
- Isotope labeling: Quantification by differential isotope labeling.
- Chemical labeling: Quantification at MS2 level using chemical reporter molecules.
Select Service
Learn more
Middle-down MS
Low-medium mass spectrometry , that is, analysis of long (~ 50-60 aa) peptides, has become the most accurate method to characterize the post-translational modification (PTMs) of combinatorial histones. The combination of middle and lower mass spectrometry and metabolic markers is the only method that can be used to study the PTMs transformation of combined histones in dynamic systems. It is used to analyze long peptides that retain more information about coexisting PTM than bottom-up ones, but it is not as technically challenging as top-down MS. Incidentally, the middle-lower MS is very suitable for histone analysis, because the intact N- terminal tail of histone (~50-60 amino acid residues) carries most of PTM, and it can be easily cut off from the nucleosome core by using enzymes such as GluC (cutting after glutamic acid) or AspN (cutting before aspartic acid). For example, a typical human histone H3 is cleaved by GluC at residue 50, resulting in peptide aa 1-50, which can be modified in 23 different residues, including lysine, arginine, serine and threonine. This polypeptide carries the most studied residues in histone H3, leaving only H3K56, H3K79 and H3K122 and well-studied modification sites. Middle-lower MS also allows to distinguish highly similar histone variants, because a few sequence variants usually exist in the N- terminal tail.
 Middle-down MS workflow (Srzentić K et al., 2020).
References
- de Graaf SC, Hoek M, Tamara S, Heck AJR. "A perspective toward mass spectrometry-based de novo sequencing of endogenous antibodies." MAbs. 2022 Jan-Dec;14(1):2079449. doi: 10.1080/19420862.2022.2079449
- Jiang Y, Rex DAB, Schuster D, Neely BA, Rosano GL, Volkmar N, Momenzadeh A, Peters-Clarke TM, Egbert SB, Kreimer S, Doud EH, Crook OM, Yadav AK, Vanuopadath M, Mayta ML, Duboff AG, Riley NM, Moritz RL, Meyer JG. "Comprehensive Overview of Bottom-Up Proteomics using Mass Spectrometry." ACS Meas Sci Au. 2024;4(4):338-417. doi: 10.1021/acsmeasuresciau.3c00068
- Dupree EJ, Jayathirtha M, Yorkey H, Mihasan M, Petre BA, Darie CC. "A Critical Review of Bottom-Up Proteomics: The Good, the Bad, and the Future of this Field." Proteomes. 2020;8(3):14. doi: 10.3390/proteomes8030014
- Roberts DS, Loo JA, Tsybin YO, Liu X, Wu S, Chamot-Rooke J, Agar JN, Paša-Tolić L, Smith LM, Ge Y. "Top-down proteomics." Nat Rev Methods Primers.2024;4(1):38. doi: 10.1038/s43586-024-00318-2
- Sidoli S, Garcia BA. "Middle-down proteomics: a still unexploited resource for chromatin biology." Expert Rev Proteomics. 2017;14(7):617-626. doi: 10.1080/14789450.2017.1345632
- Srzentić K, Fornelli L, Tsybin YO, Loo JA, Seckler H, Agar JN, Anderson LC, Bai DL, Beck A, Brodbelt JS, van der Burgt YEM, Chamot-Rooke J, Chatterjee S, Chen Y, Clarke DJ, Danis PO, Diedrich JK, D'Ippolito RA, Dupré M, Gasilova N, Ge Y, Goo YA, Goodlett DR, Greer S, Haselmann KF, He L, Hendrickson CL, Hinkle JD, Holt MV, Hughes S, Hunt DF, Kelleher NL, Kozhinov AN, Lin Z, Malosse C, Marshall AG, Menin L, Millikin RJ, Nagornov KO, Nicolardi S, Paša-Tolić L, Pengelley S, Quebbemann NR, Resemann A, Sandoval W, Sarin R, Schmitt ND, Shabanowitz J, Shaw JB, Shortreed MR, Smith LM, Sobott F, Suckau D, Toby T, Weisbrod CR, Wildburger NC, Yates JR 3rd, Yoon SH, Young NL, Zhou M. "Interlaboratory Study for Characterizing Monoclonal Antibodies by Top-Down and Middle-Down Mass Spectrometry." J Am Soc Mass Spectrom. 2020 ;31(9):1783-1802. doi: 10.1021/jasms.0c00036