Label-free quantification (LFQ) is a mass spectrometry-based analytical technique that facilitates the relative quantification of proteins by directly analyzing the mass spectrometric signals, such as ion chromatogram peak intensities or spectral counts, of proteolytic peptides within the sample. This approach obviates the need for isotopic labeling or chemical modifications. The principal advantages of LFQ include streamlined sample processing, reduced costs, and its suitability for high-throughput analysis across a wide array of samples.
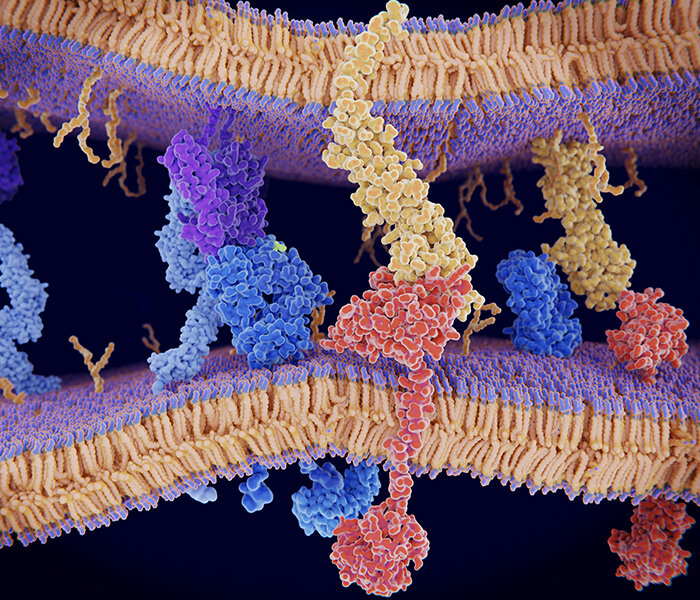
Workflow of Label-Free Quantification Mass Spectrometry
The LFQ process involves several key steps:
Sample Preparation: Proteins are extracted from biological samples and digested into peptides using enzymes like trypsin.
Liquid Chromatography (LC) Separation: Peptides are separated based on their chemical properties using liquid chromatography.
Mass Spectrometry (MS) Analysis: Separated peptides are ionized and analyzed by mass spectrometry to determine their mass-to-charge ratios.
Data Acquisition: MS data is collected, including peptide ion intensities and spectra.
Data Processing and Analysis: Software tools process the MS data to identify peptides and quantify their abundances. Normalization techniques are applied to account for technical variations.
Statistical Analysis: Statistical methods are used to identify significant differences in protein abundances between samples.
 Schematic workflow of label-free quantification mass spectrometry (LFQ-MS) (Eldi Sulaj et al,. 2024)
Key Principles
The quantitative foundation of label-free quantification (LFQ) inherently falls into two main categories:
Extracted Ion Chromatogram (XIC) Method
This technique quantifies by extracting the chromatographic peak area or intensity of peptide precursor ions at specific retention times. High-resolution mass spectrometers, such as the Orbitrap, enable precise differentiation of isotopic peak clusters. When combined with algorithmic reconstruction of chromatographic peaks, high-accuracy quantification is achieved. An important consideration is that the accuracy of XIC heavily depends on the stability of chromatographic retention times. Recent advancements in machine learning algorithms have been employed to correct retention time drifts, significantly enhancing the comparability of data obtained across experimental batches, as demonstrated by optimization in MaxQuant's matching algorithms.
Spectral Counting (SC) Method
This approach is predicated on the assumption that peptides corresponding to high-abundance proteins are detected more frequently by mass spectrometry. Quantification is performed by counting the number of peptide-spectrum matches (PSMs) identified for a given protein. Despite being cost-effective, the sensitivity of SC is constrained by the dynamic range of the mass spectrometer and the efficiency of peptide identification. Notably, SC can yield substantial errors with small sample sizes or when analyzing low-abundance proteins, yet it retains utility in exploratory studies, particularly for initial screening of differential proteins.
Applications in Proteomics Research
Biomarker Discovery: LFQ aids in identifying potential biomarkers for diseases.
Protein Expression Profiling in Disease Progression: It helps in understanding how protein expression changes during disease development.
Drug Response Studies: LFQ is used to assess how drugs affect protein expression.
Environmental Proteomics: It allows for the analysis of protein expression in response to environmental changes.
Clinical Screening: LFQ is utilized in clinical settings to analyze protein expression profiles.
Explore our Label-Free Quantification Services or get in touch with us today to learn more about how we can support your proteomics research!
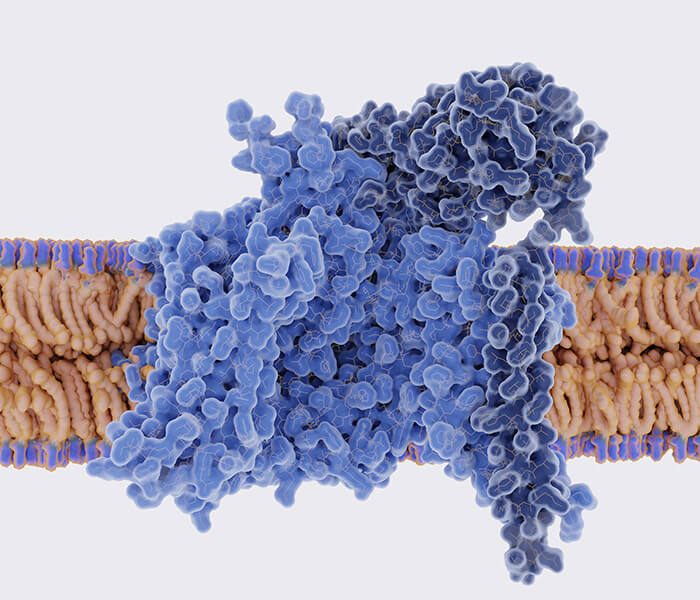
 Quantitative Variability in Label-free Protein Abundance Estimates (MHD Rami Al Shweiki et al,.2017)
Applications of Label-Free Quantification in Clinical Research
1. Biomarker Discovery and Disease Mechanism Elucidation
LFQ has been pivotal in biomarker discovery by comparing protein abundance differences between diseased and normal tissues across various diseases:
Cancer Biomarker Screening: LFQ has been utilized to identify low-abundance proteins such as kinases and cytokine receptors related to tumor progression by analyzing serum/plasma samples from cancer patients and healthy controls. These studies often demand sample volumes of at least 500 µL of serum, with strict data curation (e.g., coefficients of variation < 20%) to enhance reproducibility.
Neurodegenerative Diseases: In Alzheimer's disease research, LFQ has detected aberrant expression of enzymes involved in β-amyloid metabolism during cerebrospinal fluid analysis, uncovering new regulatory mechanisms underlying pathological protein aggregation.
2. Drug Efficacy and Toxicity Assessment
LFQ is instrumental in preclinical drug development for quantifying dynamic changes in drug target proteins:
Pharmacodynamics Studies: In a clinical trial involving anticancer drugs, LFQ quantitatively analyzed phosphorylation changes in signaling pathway proteins, such as the PI3K/AKT/mTOR pathway members, in patients' peripheral blood mononuclear cells, validating drug target inhibition.
Hepatotoxicity Prediction: By evaluating metabolic enzyme expression differences, such as the CYP450 family, in hepatocyte models pre- and post-drug treatment, LFQ can preemptively indicate potential liver injury risks, thereby optimizing drug candidate selection.
3. Fluid Proteomics and Non-Invasive Diagnostics
LFQ's high sensitivity makes it uniquely advantageous in fluid sample analyses:
Urinary Biomarker Exploration: In chronic kidney disease (CKD) patients, LFQ identified aberrant expression of proteins like integrin αVβ6 from urinary exosomes, with abundance significantly correlating with renal function impairment, offering new non-invasive diagnostic indicators.
Salivary Proteomics: In oral cancer screening, LFQ identified upregulated S100A8/A9 protein complexes in saliva, with diagnostic specificity surpassing traditional cytological examinations.
4. Infectious and Immune-Related Disease Research
Pathogen-Host Interactions: LFQ applied to plasma analysis of COVID-19 patients revealed excessive activation of complement system proteins, such as C3 and C5, correlating with severe pneumonia progression, providing insights for immunomodulatory therapy.
Autoimmune Diseases: In synovial fluid studies of rheumatoid arthritis, LFQ uncovered co-expression patterns of MMP-3 and TNF-α-induced proteins, guiding personalized anti-inflammatory treatment regimens.
Technical Limitations and Solutions
Despite LFQ's widespread application in clinical research, certain challenges persist:
Batch Effect Correction: Introducing internal standards such as iRT peptides or employing the ComBat algorithm is essential for eliminating systemic biases across multi-center datasets.
Detection of Low-Abundance Proteins: Combining high-pH reversed-phase fractionation and data-independent acquisition (DIA) can enhance the detection rate of low-abundance proteins in complex samples like plasma.
Exemplary Clinical Study Cases
Case Study 1: In a 2023 study on colorectal cancer (n=120), LFQ analysis of tissue and paired serum samples identified ANGPTL4 as a predictive biomarker for metastasis (AUC=0.89), findings published in Clinical Cancer Research.
Case Study 2: Within a diabetic nephropathy cohort (n=200), LFQ, combined with machine learning, identified a urinary protein combination of LCN2 and RETN, surpassing traditional eGFR metrics in diagnostic accuracy.
Solutions to Sample Quantity Limitations in LFQ Technology
1. Reducing the Protein Requirement per Sample
LFQ inherently demands relatively low sample volumes (e.g., as little as 200 µL of serum per sample). However, for clinical research involving rare cases or precious samples, the sample requirement can be further minimized through the following strategies:
High-Sensitivity Mass Spectrometry Platforms: Utilizing high-resolution mass spectrometers like QE-HFX, in conjunction with nano-liquid chromatography (nano-LC), reduces sample consumption to the nanogram level (e.g., 10 ng of total protein).
Sample Pre-Enrichment Techniques: Techniques such as immunoaffinity depletion of high-abundance proteins (e.g., albumin in plasma) or exosome isolation can enrich low-abundance target proteins, thereby enhancing detection sensitivity.
2. Optimization of Experimental Design
Technical Replicates and Batch Correction: Performing mass spectrometry in triplicate for each clinical sample and using internal standard peptides (e.g., iRT peptides) to correct for retention time drift can mitigate data variability.
Mixed Sample Strategy: In cohort studies, pooling equal amounts from multiple patient samples (e.g., 15 samples per group) can be employed, although this approach necessitates careful consideration of the potential loss of individual variability information.
3. Enhancement of Data Analysis Algorithms
Machine Learning-Assisted Peak Integration: Advanced algorithms in software like MaxQuant can accurately quantify chromatographic peak areas of low-signal peptides, reducing quantification bias caused by limited sample sizes.
Imputation of Missing Values: Methods such as k-nearest neighbor analysis exploit peptide abundance correlations across samples to fill in data gaps resulting from limited sample availability, thereby improving data completeness.
4. Integration with Multi-Omics Data
For small-sample cohorts (e.g., n=10-20), the reliability of LFQ results can be bolstered through:
Integration with Transcriptomics/Metabolomics: Correlating protein expression changes with gene or metabolite levels can reduce false positive rates.
Supplementing with Public Databases: Utilizing proteomics data from platforms like TCGA or PRIDE for cross-cohort validation enhances the robustness of findings.
Comparative Advantages of LFQ Over Other Proteomics Techniques
1. Simplified Workflow Without Isotopic Labeling
LFQ offers a streamlined experiment without the need for isotopic labeling reagents such as TMT (Tandem Mass Tag) or SILAC (Stable Isotope Labeling by/with Amino acids in Cell culture), relying instead on the direct quantification of mass spectrometry signal intensities, such as the peak area of extracted ion chromatograms (XIC).
Advantages:
Cost Reduction: By eliminating the need for expensive labeling reagents (e.g., TMT), LFQ is particularly suited for large-scale clinical cohort studies with limited budgets.
Minimized Sample Loss: The absence of labeling processes reduces potential sample loss, making LFQ ideal for analyses involving small sample quantities, such as body fluids or biopsy tissues.
Increased Flexibility: LFQ supports the analysis of any number of samples, unrestricted by the channel limitations of TMT labeling (up to 18 samples currently).
2. Compatibility with Complex Fluids and Low-Abundance Protein Analysis
LFQ exhibits superior performance in the analysis of biological fluids (e.g., plasma, urine, saliva) and detection of low-abundance proteins:
Fluid Compatibility: Through techniques such as immunoaffinity depletion of high-abundance proteins (e.g., albumin in plasma) or exosome enrichment, LFQ enhances the detection rate of low-abundance proteins.
Case Study: In salivary proteomics research, LFQ demonstrated higher quantitative depth than TMT, successfully identifying oral cancer biomarkers such as S100A8/A9.
3. Shorter Experimental Duration, Ideal for Large Cohort Studies
Compared to TMT and DIA (Data-Independent Acquisition), LFQ features a more simplified experimental workflow:
Reduced Preprocessing Steps: The absence of labeling reactions or complex fractionation decreases the overall experimental timeline (typically reduced by 1-2 weeks).
Large Cohort Compatibility: In clinical settings requiring analysis of hundreds of samples (e.g., tumor cohorts), LFQ negates the need for batch-wise processing, avoiding the quantitative variance seen with multiple TMT batches (inter-batch CV values can escalate to 10%).
4. Enhanced Data Correction Algorithms
LFQ utilizes software algorithms, such as MaxQuant's LFQ intensity correction, to mitigate the impact of sample preparation and instrument variability:
Cross-Sample Normalization: Protein expression levels across different samples are normalized to enhance quantitative reliability.
Machine Learning Assistance: Advanced tools (e.g., DIA-NN) employ deep learning to refine peak integration, reducing errors in the quantification of low-signal peptides.
5. Flexible Applicability
Exploratory Studies: LFQ facilitates initial screening for unknown differential proteins without the need for pre-designed labeling groups.
Wide Dynamic Range: In simple samples (e.g., purified proteins, subcellular fractions), LFQ's quantitative depth rivals that of TMT, often at a lower cost.
Phosphoproteomics Applications: LFQ minimizes sample loss in phosphopeptide analysis, enabling coverage of more phosphorylation sites in a single experiment.
Comparative Limitations and Complementarities with TMT and DIA
Limitations of TMT:
Ratio Compression Effect: Protein fold changes detected by TMT are often underestimated (e.g., a threefold change may appear as a twofold change).
Batch Effect: Multi-batch TMT data can suffer from up to 50% missing values, with significantly increased inter-batch CV values.
Advantages and Challenges of DIA:
Comprehensive Data Acquisition: DIA provides more extensive data collection without stochastic scanning, achieving quantification accuracy equal to or exceeding TMT.
Complexity in Spectrum Deconvolution: However, DIA requires sophisticated spectral deconvolution algorithms, while LFQ's DDA (Data-Dependent Acquisition) mode data is more straightforward to process.
LFQ's core advantages include its label-free design, cost-effectiveness, and broad sample compatibility, making it especially suitable for fluid analysis, large cohort clinical studies, and budget-conscious projects. Despite its data stability being slightly inferior to single-batch TMT and DIA, reliability can be significantly enhanced through technical replicates, algorithmic corrections, and sample enrichment strategies. In scenarios involving simple protein compositions or large sample volumes, LFQ remains one of the premier technologies of choice.
Quantitative Accuracy of LFQ Techniques
1. Key Factors Influencing LFQ Quantitative Accuracy
Mass Spectrometer Performance
The use of high-resolution mass spectrometers, such as Orbitrap and Fourier Transform Ion Cyclotron Resonance (FTICR), significantly enhances the accurate separation of isotopic peak clusters, thereby improving the integration precision of precursor ion peak areas (e.g., XIC) and overall quantitative accuracy. For instance, the Orbitrap's mass-to-charge ratio (m/z) resolution reaches up to 140,000, markedly reducing signal interference.
Chromatographic Retention Time Stability
Drift in liquid chromatography (LC) retention times can lead to misalignment in peptide matching across samples. Incorporating internal standard peptides, such as iRT (indexed Retention Time) peptides, or applying machine learning algorithms to correct retention time shifts, has reduced inter-batch coefficient of variation (CV) values to below 15%.
Data Acquisition Modes
In Data-Dependent Acquisition (DDA) mode, low-abundance peptides may be stochastically missed, potentially introducing quantitative errors. Conversely, Data-Independent Acquisition (DIA), which scans all ions through fixed windows, reduces stochastic effects, yielding higher quantitative stability, albeit requiring sophisticated spectral deconvolution algorithms.
2. Comparative Quantitative Accuracy of LFQ with Other Techniques
| Aspect | LFQ | TMT/iTRAQ | DIA |
|---|---|---|---|
| Labeling Requirement | No labeling reagents needed | Requires isotopic labeling | No labeling required, but needs spectrum library |
| Ratio Compression Effect | Avoids this effect | Prone to ratio compression, underestimating differences | Not applicable as it's label-free |
| Cross-Sample Reproducibility | Lower reproducibility compared to single-batch labeling techniques | High intra-batch reproducibility (CV within 10%) | Dependent on the quality of the spectral library |
| Quantitative Dynamic Range | Limited in highly complex samples (e.g., plasma) with CV reaching 20-30% | Broad dynamic range due to precise labeling | Broader quantitative dynamic range, especially for low-abundance proteins |
| Data Processing Complexity | Simpler data processing | More complex due to labeling and normalization steps | Complex due to the need for spectral library construction and matching |
| Application Suitability | Suitable for simpler samples like purified proteins | Ideal for complex samples requiring high precision and reproducibility | Best for comprehensive analysis of complex samples with a focus on low-abundance proteins |
Services You May Be Interested In:
Additional Resources:
3. Strategies to Enhance LFQ Quantitative Accuracy
Technical Replicates and Standardization Procedures
Implementing a minimum of three replicate analyses per sample, alongside LFQ intensity normalization algorithms in software like MaxQuant, can reduce quantitative errors to below 15% in individual samples.
Sample Preprocessing Optimization
For biological fluids (e.g., plasma), employing immunoaffinity depletion of high-abundance proteins (e.g., albumin) or exosome enrichment can increase the detection rate of low-abundance proteins by 2-3 times, mitigating quantitative bias attributable to signal masking.
Algorithm Enhancement
Deploying machine learning-assisted peak integration (e.g., using DIA-NN's deep learning models) or missing value imputation (e.g., k-nearest neighbor method) can enhance the quantitative reliability of low-signal peptides, particularly impactful when sample sizes are limited.
4. Quantitative Accuracy in Practical Applications
Clinical Research Example
In a colorectal cancer LFQ study, strict adherence to technical replicates (three per sample) and retention time correction achieved a quantitative CV for ANGPTL4 of less than 12%, with an AUC value of 0.89, establishing it as a robust biomarker.
Technical Validation Data
In assessing standard protein mixtures, such as UPS2, LFQ demonstrated a dynamic quantitative range extending across four orders of magnitude, correctly identifying differentially expressed proteins with greater than 85% accuracy.
Improvement Pathways for LFQ Technology
1. Hardware and Chromatography System Upgrades
Utilization of advanced spectrometers, such as the Orbitrap Astral, coupled with the 200 Hz high-speed scanning Astral analyzer, significantly extends the dynamic range to five orders of magnitude and improves low-abundance protein detection sensitivity (e.g., limits of detection reaching 10 ng total protein).
Adoption of microfluidic chromatography technologies, like micro-pillar array columns (µPAC Neo), enhances retention time stability, effectively reducing inter-batch CV values to below 5%, particularly beneficial for large clinical cohort studies.
2. Data Acquisition and Analysis Algorithm Optimization
Enhanced DIA workflows, such as Velocity LFQ DIA, integrate DIA with directDIA analysis sans spectrum library, enabling the identification of over 7,000 proteins within a single 30-minute gradient, with quantitative CVs under 7%.
Machine learning and deep learning applications, exemplified by the neural network models in DIA-NN, optimize peptide identification, minimize missing values, and elevate quantitative precision, reflected in inter-sample correlation R² values exceeding 0.98.
3. Expanding Dynamic Range and Detection of Low-Abundance Proteins
Field Asymmetric Ion Mobility Spectrometry (FAIMS Pro Duo) reduces background noise, dramatically increasing the detection rate of low-abundance proteins such as cytokines in plasma samples by over threefold.
Sample enrichment strategies, using immunoaffinity depletion of high-abundance proteins or exosome isolation, significantly enhance the detection depth of low-abundance biomarkers in fluid samples.
Alternatives and Future Trends in LFQ
1. Enhanced DIA Techniques
diaPASEF Technology: Combines ion mobility (4D proteomics) with DIA, optimizing scanning windows through m/z and mobility time matching, achieving nearly 100% ion utilization and quantifying over 7,500 proteins per experiment with a median CV of 11.5%.
Reduced Spectrum Library Dependency: Advanced software like Spectronaut 17 employs directDIA+ algorithms to analyze 90% of DIA data without pre-constructed libraries, shortening experimental cycles and cutting costs.
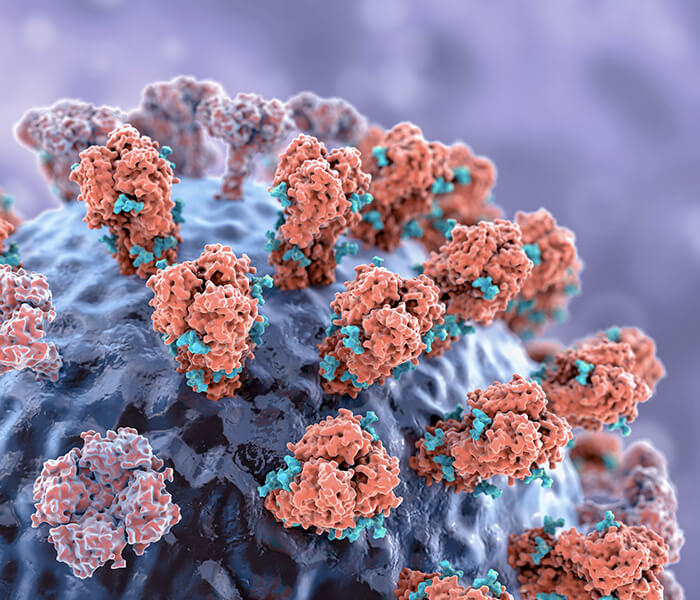
 DIA-based label-free (absolute protein quantification) APQ approach (Bing He et al,. 2019)
2. 4D-LFQ Technology
Ion Mobility-Assisted Alignment: Four-dimensional (m/z, retention time, ion mobility, intensity) data alignment reduces LFQ missing values by 50% and enhances cross-platform comparability using MaxQuant's MBR-ddaPASEF algorithm.
Single-Cell Proteomics Extension: 4D-LFQ, in conjunction with microfluidic sorting, can quantify over 1,000 proteins at the single-cell level, overcoming traditional LFQ sample size limitations.
3. Integration of Labeling and Label-Free Techniques
Hybrid Quantification Strategy: Employs TMT labeling for core samples in large clinical cohorts to ensure high-precision quantification, while utilizing LFQ for the remainder to minimize costs, with batch effect correction algorithms like ComBat.
Inner Peptide Calibration: Incorporates stable isotope-labeled internal peptides (e.g., iRT peptides) to concurrently adjust for retention time drift and ionization efficiency variability in LFQ, reducing quantitative errors below 10%.
4. Multi-Omics Integration
Combining LFQ with metabolomics and transcriptomics data, combined with AI models (e.g., DIA-NN's deep learning module), facilitates the elucidation of cross-omics regulatory networks, advancing biomarker discovery.
5. Cloud-Based Standardization Platforms
Frameworks like ProteomeXchange develop standardized LFQ protocols to minimize inter-laboratory technical discrepancies, such as chromatography column batch effects.
6. Real-Time Data Processing
Integrating edge computing devices with mass spectrometers enables real-time LFQ data analysis and quality control, such as the automatic exclusion of peptides with CVs greater than 20%.
Improvements in Quantification Accuracy for Low-Abundance Proteins: Enhancing the detection of low-abundance proteins remains a challenge.
Standardization of LFQ Protocols Across Laboratories
Developing standardized protocols is essential for reproducibility and comparability of results.
People Also Ask
Q: What is the difference between label-free and labeled quantification in proteomics?
A: Label-free quantification does not use chemical labels to tag proteins, relying instead on peptide ion intensities or spectral counts. Labeled methods use isotopic or chemical tags to label proteins before analysis, allowing for direct comparison of samples within a single run.
Q: How accurate is label-free quantification?
A: Label-free quantification can be highly accurate, especially when using high-resolution mass spectrometers. Studies have shown that LFQ can achieve average coefficients of variation (CV) around 10-15% for technical replicates, ensuring reliability for large-scale proteomic studies.
Q: What are the main challenges in label-free quantification?
A: The main challenges include chromatographic alignment between runs, proper normalization of data, and accurate quantification of low-abundance proteins. Additionally, LFQ requires careful experimental design and data analysis to minimize technical variability. To address these challenges, it is crucial to use advanced data analysis tools and adhere to strict quality control protocols.
Q: Can label-free quantification be used for absolute protein quantification?
A: While label-free methods are primarily used for relative quantification, they can be adapted for absolute quantification by using standard peptides or proteins with known concentrations as references. This approach helps to enhance the precision of quantification and ensures more accurate results in quantitative proteomics experiments.
Conclusion
Label-free quantification mass spectrometry (LFQ) is revolutionizing the field of proteomics by offering a simpler, more cost-effective alternative to traditional labeling techniques. Its ability to provide detailed and reproducible protein quantification without the need for chemical tags makes it an invaluable tool for researchers in various fields, from biomarker discovery to clinical screening. The continued advancements in mass spectrometry technologies and data analysis software will further enhance the power and accuracy of LFQ, making it a cornerstone of modern proteomics.
References
- Carnielli, C.M., Macedo, C.C.S., De Rossi, T. et al. Combining discovery and targeted proteomics reveals a prognostic signature in oral cancer. Nat Commun 9, 3598 (2018). https://doi.org/10.1038/s41467-018-05696-2
- Greco TM, Kennedy MA, Cristea IM. Proteomic Technologies for Deciphering Local and Global Protein Interactions. Trends Biochem Sci. 2020 May;45(5):454-455. doi: 10.1016/j.tibs.2020.01.003. Epub 2020 Feb 5. PMID: 32035732.
- Kwon YW, Jo HS, Bae S, Seo Y, Song P, Song M, Yoon JH. Application of Proteomics in Cancer: Recent Trends and Approaches for Biomarkers Discovery. Front Med (Lausanne). 2021 Sep 22;8:747333. doi: 10.3389/fmed.2021.747333. PMID: 34631760; PMCID: PMC8492935.
- Sulaj E, Schwaigerlehner L, Sandell FL, Dohm JC, Marzban G, Kunert R. Quantitative proteomics reveals cellular responses to individual mAb expression and tunicamycin in CHO cells. Appl Microbiol Biotechnol. 2024 Jun 19;108(1):381. doi: 10.1007/s00253-024-13223-1. PMID: 38896138; PMCID: PMC11186912.