
What Is 4D Proteomics?
4D Proteomics augments high-resolution LC–MS/MS with TIMS and ion-mobility–enabled DIA acquisition, separating peptide signals along four orthogonal axes:
- m/z (mass-to-charge)
- Retention time (chromatographic)
- Intensity (quantitative signal)
- Ion mobility / CCS (gas-phase separation from TIMS)
Adding the ion-mobility dimension decongests complex spectra, improves precursor selection (higher ion utilization), and enhances peptide feature alignment across runs—enabling deeper identification and more complete, reproducible quantification without increasing sample consumption.
Content Guide
- Why 4D Proteomics?
- What We Solve
- Why Creative Proteomics
- 4D Proteomics Solutions
- 4D → Targeted (How They Work Together)
- Workflow
- Platforms & Methods
- Sample Requirements
- Deliverables
Why 4D Proteomics
Traditional DDA and standard DIA workflows can face limitations when analyzing complex biological samples: under-sampling, co-fragmentation, and missing values that compromise data completeness. 4D Proteomics integrates trapped ion mobility spectrometry (TIMS) with ion-mobility–enabled DIA acquisition, creating an additional gas-phase separation dimension. This design increases ion utilization, reduces spectral crowding, and enhances peptide feature alignment, which together provide more confident identifications and robust quantification.
When to Choose 4D Proteomics
- Large or multi-batch label-free cohort studies requiring consistent quantitation across runs.
- Complex or heterogeneous matrices such as plasma, serum, FFPE tissues, or primary cells where conventional DIA struggles with interference.
- Projects focused on low-abundance proteins or subtle biological changes that demand improved sensitivity and selectivity.
- Non-model organisms or systems lacking established spectral libraries, where library-free and hybrid strategies can still ensure deep coverage.
- PTM-focused research where site localization accuracy is essential to interpret regulatory mechanisms.
What Problems Does 4D Proteomics Solve?
From complex matrices to PTM analysis, see how 4D proteomics addresses real research challenges.

Heterogeneous and Complex Matrices
TIMS-guided separation and matrix-aware acquisition turn plasma/serum, FFPE tissues, and primary cells into cleaner, interpretable proteome readouts.

Low-Abundance Protein Detection
4D selectivity lifts scarce peptides above background, revealing faint expression shifts so small effect sizes can be prioritized confidently.

Large-Scale and Multi-Batch Studies
Label-free studies across dozens or hundreds of runs often suffer from variability and missing data. 4D Proteomics applies IM-aware alignment and standardized ion-mobility DIA windows, producing harmonized quant tables with typically <2–5% protein-level missingness.

Post-Translational Modification Analysis
Targeted enrichments plus TIMS-enhanced selectivity deliver site-level phospho/ubiquitin/acetyl/glyco assignments with clear evidence for pathway analysis.

Projects Without Established Spectral Libraries
Projects can begin immediately in library-free mode, avoiding delays. When deeper coverage is needed, hybrid libraries can be added, giving flexibility without restarting the workflow.

From Discovery to Targeted Verification
Datasets can be retrospectively mined and smoothly transitioned into targeted panels (prm/mrm), reducing reruns and ensuring a faster route from global discovery to focused validation.
Advantages of Our 4D Proteomics
Comprehensive Protein Profiling
7,000–9,000 Proteins / Run
Profile thousands of proteins per experiment, providing a broad and unbiased view of biological pathways.
Quantitative Precision
Protein CV ≤10–15%
Deliver stable and reproducible label-free quantitation across large-scale studies.
Dynamic Range
~5–6 Orders of Magnitude
Detect proteins across wide abundance levels to capture subtle biological differences.
Data Completeness
<2–5% Missingness
IM-aware alignment minimizes missing values and increases cross-run comparability.
Mass Accuracy & Stability
~1–2 ppm; TIMS/RT R² ≥0.99
Strict calibration ensures high-confidence identifications and consistent reproducibility.
PTM Site-Level Confidence
Phospho • Ubiquitin • Acetyl • Glyco
TIMS-enhanced selectivity supports accurate localization of diverse PTM sites.
4D Proteomics Tailored to Your Needs
Choose from discovery, PTM, targeted, label-free, glyco, or metaproteomics modules.

Discovery 4D-DIA (ion-mobility DIA)
- Global, label-free quantification with a library-free start.
- Expandable into hybrid spectral libraries and optional fractionation for deeper proteome coverage.

Targeted 4D Quant (prm-PASEF / mrm-PASEF)
- High-selectivity verification panels for pathway confirmation and bioprocess CQAs (research use).
- Back-calculations from discovery datasets to design fit-for-purpose assays.
PTM-4D Proteomics (Phospho, Ubiquitin, Acetyl, Glyco)
- Enrichment workflows for phosphorylation (TiO₂/IMAC), ubiquitin-remnant (K-ε-GG), acetylation, and glycosylation.
- Delivers stringent site localization, motif analysis, and kinase/substrate inference.
- Supports combined phospho–glyco crosstalk designs for pathway-level insight.

4D Label-Free Proteomics
- End-to-end 4D workflow optimized for depth, reproducibility, and input flexibility.
- Supports low-input samples with robust cleanup and IM-aware alignment for consistency.
4D Glycosylation Proteomics
- Comprehensive analysis of glycosites and glycoforms, including O-GlcNAc mapping and N-/O-glycoform profiling.
- Optional combined phospho–glyco studies to explore regulatory crosstalk.

4D-LFQ Metaproteomics
- Large-scale community-level proteomics with cohort stability across diverse samples.
- Includes optional taxonomy and functional annotations for microbiome and environmental research.
Discovery 4D-DIA vs Targeted PRM/MRM with ion-mobility — Decision Guide
Match your research goals with the right acquisition strategy for the best outcomes.
| Study Goal | Recommended Path | Rationale | Typical Output |
|---|---|---|---|
| Global profiling / hypothesis generation | Discovery 4D-DIA | Maximize IDs and coverage; robust across cohorts | Protein/peptide matrices; pathway insights |
| Confirm specific pathways or markers | Targeted PRM/MRM with ion-mobility | High selectivity and precision on curated panels | Panel-level quant; longitudinal comparability |
| PTM landscape (phospho, ubiquitin, acetyl, glyco) | PTM-4D modules | Enrichment + 4D selectivity improves site-level confidence | Localized PTM site tables; motif/kinase analyses |
| Bioprocess comparability / HCP profiling | 4D-DIA ± targeted follow-up | Cohort-scale consistency; panel verification for CQAs | Batch reports, control charts, verified targets |
Step-by-Step 4D Proteomics Workflow
At Creative Proteomics, our 4D proteomics workflow is tailored to deliver reliable data—from exploratory profiling to targeted validation. Each step is optimized for reproducibility, depth, and clarity.
Define biological questions, matrices, effect sizes, and statistical power; choose discovery vs targeted vs PTM modules.
Lysis and digestion under detergent-aware protocols; cleanup via S-Trap / SP3 / FASP-like workflows; spike-in iRT and process controls.
Optimized ion-mobility windows and DIA isolation schemes tuned to matrix complexity and throughput targets.
Library-free or hybrid spectral libraries; 1% FDR at PSM/peptide/protein levels; peptide uniqueness filters per scope.
Normalization, missing-value handling, differential expression, variance modeling; batch harmonization with bridge samples (if multi-batch).
Pathway/GO/Reactome enrichment, GSEA-style analysis, clustering/PCA/UMAP; publication-ready figures and an auditable QC pack.
- Library-free → hybrid: start immediately, deepen coverage as needed
- Cohort-grade consistency: IM-aware alignment and pooled QC/bridge strategy
- Low-input options: conserve material without sacrificing depth
- Expert support: guidance from study design to interpretation
What Makes Our 4D Proteomics Service Stand Out?
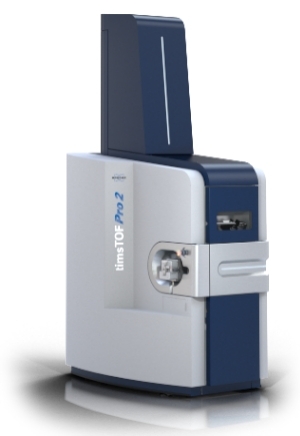
timsTOF Pro / timsTOF Pro 2 (Bruker)
Technology: Trapped Ion Mobility Spectrometry (TIMS) combined with parallel ion accumulation with serial fragmentation.
Acquisition Strategy: ion-mobility DIA for discovery proteomics, with optional PRM/MRM with ion-mobility for validation.
Key Parameters:
- Duty cycle > 100 Hz
- Ion mobility resolution R > 200
- Mass accuracy 1–2 ppm
Strengths: 4D separation reduces interference, enhances ion utilization, and delivers deeper coverage with fewer missing values.
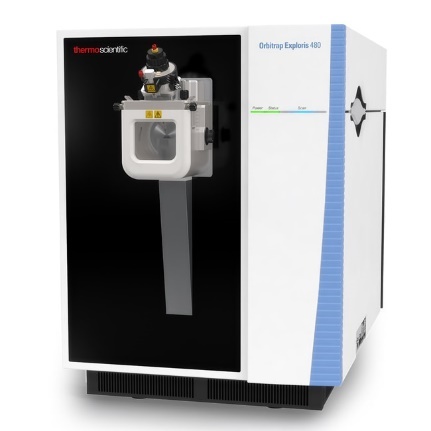
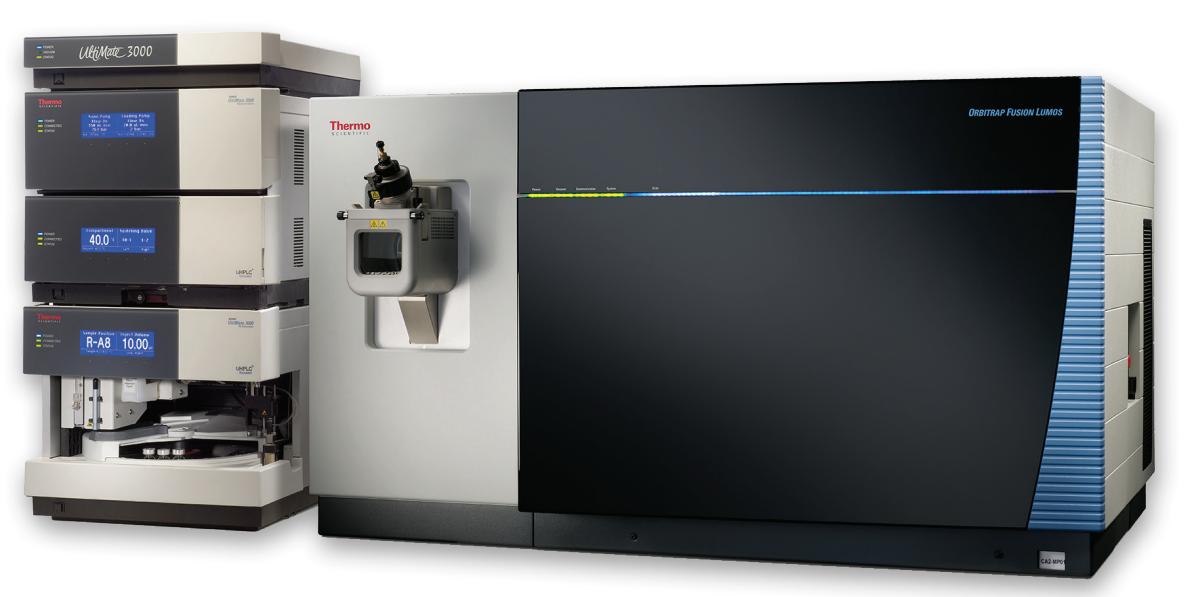
Orbitrap Exploris 480 / Fusion Lumos (Thermo Scientific)
Technology: High-field Orbitrap mass analyzer with quadrupole selection.
Acquisition Strategy: DIA or hybrid library-free approaches for large-cohort discovery studies.
Key Parameters:
- Resolution up to 480,000 at m/z 200 (Exploris)
- Mass accuracy < 2 ppm
- Dynamic range ~ 5–6 orders of magnitude
Strengths: Excellent mass accuracy and stability, well-suited for cohort-scale proteomics, PTM studies, and quantitative discovery.
Data Acquisition Approach
- DIA (Data-Independent Acquisition, incl. ion-mobility DIA): Captures all detectable precursors, minimizing missing values and improving reproducibility.
- Library-Free or Hybrid Modes: Ensure high-quality quantitation even without existing spectral libraries, making the approach versatile for both model and non-model organisms.
4D Proteomics: Sample Requirements and Preparation
Buffer compatibility: Please avoid strong detergents and chaotropes in final submissions; we perform cleanup as needed.
QC controls: We incorporate system-suitability standards (iRT, reference digests) and recommend pooled QC + biological replicates.
| Matrix / Type | Recommended Input (typical) | Storage & Handling |
|---|---|---|
| Cells | ≥ 1–5 × 10⁶ cells (total protein equivalent) | Snap-freeze pellet; avoid residual detergents and high salt |
| Tissue (fresh/frozen) | ≥ 20–50 mg wet weight | Snap-freeze; minimize ischemia time; aliquot to avoid re-freeze |
| FFPE | 5–10 curls or sections (thickness per lab SOP) | Store at ambient in low humidity; provide H&E where available |
| Serum/Plasma | ≥ 50–200 µL | Freeze promptly; avoid repeated freeze–thaw |
| CSF/Urine/Other | ≥ 200–500 µL (matrix-dependent) | Clarify via low-speed spin; freeze supernatant |
| Organoids/Microdissected | As available; consult for low-input workflows | Carrier strategies and peptide boosts available |
Not sure whether your samples meet the requirements?
Contact us — we're happy to help design the best strategy for your 4D proteomics study.
What You'll Receive from Our 4D Proteomics Service
Data, insights, and publication-ready results for your research
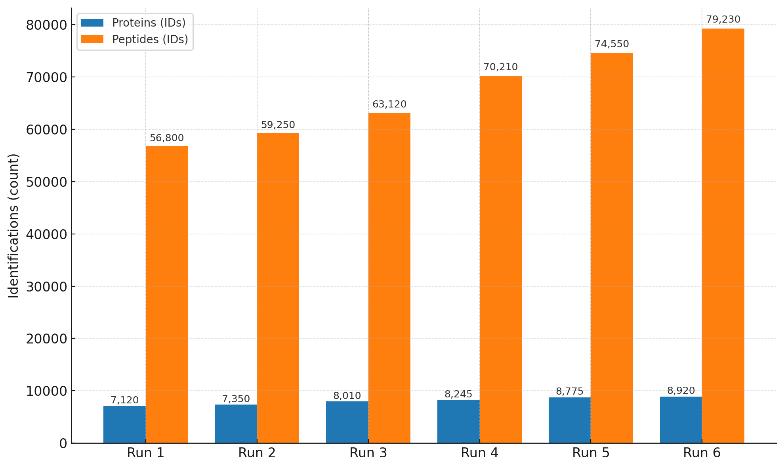
Single 4D-DIA runs identify more than 7,000 proteins and tens of thousands of peptides, demonstrating deep proteome coverage.
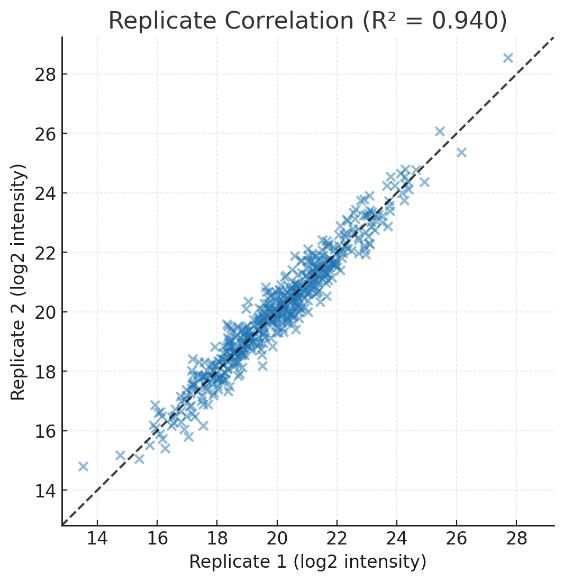
High correlation between biological replicates (R² > 0.95) confirms the stability and reproducibility of quantitation.
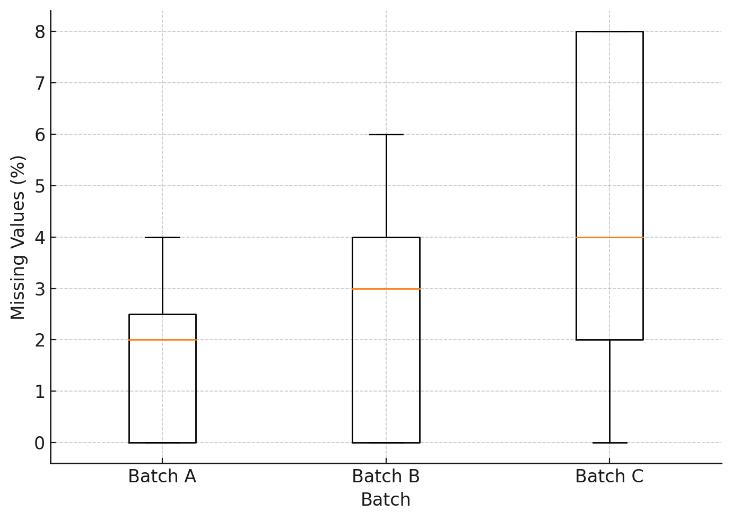
Across-batch missing values remain below 5%, highlighting the data completeness of 4D-DIA.
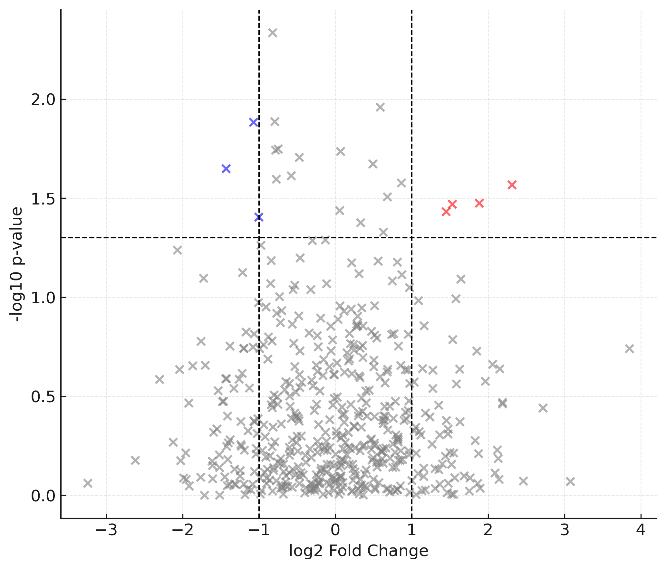
Differential expression analysis highlights significantly up- and down-regulated proteins, visualizing biological contrasts.
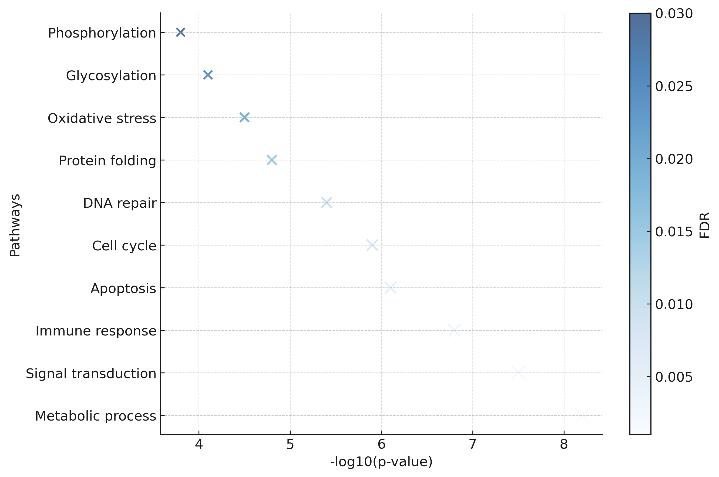
Bubble plot of enriched GO/KEGG pathways, where bubble size represents protein count and color reflects FDR significance.
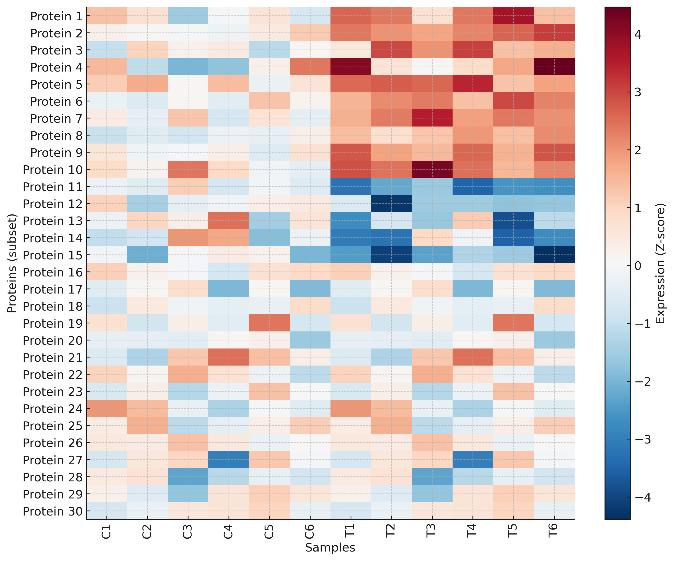
Clustered heatmap of protein expression illustrates group differences between control and treated samples.
Raw Data
- Native instrument files (e.g., .d from timsTOF, Orbitrap RAW) with acquisition logs.
Processed Quantitative Tables
- Protein- and peptide-level intensity or LFQ matrices.
- PTM site tables with localization probabilities (if applicable).
Spectral Libraries (if required)
- Library-free or hybrid libraries generated during the project.
Quality Control Pack
- Summary of identification depth, CV distributions, missing values, retention time and ion mobility stability.
Bioinformatics & Reporting
- Statistical analysis results (differential expression, clustering, PCA/UMAP).
- Pathway enrichment and biological interpretation (GO, KEGG, Reactome).
- Publication-ready figures (volcano plots, heatmaps, pathway diagrams).