Peptide Mapping Service
Explore your protein peptide map with our advanced LC-MS/MS technology, you can get a fast, reproducible, quantitative evaluation of product-specific attributes.
Submit Your Request Now
×- What Is Peptide Mapping
- Serives
- Workflow
- Technical Platforms
- Advantages
- Applications
- Demo
- FAQs
- Case
- Sample Requirements
Peptide mapping, a technique based on the coupling of liquid chromatography and mass spectrometry (LC-MS), serves as a method for identifying and quantitatively analyzing peptides (short amino acid sequences) in complex samples. This analytical approach involves the separation, identification, and quantification of peptide molecules within a sample, thereby offering insights into the composition, abundance, and structural information of peptides present. Peptide mapping finds crucial applications in fields such as biological research, clinical diagnostics, and drug development. It aids researchers in understanding processes such as protein degradation, modifications, and interactions, as well as in discovering new biomarkers or drug targets.
What Is Peptide Mapping
Peptide mapping represents a primary technique for determining the primary structure (amino acid sequence) of proteins. Moreover, it serves as a vital means for quality control of protein peptide-based drugs, contributing to drug development and the entire production process. Not only can it facilitate comparisons between recombinant and native protein outcomes, assess post-translational modifications in recombinant products, and identify variations in unknown amino acids, but it also allows for the comparison of peptide maps from different batches of products to validate the stability of the manufacturing process. Therefore, in the realm of protein-based drugs, peptide mapping carries significant importance for structural studies and attribute identification, establishing itself as a routine criterion for quality control in protein peptide-based drug standards. For recombinant protein drugs, such as monoclonal antibodies (mAbs) and antibody-drug conjugates (ADCs), peptide mapping plays roles in identification, primary structural characterization, and quality assurance/quality control (QA/QC). Several global regulatory agencies, including the U.S. Food and Drug Administration and the European Medicines Agency (EMA), have formulated guidelines mandating the submission of peptide maps to confirm the amino acid sequence of active pharmaceutical ingredients.
Peptide Mapping Service at Creative Proteomics
At Creative Proteomics, we have developed a liquid chromatography with tandem mass spectrometry (LC-MS/MS)-based peptide mapping platform for confirmation of protein primary structure. And we can provide the peptide mapping mass spectrometry service to analyze the sequence of biopharmaceuticals and confirm complete expression of recombinant protein in compliance with ICH Q6B. As peptide mapping service compares the peptide masses with protein databases, only proteins from the database can be identified using this method. Proteins, whose sequence is not found in a protein database, such as antibodies or novel proteins, can be deduced by our service of de-novo sequencing.
Services Content
Our peptide mapping service can help clients to comply with ICH Q6B guidelines in support of marketing applications. Our peptide mapping service, based on UPLC-MS/MS technology, offers the following capabilities:
- Confirmation of the primary structure of proteins (amino acid sequence, including N-terminal and C-terminal)
- peptide modification services:Identification of modification sites and their proportions on proteins, such as deamidation, oxidation, N-terminal pyroglutamic acid, C-terminal lysine clipping, and glycosylation.
- Qualitative and quantitative information about protein degradation products
- Glycopeptide analysis for identifying glycosylation sites
- Reductive and non-reductive peptide mapping to characterize disulfide bond connections.
Reports
- Experiment procedures
- Parameters of liquid chromatography and mass spectrometer
- MS raw data files
- Bioinformatics analysis
- Peptide mapping results
Peptide Mapping workflow
- Sample Preparation
- Reduction and Alkylation of Proteins: This step aims to reduce disulfide bonds in proteins while preventing the generation of free thiols through alkylation. Reducing disulfide bonds helps to open up the protein's structure, facilitating more efficient enzymatic digestion of proteins. For proteins with interchain disulfide bonds (e.g., monoclonal antibodies), this step also disrupts interchain linkages.
- Enzymatic Digestion of Proteins:Specific enzymes are used to break down proteins into peptide fragments. The choice of enzyme is based on the theoretical protein sequence and enzymatic digestion knowledge. Strategic enzyme selection achieves optimal results for peptide mapping analysis.
- Peptide Mapping and Glycopeptide Analysis:Enzymatically digested peptides are analyzed using online reversed-phase high-performance liquid chromatography (RP-HPLC) coupled with a UV detector. Peptides are separated based on polarity using liquid chromatography (reversed-phase). In the mass spectrometer, mass information for each eluted peptide fragment is generated.
- Mass Spectrometry Analysis:Mass spectrometer generates mass spectrometry data for peptide fragments, including mass and fragmentation information. Fragment ion information is used to determine the amino acid sequence of peptide fragments. Mass spectrometry analysis can be performed using either selective tandem mass spectrometry (MS/MS) or non-selective tandem mass spectrometry (MSe), depending on research requirements.
- Data Analysis:Mass spectrometry data is processed and interpreted using specialized software. Confirmation of peptide amino acid sequences and possible modifications is achieved by comparing the data with known peptide databases.
- Quantitative Analysis:Using the mass spectrometer's quantitative modes (such as MRM or SIM), the abundance of target peptides is quantified. Quantitative analysis is performed based on standard curves or internal standards.
- Interpretation of Results:Combining data analysis and quantitative results provides information about the composition, structure, and abundance of peptide molecules in the sample. Comparison with other samples allows for assessment of similarities, differences, and equivalencies.
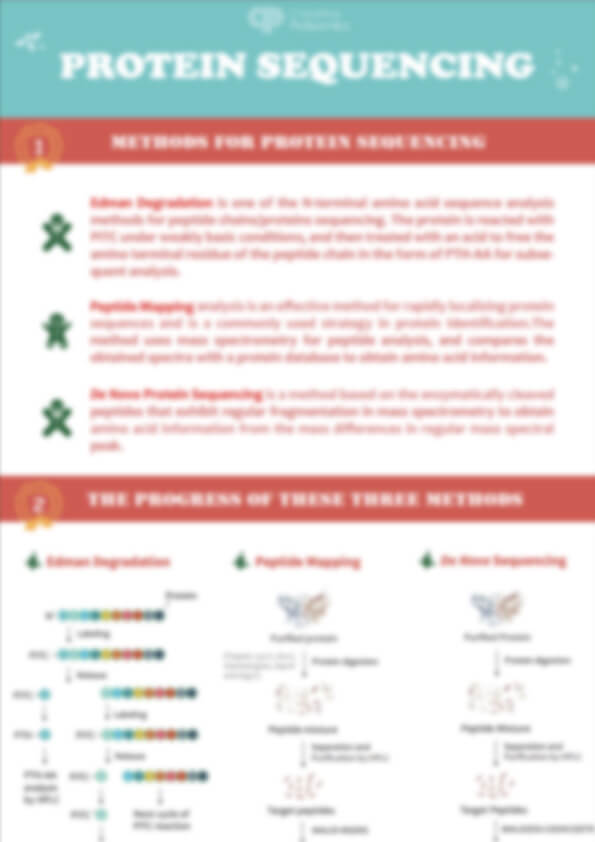
 Principle and process of peptide mapping analysis
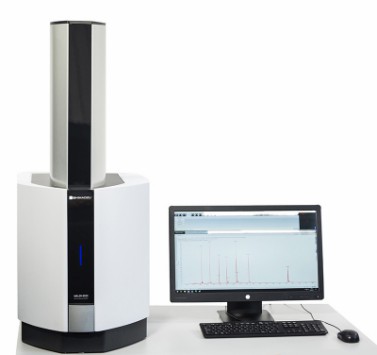
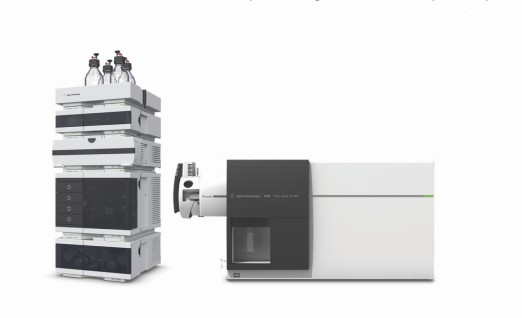
Technical Platforms
Our Advantages
- Various types of proteases used to achieve coverage of 100%, such as trypsin, chymotrypsin, Asp-N, Glu-C, Lys-C, and Lys-N.
- Professional peptide mapping platform including advanced instrument and software.
- Protein sample 100% sequence validation service.
- Delivery of detailed report in a fast turnaround time.
- Quantitative detection limit for amino acid mutation sites is achieved down to 0.1%.
- Translationally modified types and quantitative results can be provided.
Appliacations and Significance of Peptide Mapping
Confirmation of Amino Acid Sequence
Peptide mapping serves to affirm the amino acid sequence of the protein. By pinpointing the masses of the produced peptides, one can ascertain the accuracy and integrity of the sequence.
Unveiling Post-Translational Modifications (PTMs)
This method accurately identifies a spectrum of modifications appended to the protein, encompassing phosphorylation, glycosylation, acetylation, methylation, and more. Precise localization and classification of modifications unveil functional roles and possible implications.
Exploration of Disulfide Bond Arrangement
By elucidating the presence and configuration of disulfide bonds, deeper insights into the protein's higher-order structure and stability are gained.
Comprehensive N-Terminal and C-Terminal Verification
Techniques such as computer-assisted molecular design, peptide synthesis, and recombinant production enable more precise identification and development of active peptides, allowing for targeted therapeutic applications.
Understanding Protein and Peptide Structures through Enzymatic Peptide Mapping
Peptide mapping mass spectrometry analysis is based on the characteristics of protein and peptide molecular weight and amino acid composition. It involves the use of highly specific proteolytic enzymes (typically endopeptidases) to cleave peptides at specific peptide bond sites, resulting in fragment patterns that form characteristic fingerprints. For in-depth analysis of enzymatic digested peptide samples, a high-resolution, sensitive, and accurate mass spectrometer is essential. High-resolution mass spectrometry provides high-quality primary and secondary spectra for enzymatic fragments. Specialized software enables rapid, accurate, and in-depth analysis of peptide mapping data. Certain proteolytic enzymes can cleave protein backbones, usually acting on specific amino acid residues, such as:
| Enzyme | Specificity | Characteristics |
|---|---|---|
| Trypsin | Acts on the carboxyl side of lysine (K) and arginine (R) | Generates an average of one peptide per 10-12 amino acids. Trypsin is the most commonly used protease for protein digestion. |
| Lys-C | Acts on the carboxyl side of lysine (K) | Can generate 60-70% of peptides that trypsin would produce in protein digestion. Lys-C's advantage is its ability to maintain activity in up to 4M urea concentration. |
| Staphylococcus aureus V8 Protease (Glu-C) | Acts on the carboxyl side of aspartic acid (D) and glutamic acid (E) | Provides complementary information to trypsin digestion. |
| Asp-N | Acts on the amino side of aspartic acid (D) | Provides complementary information to trypsin digestion. |
Demo
Peptide Mapping FAQs
Why does the same peptide segment appear at different retention times in a UPLC peptide mass map?
Different retention times may occur due to peptide isomerization, where the molecular weight remains the same, but polarity differs, leading to variation in retention times. Additionally, high peptide abundance may result in longer retention times and peak tailing.
Will the self-cleavage peaks of proteases appear on the peptide mass map?
The amount of protease used is typically 1/50 of the protein amount, so its self-cleavage peaks generally have negligible impact on the peptide peaks observed in the mass spectrum.
How reproducible is the UPLC peptide mass map experiment? Can samples be compared with controls?
The experiment shows good reproducibility, allowing comparison with standards to assess peak number and retention time consistency. For optimal results, samples and controls should undergo enzymatic digestion and liquid-phase detection together. If digestion is performed at different times or with different batches, minor differences may arise, mainly due to the difficulty in controlling enzymatic digestion.
What are the differences between LC-MS and LC-MS/MS?
LC-MS and LC-MS/MS both utilize liquid chromatography (LC) for sample separation, with flexibility in column and mobile phase selection. LC-MS relies on single-stage mass spectrometry to provide m/z information for preliminary identification and quantification. In contrast, LC-MS/MS employs tandem mass spectrometry (MS1 and MS2), offering detailed fragment ion data for more accurate identification and structural analysis, making it particularly suited for in-depth qualitative studies.
Learn about other Q&A about other technologies.
Peptide Mapping Case study

Addressing common challenges of biotherapeutic protein peptide mapping using recombinant trypsin
Journal: J Pharm Biomed Anal
Published: 2024
- Background
- Results
This study evaluates a novel recombinant trypsin, which eliminates these drawbacks by offering enhanced specificity, minimal autoproteolysis, and high activity. The research demonstrates its suitability for large-scale digestion, improving peptide mapping efficiency and enabling effective PTM analysis.
Non-specific cleavage activity in MS-grade trypsins
The study examined how well MS-grade trypsins (commonly used enzymes for protein analysis) maintained cleavage specificity during digestion of a model antibody protein. At low trypsin-to-protein ratios (1:50–1:100), the trypsins performed well with minimal non-specific cleavages. However, increasing the ratio to 1:10 led to a significant rise in non-specific cleavages and degradation of target peptides, complicating protein analysis.
 Fig. 1. Non-specific cleavages in MS-grade trypsin digests.
Development and characterization of the novel recombinant trypsin
To address the issues with traditional MS-grade trypsins, a novel recombinant trypsin was developed using advanced genetic and production methods. This trypsin, expressed in yeast (Pichia pastoris), eliminated contamination with chymotrypsin and showed improved cleavage specificity and stability. The production process included enhanced purification, methylation for autoproteolytic resistance, and rigorous quality control to ensure enzyme reliability and reproducibility. Tests demonstrated that this recombinant trypsin avoided non-specific cleavages even at high trypsin-to-protein ratios (1:10), resolved problems with tryptic autoproteolysis, and worked effectively under various conditions, including conventional digestion buffers and long-term storage.
 Fig. 2. Cleavage specificity of the novel trypsin.
Cleavage specificity and autoproteolytic resistance of novel recombinant trypsin
The novel trypsin was compared to MS-grade trypsins regarding cleavage specificity and resistance to self-degradation (autoproteolysis). The novel trypsin showed no increase in non-specific cleavages regardless of the enzyme amount used, unlike MS-grade trypsins. It also exhibited a remarkable reduction in autoproteolytic peptide generation, both before and during digestion. This improvement resulted from an optimized methylation process, which provided the novel trypsin with superior stability and minimal byproducts, making it highly suitable for accurate protein analysis.
Sample Requirements
| Sample type | Recommended sample size | |
|---|---|---|
| Animal tissues | Hard tissues (bones, hair) | 300-500mg |
| Soft tissues (leaves, flowers of woody plants, herbaceous plants, algae, ferns) | 200mg | |
| Plant tissues | Hard tissues (roots, bark, branches, seeds, etc.) | 3-5g |
| Microbes | Common bacteria, fungal cells (cell pellets) | 100μL |
| cells | Suspension/adherent cultured cells (cell count/pellet) | >1*107 |
| Fluids | Plasma/serum/cerebrospinal fluid (without depletion of high abundance proteins) | 20μL |
| Plasma/serum/cerebrospinal fluid (with depletion of high abundance proteins) | 100μL | |
| Follicular fluid | 200μL | |
| Lymph, synovial fluid, puncture fluid, ascites | 5mL | |
| Others | Saliva/tears/milk | 3-5mL |
| Culture supernatant (serum-free medium cannot be used) | 20mL | |
| Pure protein (best buffer is 8MUrea) | 300μg | |
| FFPE | Each slice: 10µm thickness, 1.5×2cm area | 15-20 slices |


