
What Is Large-Scale Protein Identification?
Large-scale protein identification is the unbiased, system-wide cataloging of proteins present in a biological sample using high-resolution liquid chromatography-tandem mass spectrometry (LC-MS/MS). Unlike targeted proteomics that measures a predefined list, this method asks: what proteins are actually here?
We apply a "bottom-up" proteomics strategy: proteins are digested into peptides with trypsin, separated by nano-LC, and analyzed by high-resolution MS/MS in data-independent acquisition (DIA) mode. Each peptide's fragmentation pattern is matched against protein sequence databases, identifying thousands of proteins in a single experiment.
This approach is the essential first step for biomarker discovery, mechanism research, and any project where the proteome landscape is unknown.
Content Guide
- Why Large-Scale ID?
- How DIA Powers Deep Identification
- DIA vs DDA
- Why Creative Proteomics
- Workflow
- Platforms & Methods
- Sample Requirements
- Deliverables
Why Large-Scale Protein Identification Matters
Protein abundance can span more than six orders of magnitude in a single sample. High-abundance proteins dominate the signal, while low-abundance regulators, signaling molecules, and disease-associated biomarkers remain hidden in standard DDA workflows that selectively fragment only the most intense precursors.
Large-scale DIA-based identification changes this equation. By systematically fragmenting all precursors across defined mass windows, it captures proteins across the full dynamic range — including those that conventional methods miss.
When to Choose Large-Scale Protein Identification
- Biomarker discovery studies requiring unbiased, comprehensive proteome profiling across disease vs. control cohorts.
- Mechanism-of-action research where you need to map global protein expression changes following treatment, knockout, or stimulation — including large-scale phosphoproteomics.
- Non-model organisms with limited or no existing spectral libraries — library-free DIA workflows provide deep coverage without prior knowledge.
- Complex sample matrices such as plasma, FFPE tissues, or primary cells where high-abundance proteins mask biologically relevant signals.
- Multi-batch cohort studies requiring reproducible identification across dozens or hundreds of samples.
How DIA Powers Deep Protein Identification
Data-independent acquisition captures every detectable peptide — no more stochastic precursor selection.

Complete Precursor Coverage
DIA fragments all peptides within defined m/z windows rather than selecting only the most intense signals, ensuring low-abundance proteins are not overlooked.

High Reproducibility Across Runs
Systematic acquisition eliminates run-to-run precursor selection variability, producing consistent protein identifications that support robust statistical comparisons across large sample sets.

Retrospective Data Mining
DIA data archives contain fragmentation spectra for all detectable peptides, allowing re-analysis against updated databases or new biological questions without re-running samples.

Deep Dynamic Range
Narrow precursor mass range strategies and gas-phase fractionation (GPF) further increase identification depth, revealing proteins across 5–6 orders of magnitude in abundance.

Library-Free or Hybrid Approaches
Projects can start immediately in library-free mode for model organisms, with the option to build sample-specific hybrid spectral libraries for deeper coverage in specialized applications.

Seamless Discovery-to-Validation Path
Proteins identified in discovery can be directly transitioned into targeted PRM/MRM panels for validation, biomarker qualification, or absolute quantification — all from the same platform.
DIA vs DDA — Which Acquisition Strategy for Protein Identification?
Your choice of acquisition method directly determines how many proteins you identify and how reproducible your data will be.
| Dimension | DDA (Data-Dependent Acquisition) | DIA (Data-Independent Acquisition) |
|---|---|---|
| Precursor Selection | Selects top-N most intense precursors per cycle; stochastic | Fragments all precursors within defined m/z windows; systematic |
| Protein Identification Depth | 3,000–5,000 protein groups (typical) | 7,000–9,000+ protein groups (typical) |
| Missing Values | 10–30% across replicates | <5% across replicates |
| Low-Abundance Detection | Limited — low-intensity precursors deprioritized | Strong — all precursors fragmented regardless of intensity |
| Retrospective Mining | No — only selected precursors are recorded | Yes — complete fragmentation archive can be re-analyzed |
| Best For | Library building, PTM discovery, small-scale comparisons | Large-scale identification, cohort studies, biomarker discovery |
Advantages of Our Protein Identification Service

Identification Depth
9,000+ Protein Groups / Run
A single DIA run identifies thousands of proteins, providing comprehensive proteome coverage for discovery projects.

Quantitative Reproducibility
Protein CV ≤10–15%
Consistent identification and quantification across biological replicates and large sample cohorts.

Dynamic Range
5–6 Orders of Magnitude
Detect proteins from abundant housekeeping to low-level signaling molecules in a single experiment.

Data Completeness
<5% Missing Values
DIA's systematic acquisition strategy minimizes missing data points, supporting robust statistical analysis.

Mass Accuracy
1–2 ppm; <1% FDR
High-resolution Orbitrap instruments deliver confident peptide-spectrum matches at stringent false discovery rates.

Sample Flexibility
Cells · Tissue · Plasma · FFPE · Biofluids
Matrix-specific preparation protocols handle the full range of biological sample types.
Step-by-Step Protein Identification Workflow
From sample receipt to data delivery, our workflow is optimized for depth, reproducibility, and clarity at every stage.
We define biological questions, sample types, experimental design, and statistical power requirements. Select DIA with library-free or hybrid library strategies based on your organism and coverage goals.
Matrix-specific lysis and protein extraction. Optional plasma/serum depletion for high-abundance protein removal. Trypsin digestion with S-Trap/SP3 cleanup. QC runs verify digest efficiency.
Peptides are separated by nano-LC and analyzed on high-resolution Orbitrap or timsTOF instruments. DIA systematically fragments all precursors across defined m/z windows, with optional gas-phase fractionation for deeper coverage.
Spectronaut or DIA-NN processes DIA data against species-specific databases. FDR controlled at 1% for PSMs, peptides, and protein groups. Library-free directDIA or hybrid spectral library approaches applied per project needs.
Label-free quantification with normalization, differential expression analysis, clustering, PCA, volcano plots, and pathway enrichment. Quantitation matrices and statistical summaries provided in standard formats.
Raw data files, protein/peptide identification tables, quantitation matrices, QC metrics, differential expression results, pathway enrichment analyses, and report-ready figures delivered in an auditable report.
- Library-free start — no spectral library needed for model organisms
- Hybrid library option for deeper coverage in specialized applications
- Consistent identifications across large sample cohorts
- Expert guidance from study design to biological interpretation
Mass Spectrometry Platforms for Large-Scale Protein Identification
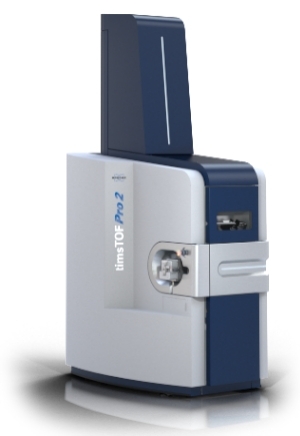
timsTOF Pro / timsTOF Pro 2 (Bruker)
Technology: Trapped Ion Mobility Spectrometry (TIMS) with PASEF acquisition for 4D proteomics.
Acquisition Strategy: diaPASEF for discovery-scale protein identification with ion-mobility-enhanced selectivity.
Key Parameters:
- Sequencing speed > 100 Hz with PASEF
- Ion mobility resolution R ≥ 60 (3 adjustable modes)
- Mass accuracy < 1 ppm (internal), < 2 ppm (external)
Strengths: 4D separation decongests spectra, improves ion utilization, and delivers deeper proteome coverage with fewer missing values.
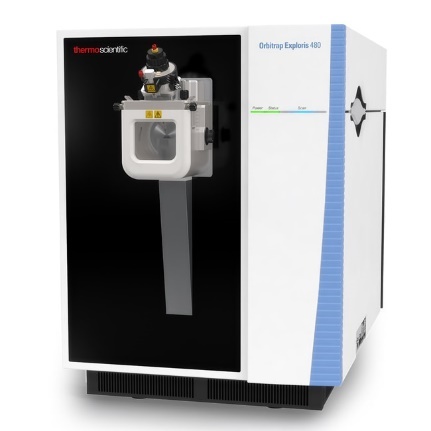
Orbitrap Exploris 480 / Fusion Lumos (Thermo Scientific)
Technology: High-field Orbitrap mass analyzer with quadrupole selection for high-resolution DIA.
Acquisition Strategy: DIA with variable isolation windows optimized for precursor density distribution.
Key Parameters:
- Resolution up to 480,000 at m/z 200
- Mass accuracy < 1 ppm RMS (internal), < 3 ppm RMS (external)
- Spectral dynamic range > 5,000:1
Strengths: Exceptional mass accuracy and stability for cohort-scale protein identification and quantitative discovery.
Our Protein Identification Services Include
- Cell/tissue protein extraction and trypsin digestion
- SDS-PAGE and in-gel trypsin digestion for targeted band analysis
- Histone extraction for epigenetic proteomics
- Plasma/serum protein depletion (optional, for biofluid samples)
- Peptide fractionation for increased proteome depth
- Peptide purification and concentration
- Quality control runs to verify digest efficiency
- LC-MS/MS analysis in DIA quantitative proteomics
- Database search with 1% FDR at PSM, peptide, and protein levels
Protein Identification Sample Requirements
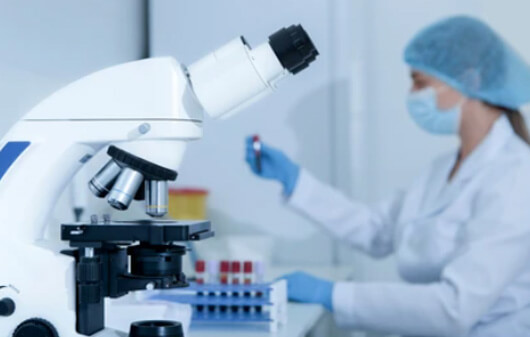
Buffer compatibility: Please avoid strong detergents and high salt in final submissions; we perform cleanup as needed.
QC controls: We incorporate system-suitability standards and recommend biological replicates for robust statistical analysis.
| Sample Type | Recommended Input | Storage & Handling |
|---|---|---|
| Cells | ≥ 1×10⁷ cells | Snap-freeze pellet; avoid detergents and high salt |
| Tissue (fresh/frozen) | ≥ 200 mg (animal) / ≥ 1 g (plant) | Snap-freeze; minimize ischemia time; aliquot to avoid re-freeze |
| FFPE | 2×5 μm slices (each 50–100 mm2) | Store at ambient in low humidity; provide H&E where available |
| Serum/Plasma | ≥ 0.2–0.5 mL | Freeze promptly; avoid repeated freeze–thaw |
| Blood | ≥ 1 mL | Freeze promptly; avoid repeated freeze–thaw |
| Urine | ≥ 2 mL | Clarify via low-speed spin; freeze supernatant |
| Microbes | Dry weight: ≥ 200 mg | Snap-freeze pellet |
Please prepare enough dry ice or ice packs to ensure low temperature during sample transportation.
Contact us for sample feasibility evaluation and study design guidance.
Protein Identification Deliverables
Complete data, auditable QC, and analysis-ready results
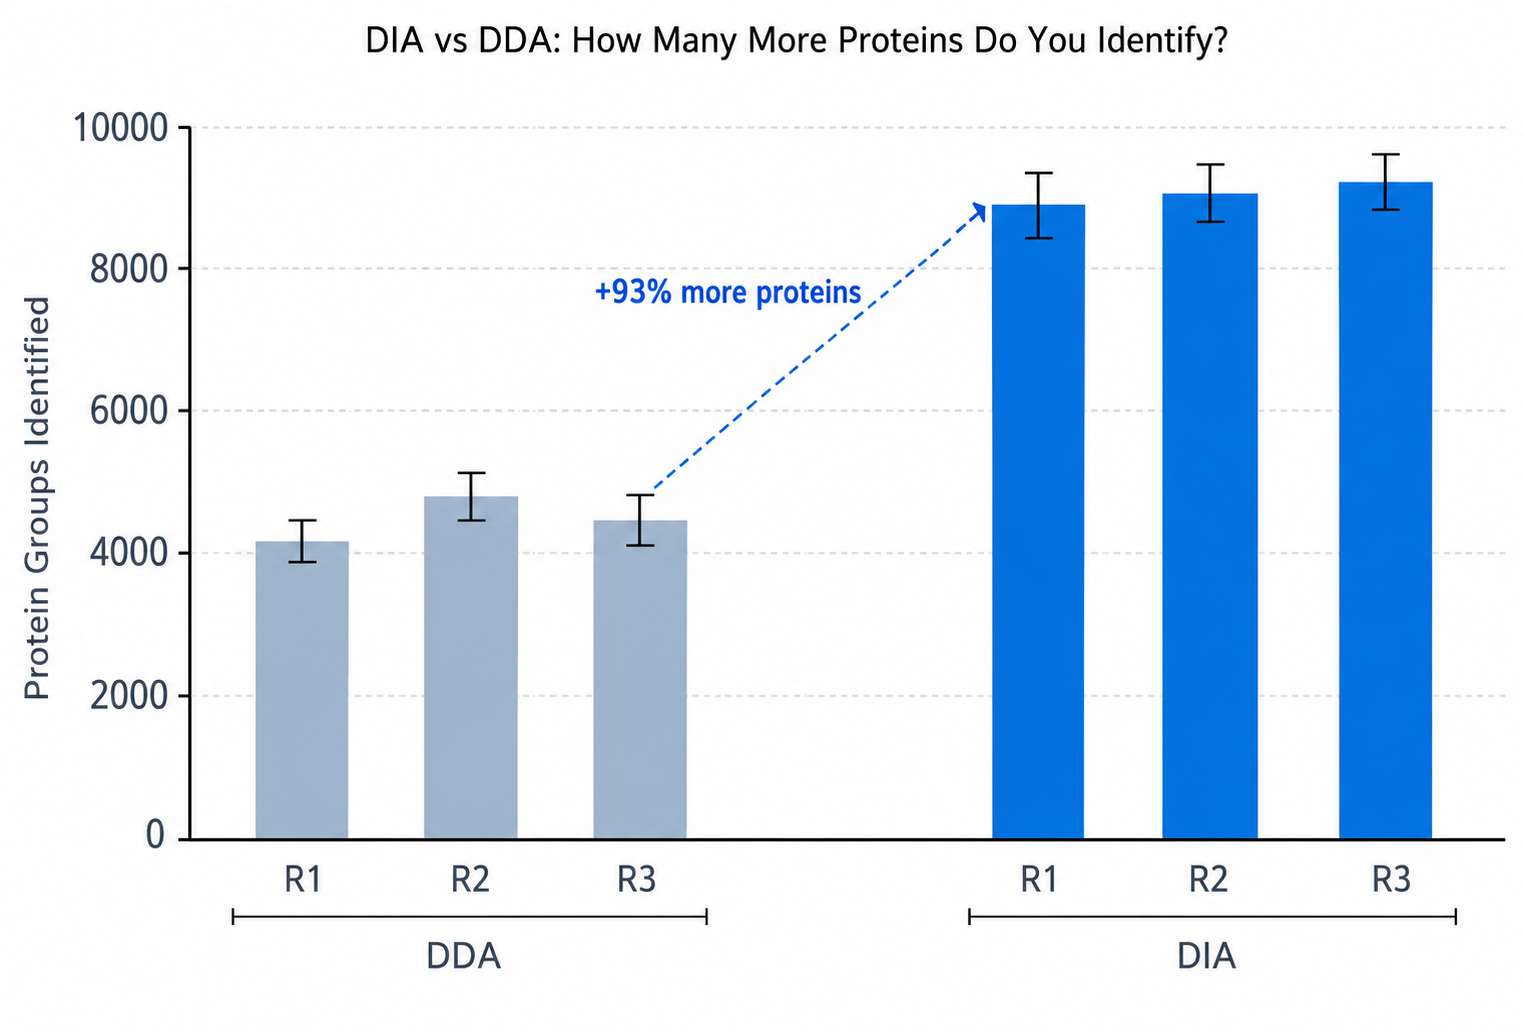
DIA identifies 93% more protein groups than conventional DDA on the same sample, capturing the proteome depth your discovery project needs.
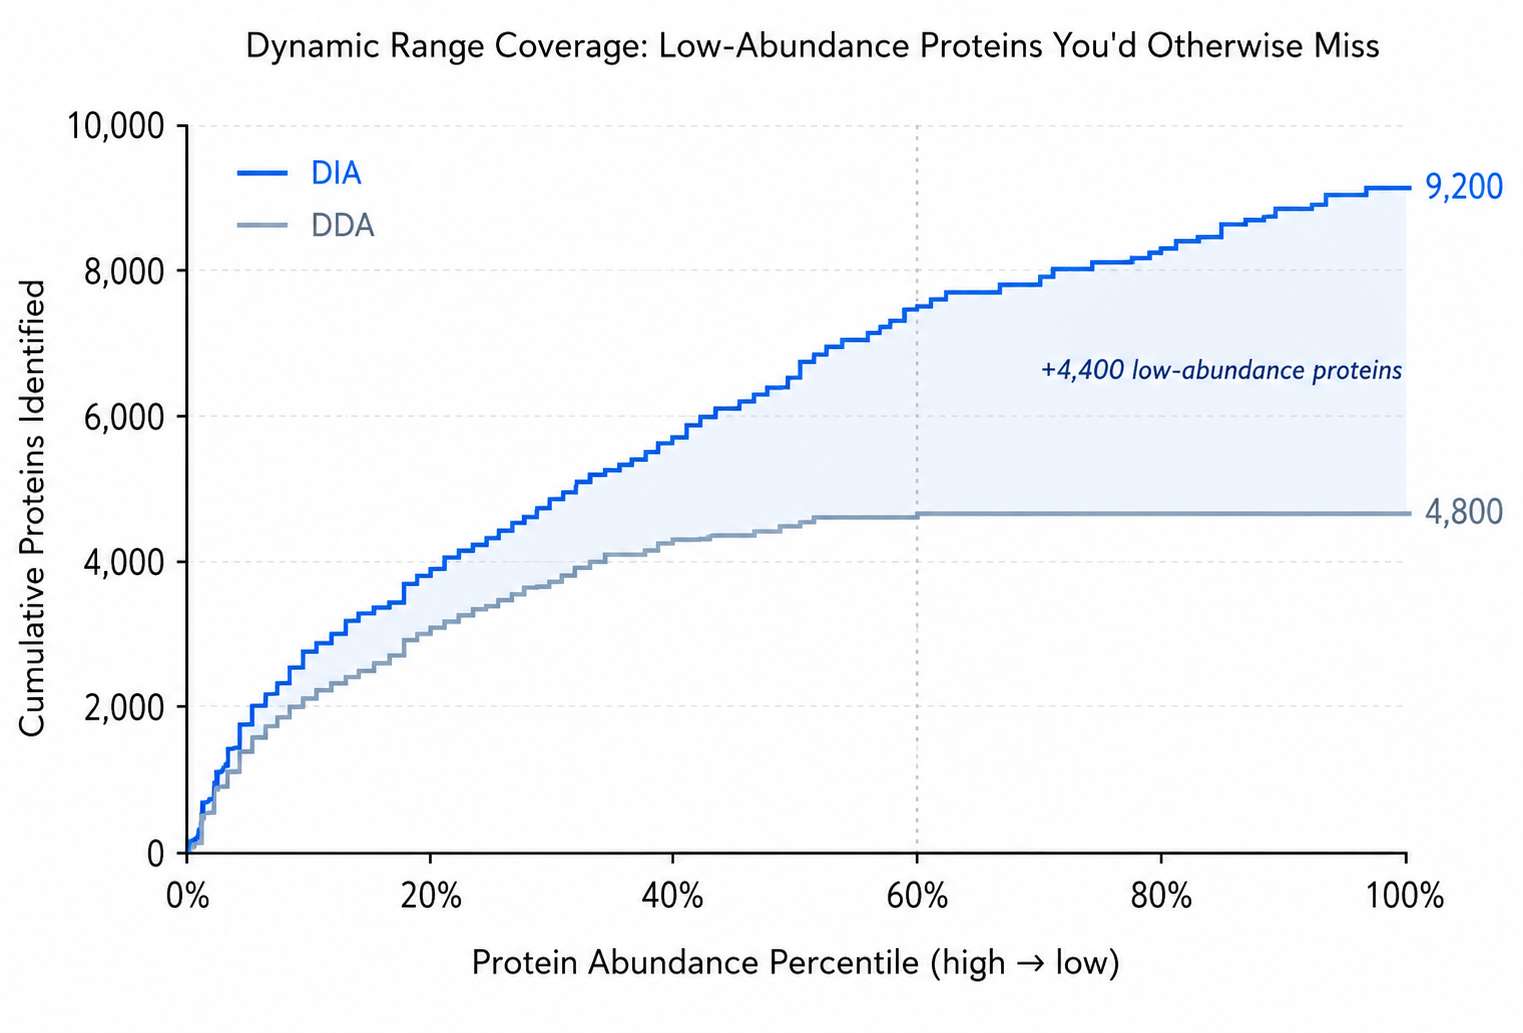
DIA systematically captures proteins across the full abundance range. While DDA plateaus at ~60th percentile, DIA extends deep into the low-abundance zone — adding ~4,400 proteins your current workflow would miss.
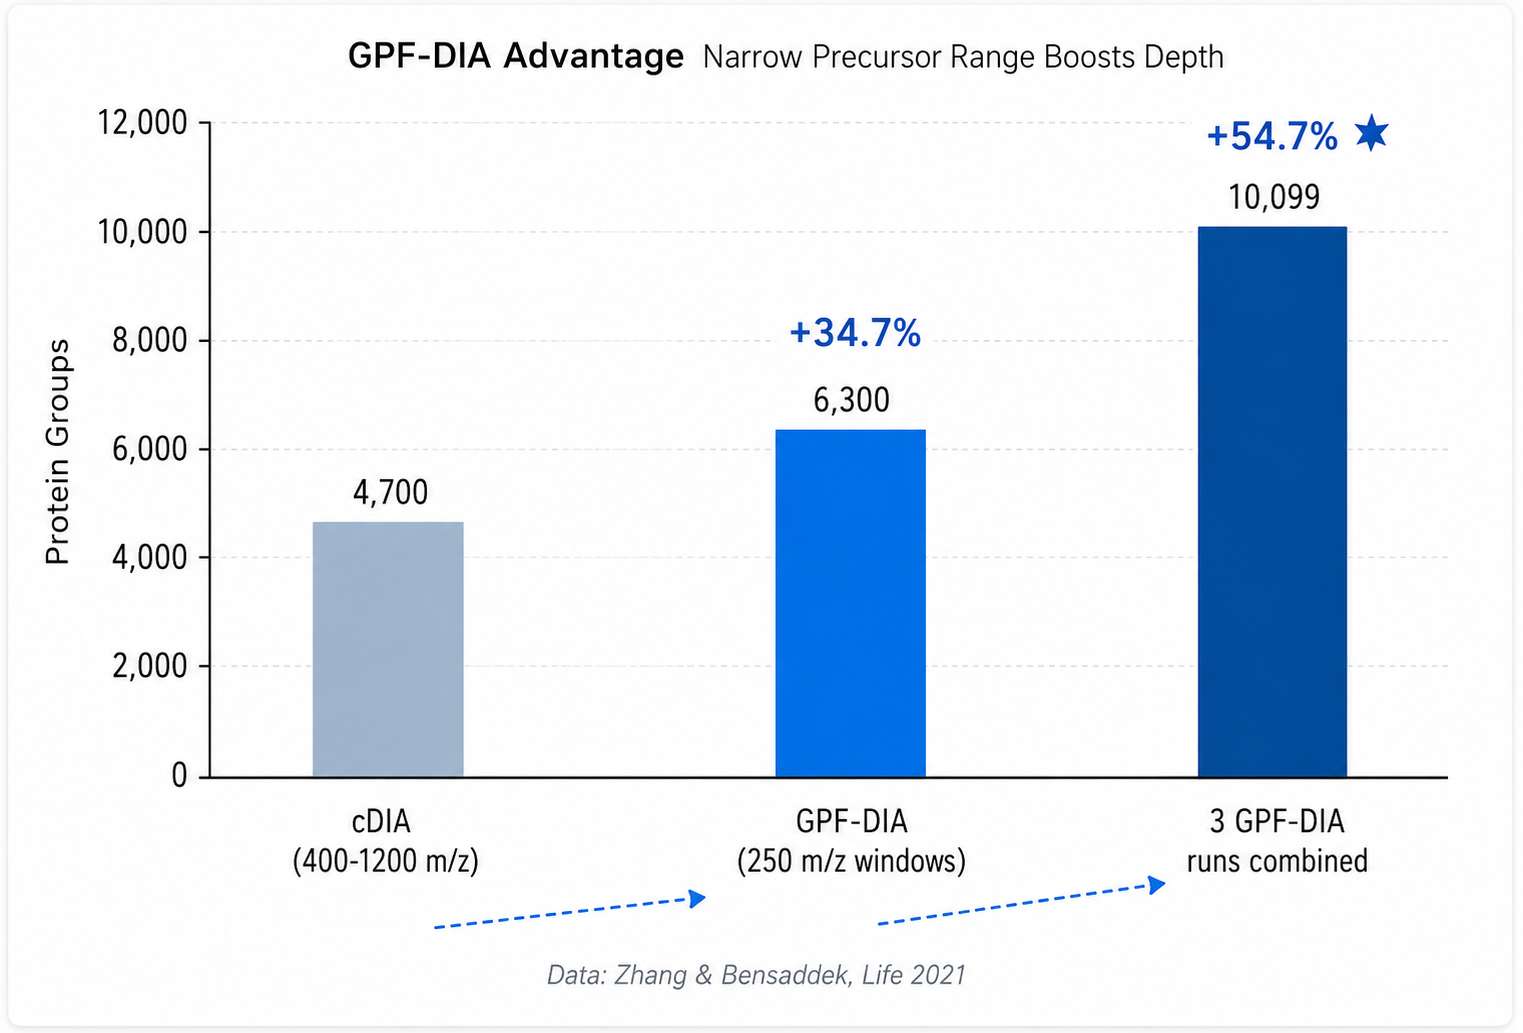
Narrow-precursor-range GPF-DIA identifies 54.7% more protein groups than conventional wide-range DIA — a verified strategy we apply to maximize your proteome coverage.
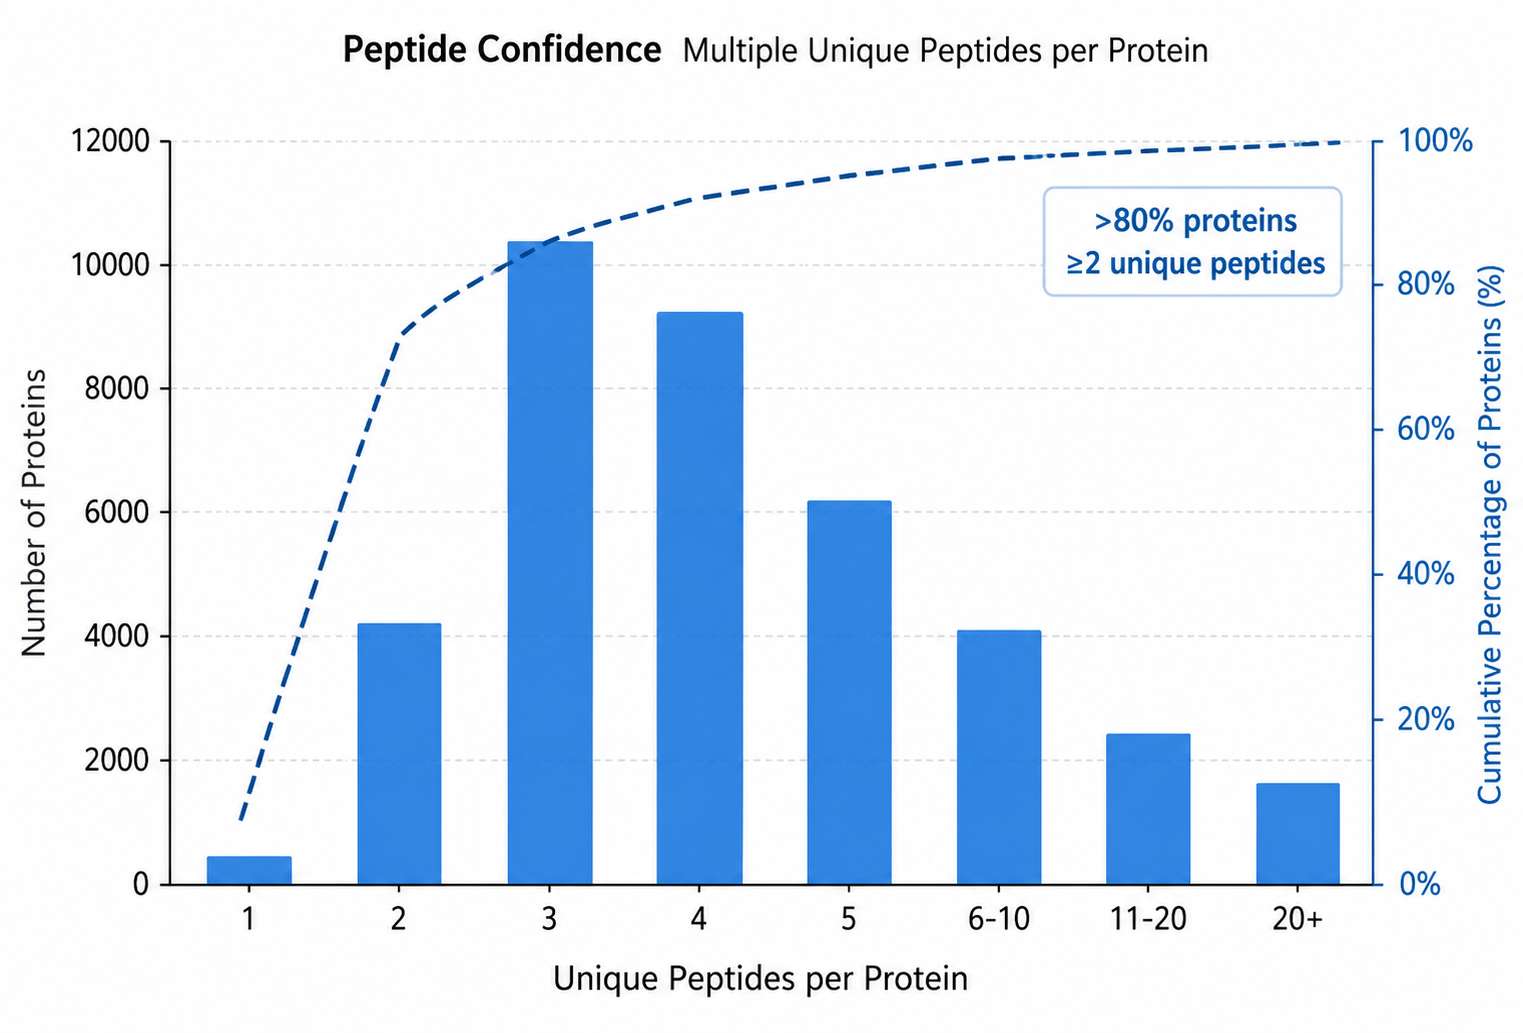
Over 80% of identified proteins are supported by 2 or more unique peptides — giving you the identification confidence needed for downstream validation and publication.
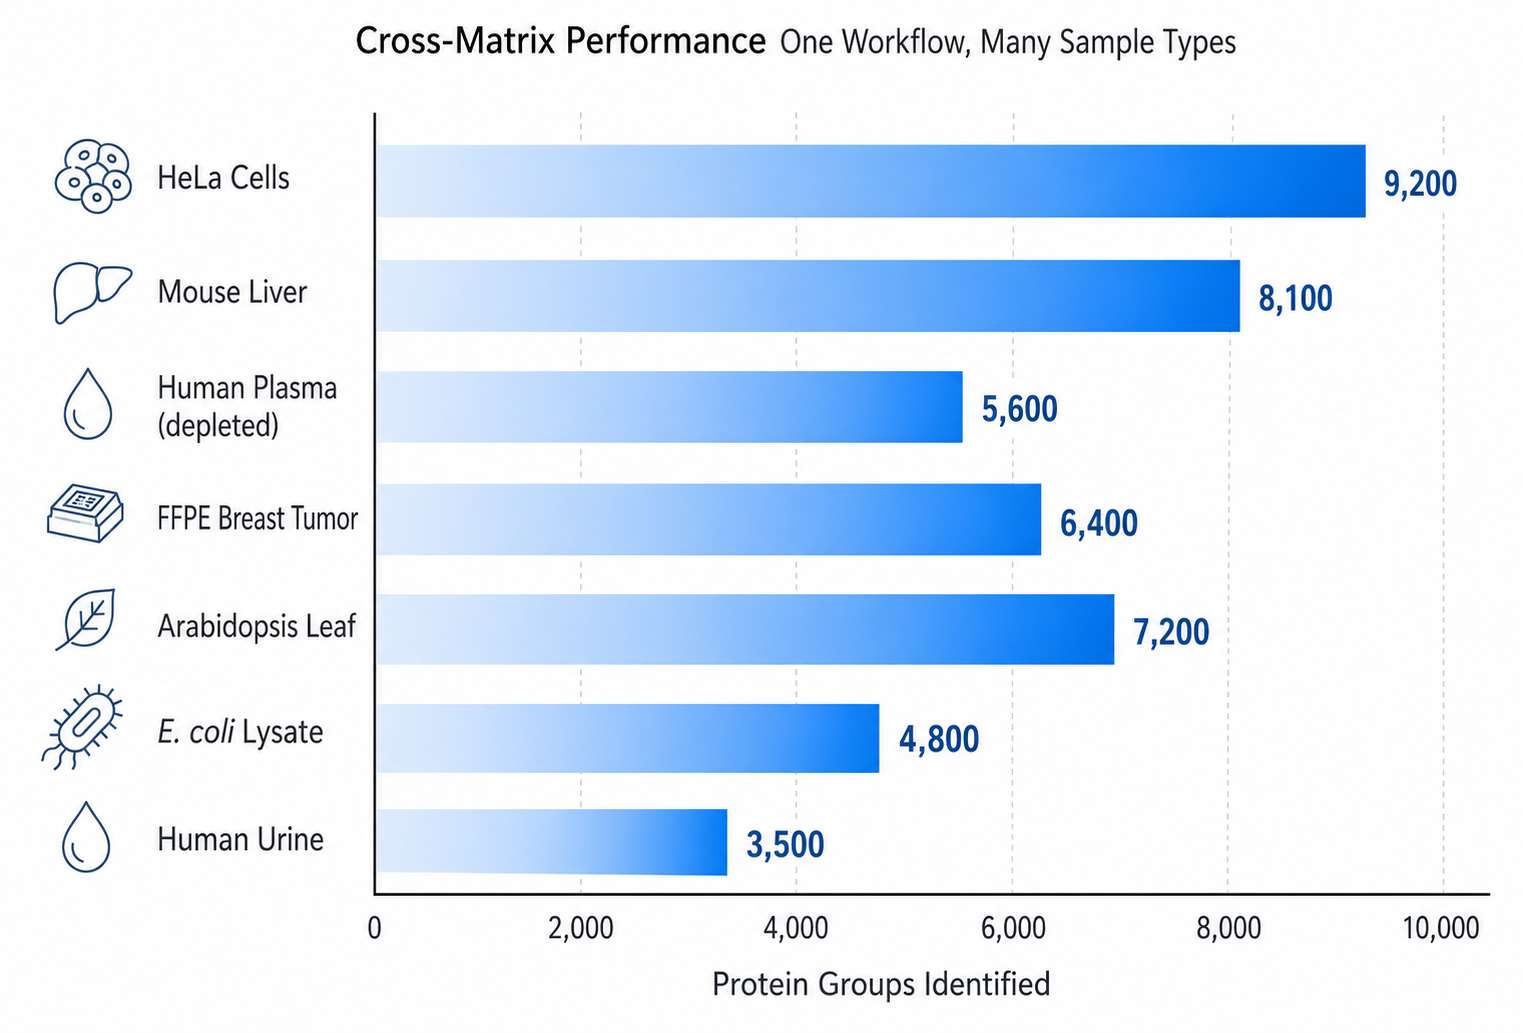
One workflow, many matrices — from cultured cells to FFPE tissue and biofluids, the same DIA platform delivers deep identification across your sample types.
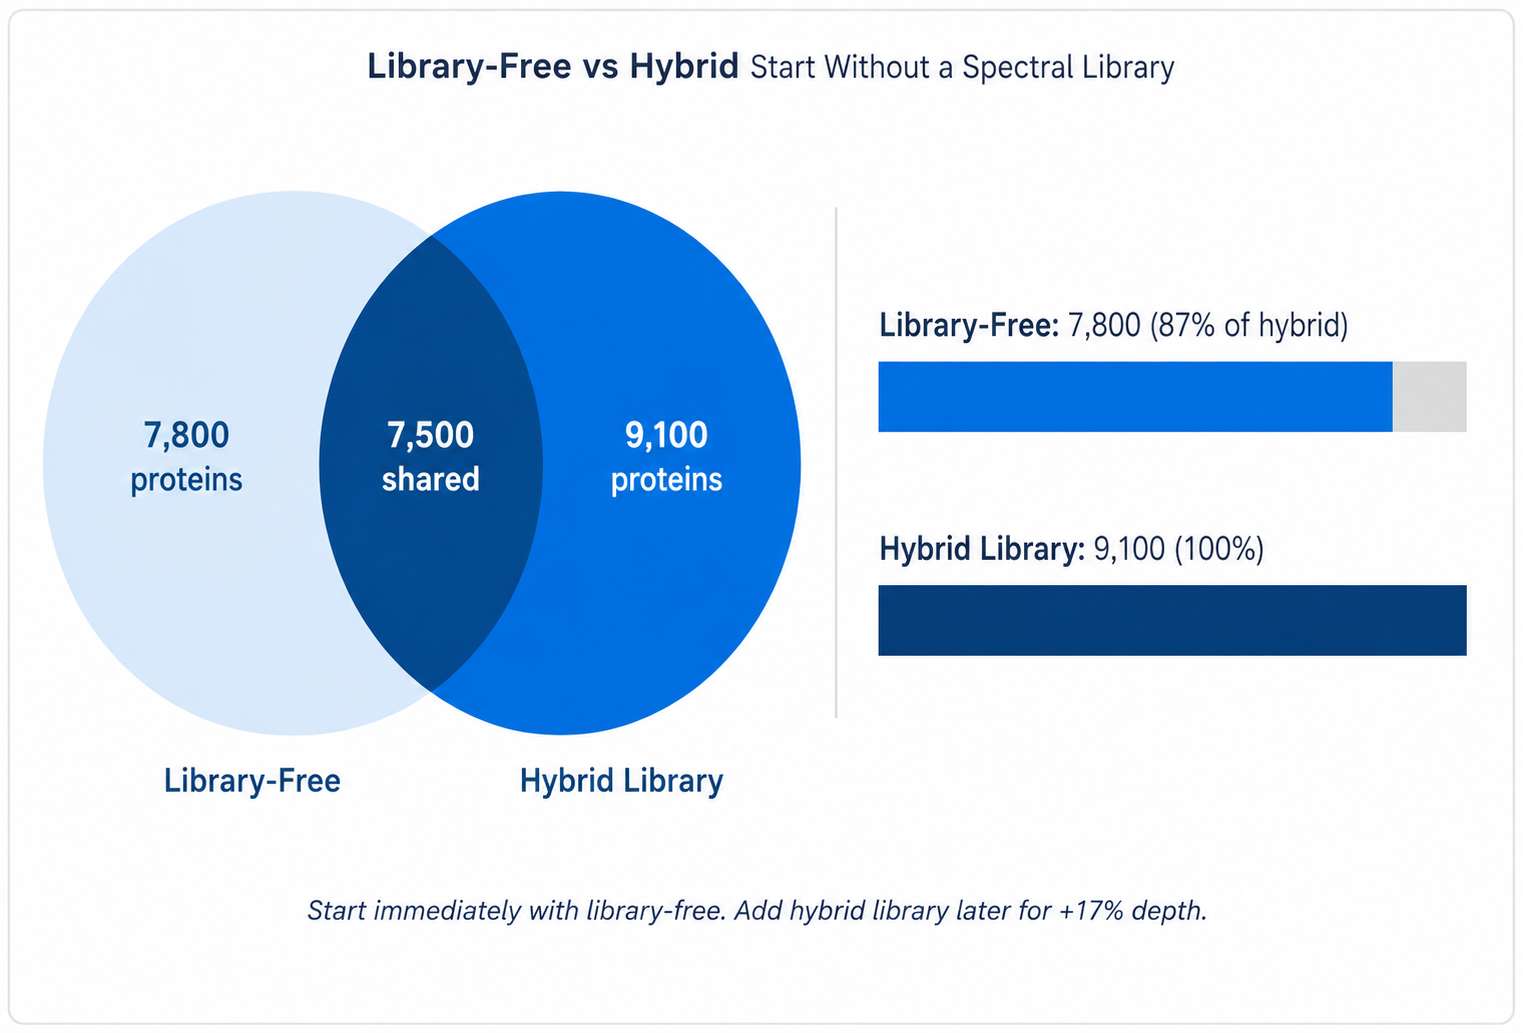
No pre-built spectral library? No problem. Library-free directDIA captures 87% of what a hybrid library achieves — start your project immediately, add depth later.
Standard Deliverables Checklist
- Raw MS data files (.raw or .d format)
- Protein and peptide identification tables (FDR < 1%)
- Label-free quantitation matrix
- Differential expression analysis with statistics
- PCA, hierarchical clustering, volcano plots
- GO, KEGG, and Reactome pathway enrichment
- Protein-protein interaction network analysis
- Complete QC report with instrument performance metrics
- Detailed experimental methods documentation
Large-Scale Protein Identification FAQ
No. Our platform supports library-free directDIA workflows that generate pseudo-MS/MS spectra directly from DIA data, enabling deep protein identification for model organisms without a pre-built library.
For specialized applications or non-model organisms, we can build project-specific hybrid spectral libraries from pooled samples, which typically yields 10–20% more identifications compared to library-free approaches.
We process a wide range of biological matrices: cultured cells, fresh/frozen tissue, FFPE tissue, plasma, serum, urine, CSF, microbial pellets, and plant tissue.
Each matrix has optimized extraction and digestion protocols. For challenging samples such as FFPE or plasma, we offer specialized preparation workflows including antigen retrieval and high-abundance protein depletion to maximize identification depth.
We apply stringent false discovery rate (FDR) control at 1% across all three levels: peptide-spectrum matches (PSMs), peptides, and protein groups. Each identified protein is supported by at least one unique peptide.
System suitability standards (iRT peptides, reference digests) are run with every batch to verify instrument performance before and during acquisition.
Yes. DIA data is inherently retrospective — because all detectable precursors are fragmented and recorded, the raw data can be re-searched against updated protein databases or re-analyzed for different biological questions.
This is a significant advantage over DDA, where only selected precursors are fragmented and the resulting data cannot be retrospectively mined for proteins that were not targeted during acquisition.
Case Study: Narrow Precursor Range DIA Boosts Protein Identification by 54.7%
Challenge
Conventional DIA using a wide precursor mass range (400–1,200 m/z) generates highly complex fragmentation spectra. The density of co-fragmented precursors within each isolation window limits spectral specificity and reduces the total number of confident protein identifications — particularly for low-abundance proteins that contribute weaker fragment ion signals.
Analytical Approach
Zhang and Bensaddek (2021) systematically evaluated the effect of narrowing DIA precursor mass windows from the standard 400–1,200 m/z range to approximately 250 m/z windows. They tested this on Arabidopsis thaliana root cell suspension cultures with six spike-in proteins at known concentrations. A gas-phase fractionation (GPF) strategy was applied by dividing the full mass range into three narrow segments: 400–650, 650–900, and 900–1,200 m/z. Data were processed using Spectronaut Pulsar with both library-based matching and directDIA approaches.
Key Findings
| Metric | Conventional DIA (400–1,200 m/z) | Narrow Range DIA (250 m/z windows) | Improvement |
|---|---|---|---|
| Protein groups (single run) | ~4,700 | ~6,300 | +34.7% |
| Protein groups (3 GPF runs combined) | ~6,500 | 10,099 | +54.7% |
| Median CV | ~8% | <6% | Lower variability |
| Spike-in protein detection | 5 of 6 detected | 6 of 6 detected | Complete low-abundance coverage |
| Quantitation correlation (R²) | >0.9 between methods | — | High consistency |
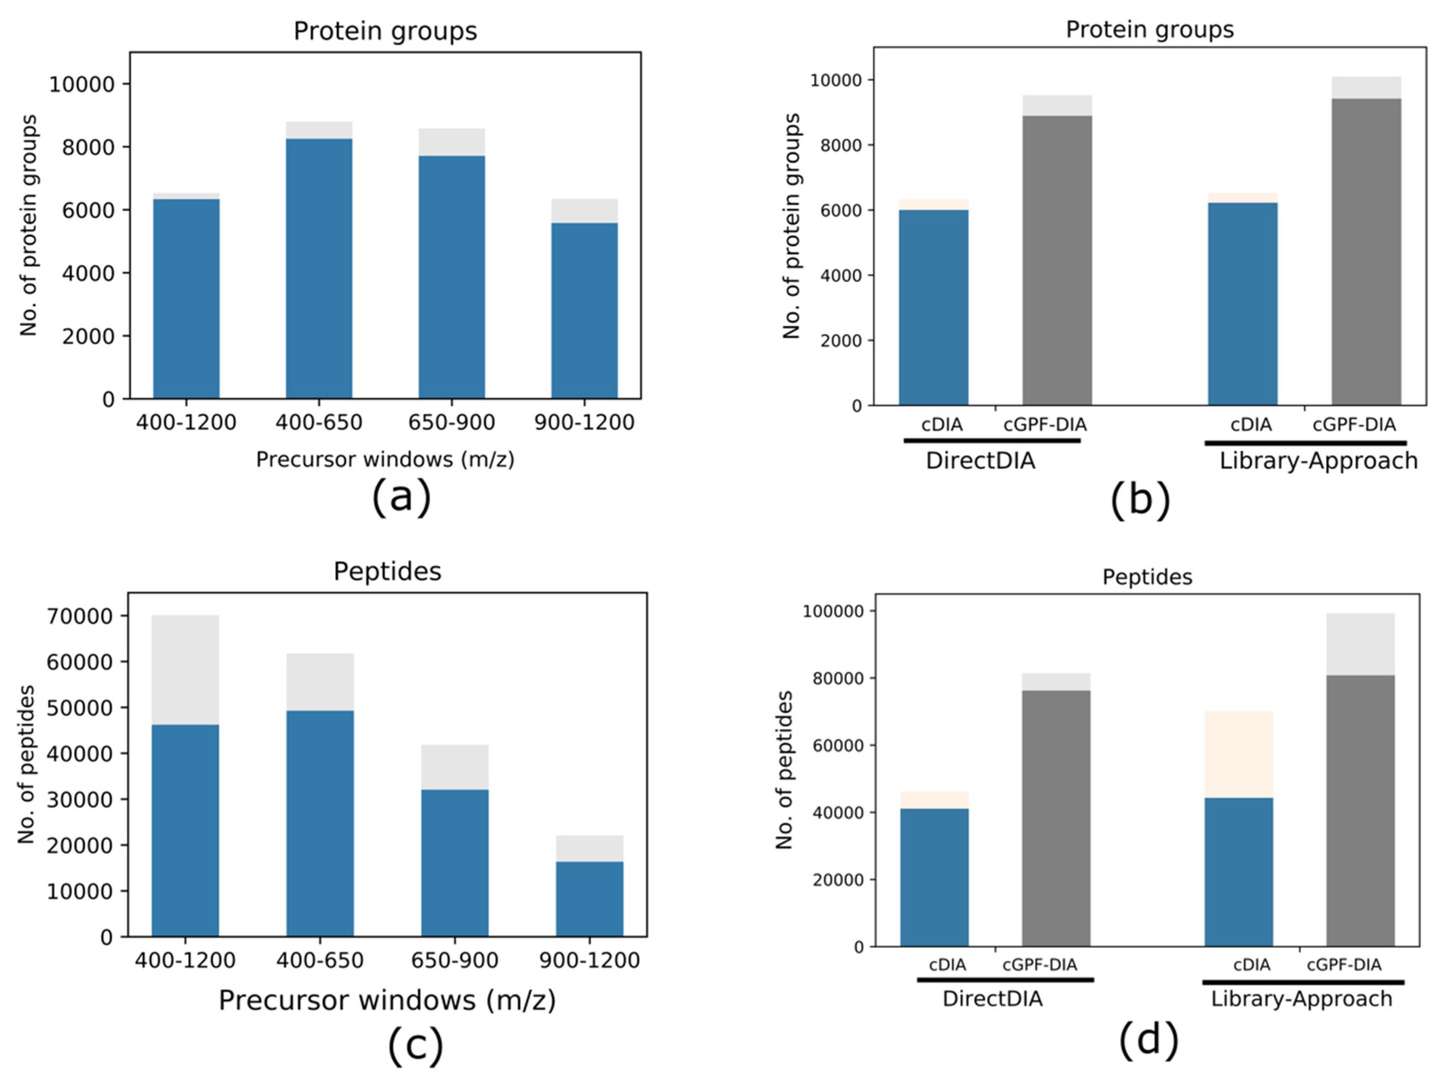
Protein groups and peptides identified from narrow-range GPF-DIA vs. conventional DIA approaches, with each condition run in triplicate.
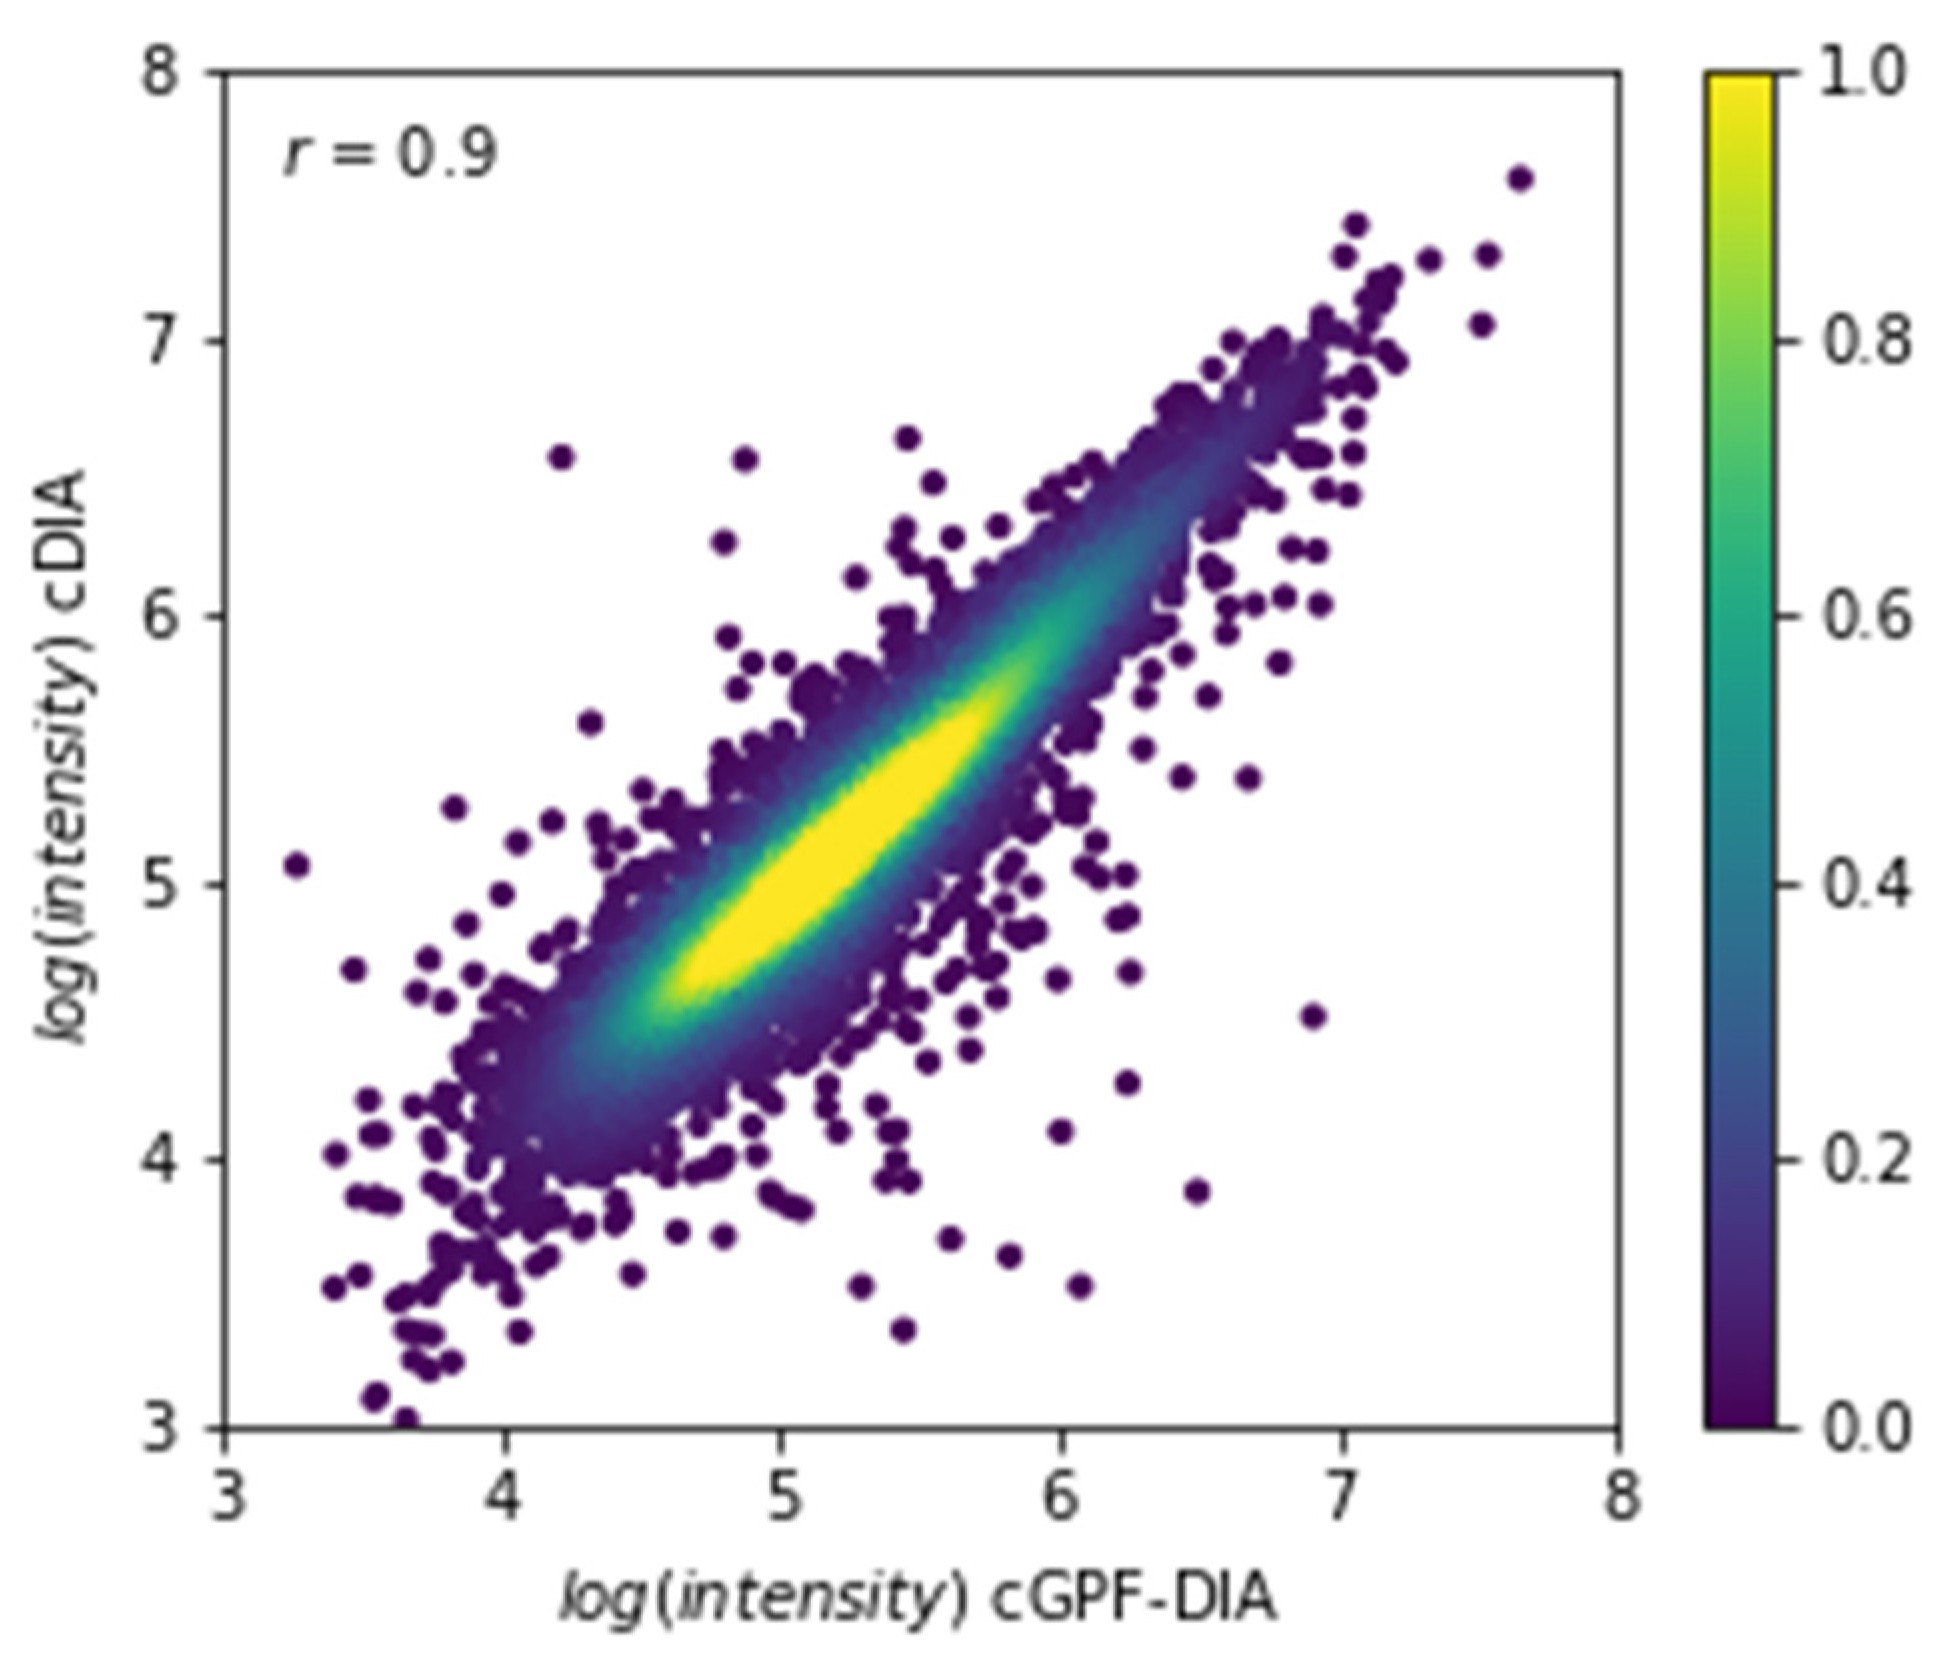
Correlation of quantitative intensities of 6,306 common identifications between conventional DIA and GPF-DIA, showing high consistency (R² > 0.9).
What This Means for Your Protein Identification Project
- 34–55% more proteins identified using narrow precursor mass range DIA compared to conventional wide-range DIA — directly translates to more complete pathway coverage in your study.
- Complete low-abundance protein detection: all six spike-in proteins (representing low-concentration targets) were reliably detected only with the narrow-range approach, demonstrating sensitivity for biologically important low-abundance regulators.
- Lower quantitative variability (median CV < 6% vs. ~8%) means greater statistical power to detect subtle biological differences with fewer replicates.
- High correlation between methods (R² > 0.9) confirms that the additional identifications from narrow-range DIA do not compromise quantitative accuracy — you gain depth without sacrificing data quality.
Conclusion
This study demonstrates that narrowing DIA precursor mass windows is a straightforward, effective strategy to substantially increase protein identification depth without requiring additional sample material. For large-scale protein identification projects — especially those focused on detecting low-abundance proteins or maximizing proteome coverage — narrow precursor range DIA with gas-phase fractionation represents a significant advance over conventional wide-range DIA approaches.
Reference: Zhang H, Bensaddek D. Narrow Precursor Mass Range for DIA–MS Enhances Protein Identification and Quantification in Arabidopsis. Life. 2021;11(9):982. doi:10.3390/life11090982