
Why EV Proteomics Captures What Soluble Proteomics Misses
Extracellular vesicles (EVs) are nano-scale particles released by every cell type, carrying a molecular snapshot of their parent cell — proteins, nucleic acids, lipids. In disease, EV cargo changes early: before cells become morphologically abnormal, before circulating biomarkers rise, before imaging detects a lesion.
This cargo is fundamentally different from the soluble proteome. Membrane receptors, intracellular signaling kinases, organelle-resident proteins, and post-translationally modified proteins are enriched in EVs and depleted in soluble fractions. Over 500 proteins are detectable exclusively in the EV compartment of the same plasma sample — invisible to standard plasma and serum proteomics. For urological cancers, urinary EV proteins approach biopsy sensitivity without invasiveness. For neurodegenerative diseases, plasma EVs carry CNS proteins across the blood-brain barrier from a standard blood draw.
Content Guide
- Why EV Proteomics
- EV Enrichment Methods
- mDIA for EV Proteomics
- EV Characterization & QC
- Service Advantages
- Sample Requirements
- EV Proteomics Applications
- Deliverables
EV Enrichment Strategies — Matched to Your Sample and Research Goal
No single EV enrichment method is optimal for every study. We offer four strategies and recommend the one that aligns with your sample volume, required purity, and downstream application.
| Method | Recovery | Purity | Best For |
|---|---|---|---|
| Size Exclusion Chromatography (SEC) | 60–70% | ★★★★ | High-purity EV proteomics; large cohort biomarker studies requiring standardized, reproducible isolation. Compatible with all biofluids. |
| Lipid Affinity Magnetic Bead Capture | >90% | ★★★★ | Maximum protein yield for deep proteomic coverage; phosphoproteomics and PTM analysis; low-abundance EV protein detection. Suitable for precious, volume-limited samples. |
| Ultracentrifugation (UC) | 20–30% | ★★ | Budget-sensitive pilot studies; compatibility with legacy protocols. Higher co-isolation of non-EV proteins. |
| Polymer-Based Precipitation | >90% | ★★ | Rapid screening and feasibility studies. Note: co-precipitates soluble proteins and may require additional cleanup for quantitative proteomics. |
Multiplexed DIA for EV Proteomics
EV proteins are intrinsically low in abundance — a typical plasma EV preparation yields 1–10 μg of total protein, compared to ~60 mg/mL for whole plasma. Standard label-free DIA can detect EV proteins, but quantification precision suffers when protein amounts are at the lower limit of the method's dynamic range.
Multiplexed DIA (mDIA) addresses this through dimethyl labeling: EV digests from individual samples are chemically labeled with light, medium, or heavy dimethyl tags, then pooled before a single DIA acquisition. Because all samples are analyzed simultaneously in the same LC-MS run, quantitative variability from run-to-run instrument drift is eliminated. The pooled sample also increases total peptide loading, pushing low-abundance EV peptides above the detection threshold.
| Criterion | Label-Free DIA | Multiplexed DIA (mDIA) |
|---|---|---|
| Quantification strategy | Each sample run individually; MS1-level quantitation | Up to 3 samples pooled per run; MS1-level quantitation with dimethyl labels |
| Run-to-run variability | Present; requires normalization | Eliminated within each multiplex set |
| Low-abundance EV protein detection | Limited by individual sample loading | Enhanced by pooled sample loading |
| Throughput | 1 sample per DIA run | Up to 3 samples per DIA run |
| Missing values | Moderate (5–15%) | Low (<5%) due to matched acquisition |
| Best for | Small pilot studies, single-condition profiling | Multi-condition comparisons, biomarker panels, longitudinal EV studies |
EV Characterization and Quality Control
Before proteomic analysis, every EV preparation passes through a three-point quality gate. This ensures the proteomics data reflects genuine EV cargo — not co-isolated plasma proteins, protein aggregates, or cellular debris.
Size & Concentration
Nanoparticle tracking analysis (NTA) quantifies EV particle size distribution and concentration. Typical yields: 1×10⁸ to 1×10¹⁰ particles/mL from plasma; 1×10⁹ to 1×10¹¹ from cell culture supernatant. Particles outside the expected EV range (30–200 nm for small EVs) are flagged.
EV Marker Confirmation
Western blot for canonical EV markers — CD9, CD63, CD81, TSG101 — confirms EV enrichment. Negative markers (calnexin, GM130) are used to rule out cellular contamination. All four positive markers must be detectable before proceeding to proteomics.
Batch-Level QC Metrics
Each batch includes a pooled QC sample processed alongside study samples. NTA and protein yield are tracked across batches. Batches at >2 SD from the batch median are flagged for investigation before MS data is released.
EV Proteomics Service Advantages

Method Flexibility
SEC, lipid affinity beads, polymer precipitation, or UC — matched to your sample type and budget. No vendor lock-in.

mDIA for Low-Abundance EV Proteins
Dimethyl labeling enables multiplexed DIA — higher sensitivity, fewer missing values, and more confident quantification than label-free approaches.

Any Biofluid, Any Species
Plasma, serum, urine, CSF, cell culture supernatant, and other biofluids. Human, mouse, rat, and non-model organisms supported.
EV Sample Collection and Requirements
EV integrity depends on pre-analytical handling. Three rules apply regardless of biofluid source.
Collection & Processing
Collect into sterile tubes without additives. Process within 2 hours — centrifuge at 2,000g × 10 min (4°C) to remove cells and debris, then 10,000g × 30 min to remove large vesicles if small EVs are the target. Aliquot supernatant and store at −80°C.
Freeze-Thaw: Avoid at All Costs
Each freeze-thaw cycle reduces EV particle count by 15–25% and alters the proteome composition — some EV subpopulations are more fragile than others. Aliquot raw biofluid into single-use fractions at first freeze. Never re-freeze a thawed sample intended for EV isolation.
Volume Requirements
Plasma/serum: 500 μL–1 mL (standard), 2 mL (deep). Urine: 10–50 mL. CSF: 500 μL–1 mL. Cell culture supernatant: 10–50 mL. Precious samples: lipid affinity capture maximizes yield from as little as 200 μL plasma. Collection kits and multi-site SOPs available.
EV Proteomics Applications

Oncology Biomarker Discovery
Tumor-derived EVs carry oncogenic proteins (EGFRvIII, mutant KRAS, IDH1-R132H), immune checkpoint molecules (PD-L1), and tissue-specific markers into circulation. EV proteomics captures these directly from plasma or urine — enabling liquid biopsy approaches that detect molecular evidence of cancer without tissue sampling.

Neurodegenerative Disease
Neuron-derived EVs cross the blood-brain barrier and enter peripheral circulation. Plasma EV proteomics can detect CNS-specific proteins — tau, α-synuclein, TDP-43 — without lumbar puncture. For studies combining CSF and blood-based EV analysis, our CSF proteomics service supports matched CSF and plasma EV proteomics from the same patient.

Drug Response & Resistance
EV protein cargo changes within hours of drug treatment — before transcriptional changes, before metabolic adaptation, and long before cell death. Longitudinal EV proteomics during drug treatment captures early pharmacodynamic biomarkers and resistance mechanisms that are invisible to soluble proteomics. Candidate EV biomarkers can be advanced to targeted proteomics validation.

Renal & Urological Disease
Urinary EVs are released directly from kidney, bladder, and prostate epithelium — providing a noninvasive molecular readout of urogenital tissue health. For prostate cancer, DRE-enriched EV proteomics captures tissue-derived biomarkers at concentrations exceeding soluble urine fractions.
EV Proteomics Deliverables
From EV isolation to biological interpretation
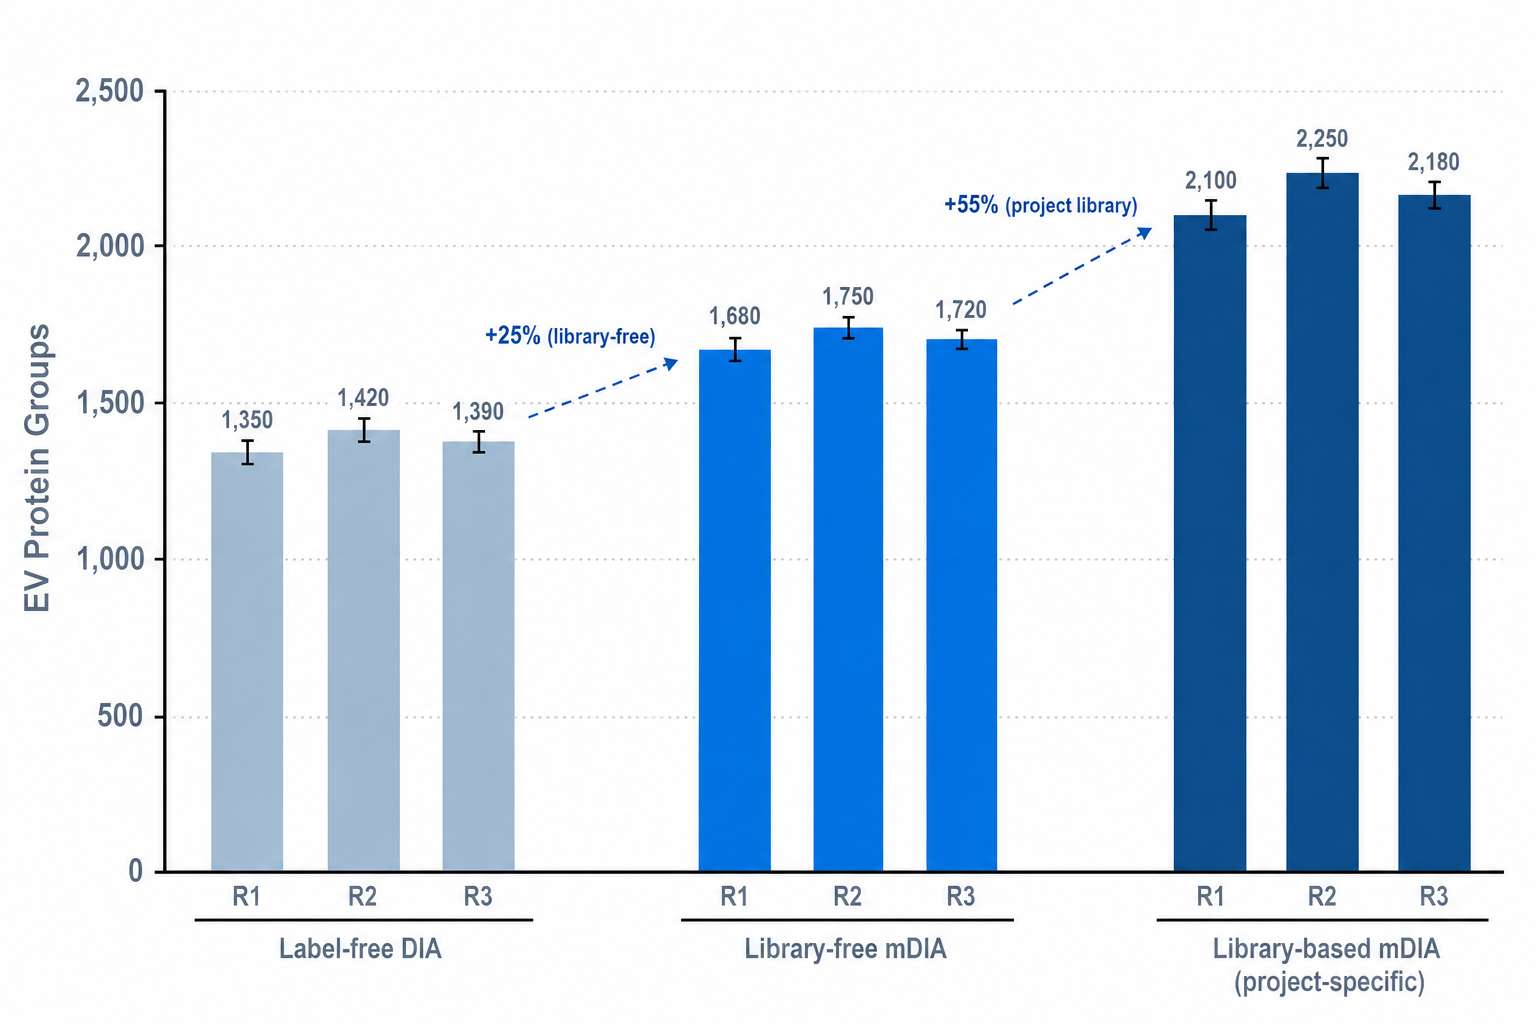
mDIA quantifies 30–50% more EV proteins than label-free DIA at equivalent sample input — critical for precious, volume-limited EV samples.
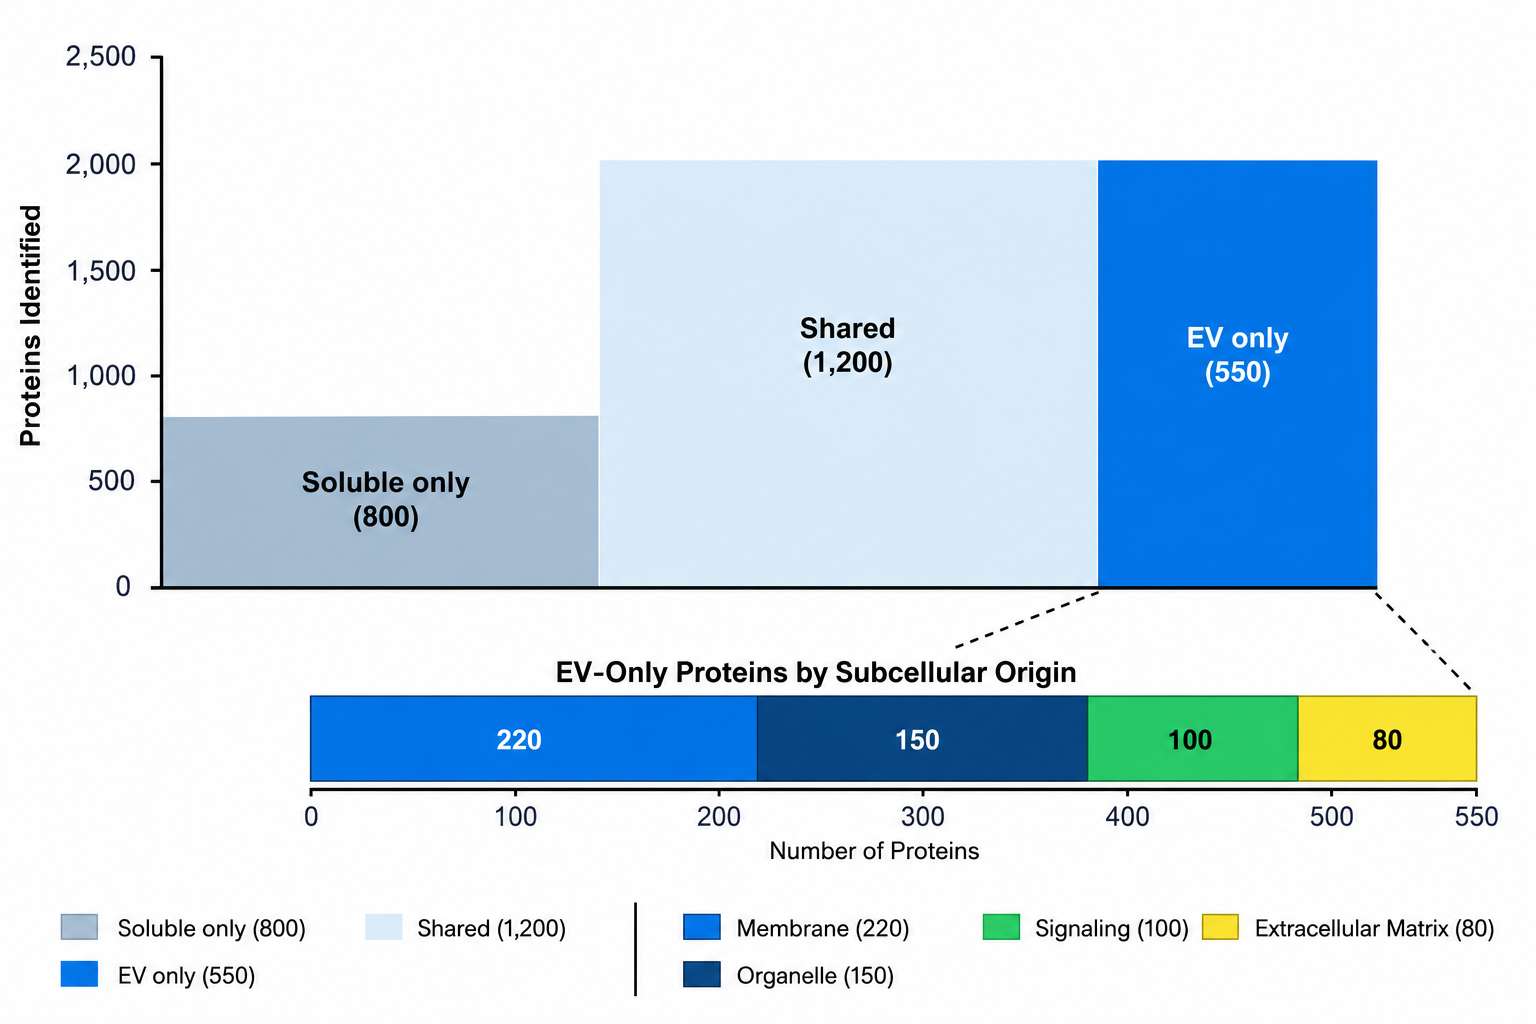
EV vs soluble proteome overlap — 500+ proteins detected only in the EV fraction, including membrane receptors, organelle-specific proteins, and signaling kinases.
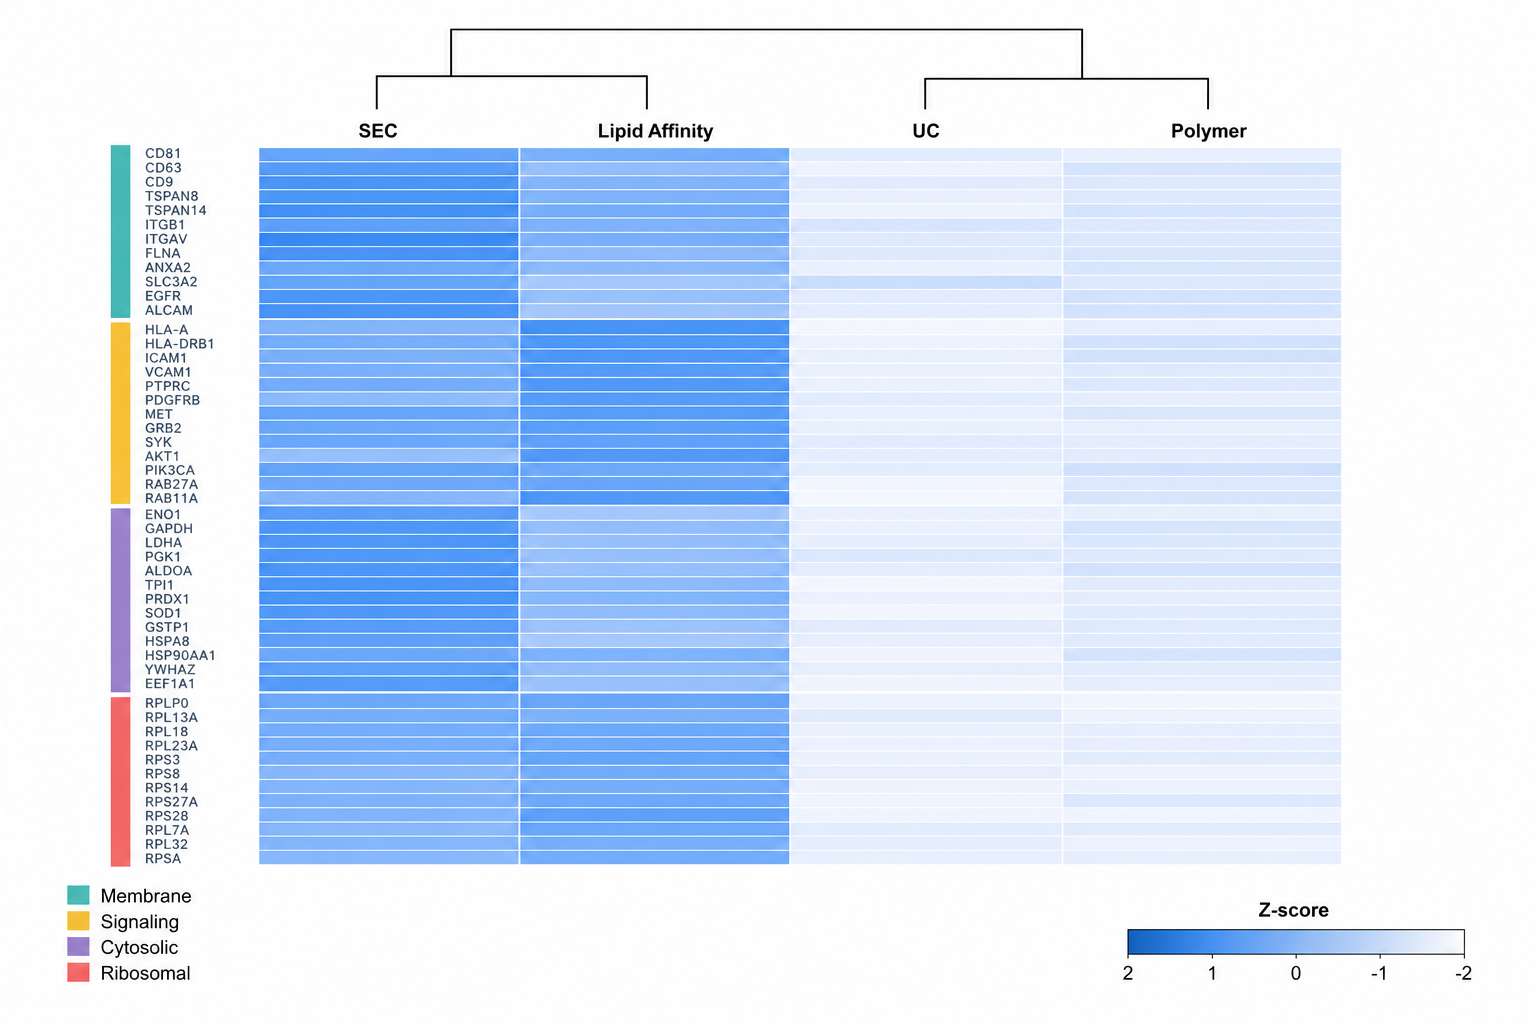
EV enrichment methods compared side-by-side — SEC and lipid affinity beads recover distinct EV subpopulations, each with unique proteomic signatures.
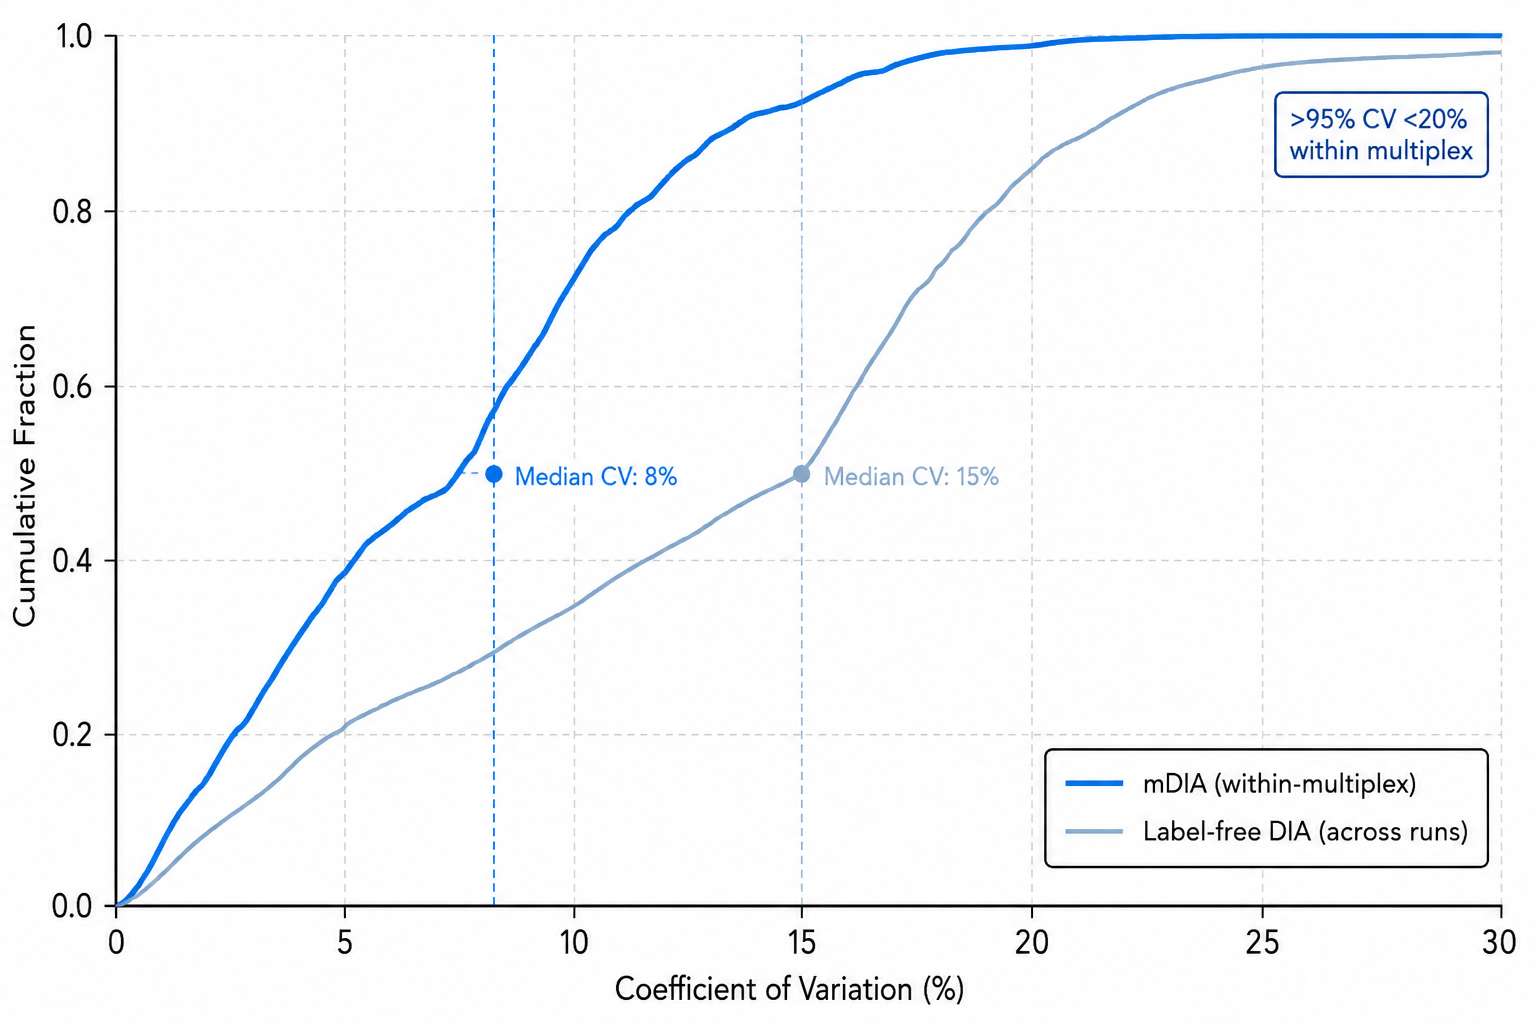
EV proteomics reproducibility — median CV below 15% across biological replicates, with mDIA matched-acquisition eliminating run-to-run variability.
- EV isolation and characterization (NTA size/concentration)
- Protein identification and quantification matrix
(1,500–3,000 EV proteins × N samples) - Differential expression analysis with statistics
- Subcellular localization annotation
- Volcano plots, PCA, hierarchical clustering
- GO, KEGG, Reactome pathway enrichment
- EV-specific marker confirmation (CD9, CD63, CD81, TSG101)
- Biomarker panel development and ROC analysis
- Raw DIA data files and processed quantification tables
- Complete QC report with enrichment and MS metrics
EV Proteomics Frequently Asked Questions
From plasma-derived EVs, mDIA routinely identifies 1,500–2,500 protein groups per sample. From urine EVs, 1,200–2,000 proteins. From cell culture-derived EVs, 2,000–3,500 proteins due to higher starting material and lower complexity. These numbers depend on EV yield, which varies with sample type, volume, and enrichment method.
Importantly, EV proteomics captures a distinct set of proteins — membrane receptors, organelle-resident proteins, and signaling kinases — that are undetectable in matched soluble biofluid fractions.
The optimal method depends on three factors: sample volume, required purity, and downstream application. For large cohort biomarker studies where standardized, reproducible isolation is critical, SEC is the preferred method and the most commonly used in published EV biomarker research. For precious, volume-limited samples (<1 mL) where maximizing protein yield is the priority, lipid affinity-based magnetic bead capture offers higher recovery at comparable purity to SEC.
For pilot studies on a limited budget, UC or polymer precipitation can be used — but note that these methods co-isolate more non-EV proteins, which will be visible as background in the proteomics data. Our team discusses enrichment strategy during study design to match your specific research goals.
In mDIA, EV peptides from individual samples are chemically tagged with dimethyl labels (light/medium/heavy), then up to 3 samples are pooled and analyzed in a single DIA run. Because all samples within a multiplex are acquired simultaneously, run-to-run instrumental variability is eliminated — a significant advantage for EV samples, where low protein amounts make every quantitative measurement count.
The pooled sample also increases total peptide loading, which pushes low-abundance EV peptides above the MS detection threshold. In published comparisons, mDIA identified 30–50% more EV proteins than label-free DIA at equivalent sample input.
Yes. Differential ultracentrifugation can separate large EVs (microvesicles, pelleted at 10,000–20,000g) from small EVs (exosomes, pelleted at 100,000–150,000g). SEC separates EVs primarily by size, with early fractions enriched in larger vesicles, and later fractions enriched in smaller vesicles. Lipid affinity-based capture recovers the total EV population.
For projects requiring EV subpopulation-specific analysis, we recommend SEC with fraction collection followed by proteomic analysis of individual fractions enriched for different EV size classes.
Plasma/serum: 500 μL–1 mL for standard mDIA; 2 mL for deep profiling with subpopulation analysis. Urine: 10–50 mL (more dilute than plasma). CSF: 500 μL–1 mL. Cell culture supernatant: 10–50 mL, depending on cell type and EV secretion rate. For precious samples with limited volume, lipid affinity-based capture maximizes protein recovery from as little as 200 μL of plasma.
Samples should be processed within 2 hours of collection (centrifuge to remove cells/debris) and stored at −80°C. Avoid repeated freeze-thaw cycles. We provide collection tubes and detailed protocols for multi-site studies.
Not necessarily. If you have already isolated EVs and confirmed their presence by NTA, TEM, or western blot for EV markers (CD9, CD63, CD81, TSG101), we can proceed directly to proteomic sample preparation. If you are sending raw biofluids, we perform EV isolation and characterization as part of the service — including nanoparticle tracking analysis for EV size and concentration, and confirmatory western blot for EV markers on a subset of samples.
For first-time projects, we recommend sending matched raw biofluid aliquots so that EV isolation is performed under standardized conditions in our laboratory.
Case Study: mDIA EV Proteomics Reveals IDH1 Mutation-Driven Changes in Cholangiocarcinoma
mDIA
multiplexed DIA on timsTOF HT
30–50%
more EV proteins than label-free DIA
IDH1 R132H
mutation-driven EV cargo shift
Biomarkers
identified and verified in EV proteome
Background
Intrahepatic cholangiocarcinoma is an aggressive liver cancer with limited treatment options. Mutations in isocitrate dehydrogenase 1 (IDH1) — specifically the R132H gain-of-function mutation — occur in approximately 15–20% of cases and produce the oncometabolite 2-hydroxyglutarate, which drives global epigenetic and metabolic reprogramming. Targeted IDH1 inhibitors exist, but understanding how the mutation alters the EV proteome — and which changes are reversed by inhibitor treatment — requires a proteomic approach sensitive enough to quantify low-abundance EV proteins.
Study Design & Samples
EVs were isolated from cholangiocarcinoma cell lines expressing wild-type IDH1, mutant IDH1-R132H, and mutant IDH1-R132H treated with an IDH1 inhibitor. EVs were captured using lipid affinity-based magnetic bead enrichment and processed through an on-bead one-pot digestion workflow to minimize sample loss. Three mDIA pipelines were compared: library-free DIA, library-based DIA using a generic spectral library, and library-based DIA using a project-specific spectral library built from StageTip-fractionated EV digests.
Technical Methods
EV isolation: Lipid affinity magnetic bead capture followed by on-bead trypsin digestion. Labeling: Dimethyl labeling (light/medium/heavy) for 3-plex mDIA. Acquisition: DIA on Bruker timsTOF HT. Spectral library: Project-specific library built from off-line StageTip high-pH fractionation of pooled EV digests, searched against the human proteome. Quantification: MS1-level feature extraction and matching across the multiplex set.
Key Findings
| Metric | Result | Significance |
|---|---|---|
| mDIA vs label-free (EV proteins) | 30–50% more identifications | Project-specific spectral library mDIA dramatically outperforms library-free and generic library approaches for EV samples |
| IDH1-R132H EV proteome shift | Hundreds of differentially expressed EV proteins | A single point mutation reprograms the entire EV proteome — including proteins involved in metabolism, signaling, and immune modulation |
| Inhibitor treatment effect | Partial reversal of mutant EV signature | IDH1 inhibitor partially restores wild-type EV proteome — demonstrating EV proteomics as a pharmacodynamic biomarker readout |
| Pipeline validation | Project-specific library > generic library > library-free | Off-line fractionation for a custom spectral library is the recommended strategy for maximum EV proteome depth |
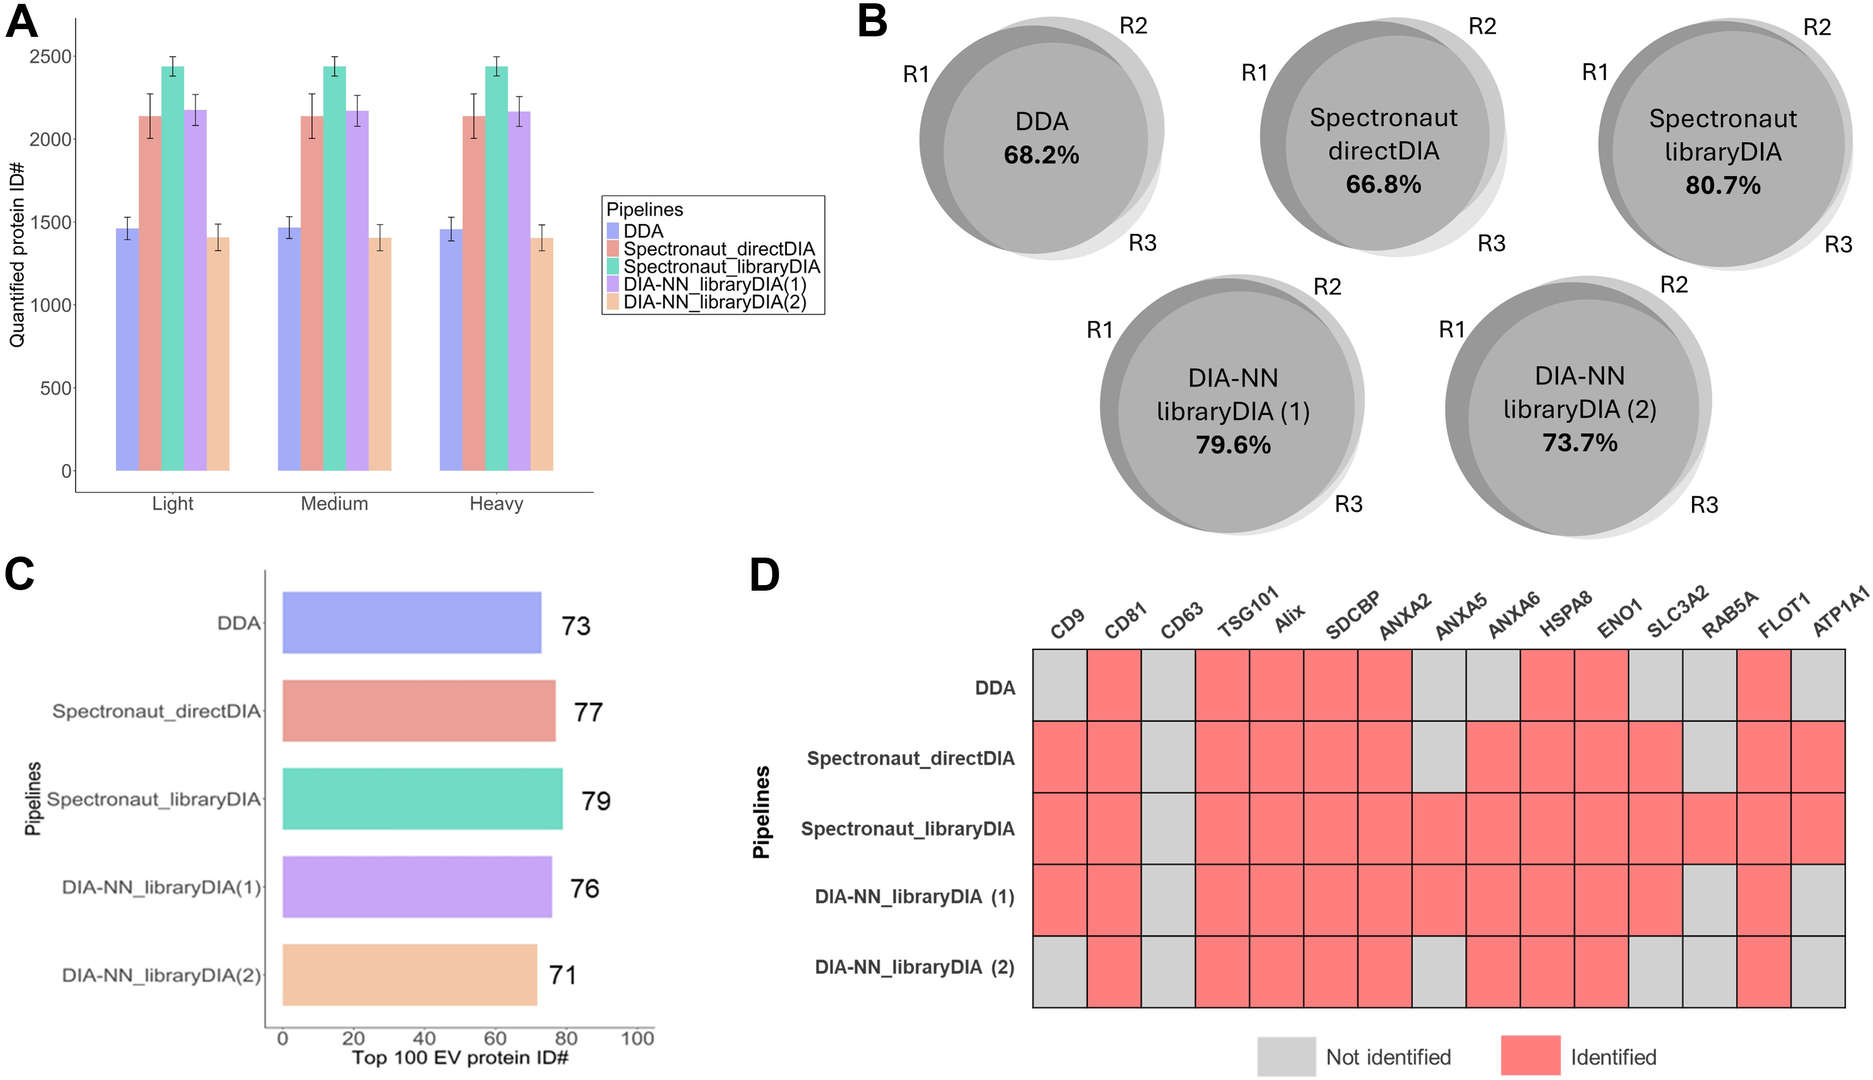
Three mDIA pipelines compared — project-specific spectral libraries built from StageTip fractionation of EV digests identified 30–50% more proteins than library-free approaches.
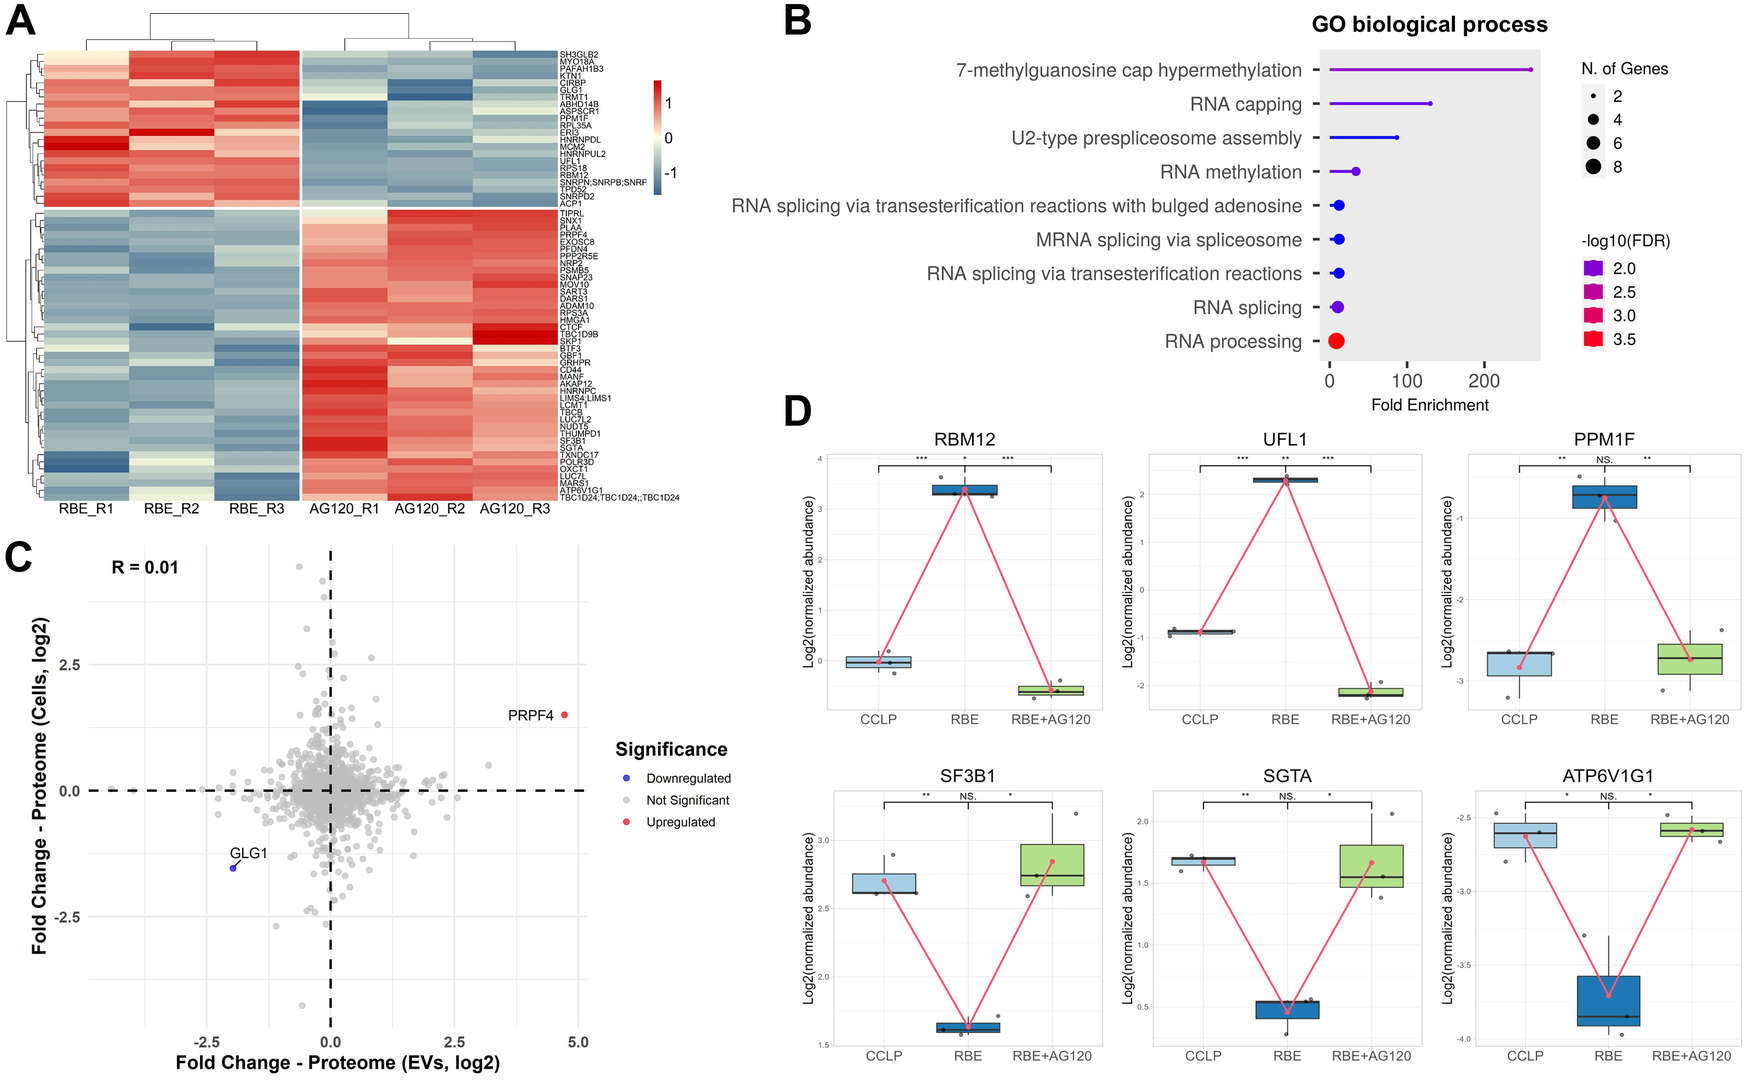
IDH1-R132H mutation shifts the EV proteome landscape — hundreds of proteins change abundance. Inhibitor treatment partially reverses the signature, validating EV proteomics for pharmacodynamic monitoring.
What This Means for EV Proteomics Studies
- mDIA is the recommended acquisition strategy for EV samples. At equivalent sample input, multiplexed DIA identifies 30–50% more EV proteins than label-free approaches. For projects where EV yield is limiting — small plasma volumes, low-EV-secreting cell lines — mDIA provides the quantitative sensitivity needed for confident biomarker discovery.
- A single oncogenic mutation reshapes the entire EV proteome. IDH1-R132H changed the abundance of hundreds of EV proteins — not just a handful of candidates. EV proteomics captures this broad molecular reprogramming, providing a systems-level view of how a tumor mutation remodels intercellular communication.
- EV proteomics can monitor drug response in real time. Inhibitor treatment partially reversed the mutant EV signature, demonstrating that EV protein cargo changes rapidly and detectably in response to targeted therapy. This positions EV proteomics as a noninvasive pharmacodynamic monitoring tool — applicable to clinical trials where repeated tissue biopsies are impractical.
Reference: Liu YK, Miller N, Hadisurya M, Zhang Z, Tao WA. Multiplexed Data-Independent Acquisition (mDIA) to Profile Extracellular Vesicle Proteomes. Molecular & Cellular Proteomics. 2026;25(2):101507. doi:10.1016/j.mcpro.2026.101507