
What Is Large-Scale Phosphoproteomics?
Phosphoproteomics is the systematic identification and quantification of protein phosphorylation — the most widespread and functionally important post-translational modification — across thousands of proteins in a single experiment. By combining phosphopeptide enrichment (TiO₂ or IMAC) with DIA mass spectrometry, we capture a comprehensive snapshot of cellular signaling state.
Unlike targeted phospho-assays that measure a handful of pre-selected sites, large-scale phosphoproteomics is unbiased — it quantifies every detectable phosphorylation event in your sample. This is critical for kinase inhibitor studies, where resistance often emerges through unexpected pathway rewiring that candidate-based approaches would miss. For projects starting from discovery proteomics data, phosphoproteomics adds the signaling layer that transforms a list of differentially expressed proteins into a mechanistic model of pathway activation.
For studies investigating phosphorylation alongside other modifications, our 4D PTMs proteomics service supports combined phospho-, ubiquitin-, and acetyl-proteomics from a single sample.
Content Guide
- DIA and 4D for Deep Phospho Coverage
- Service Advantages
- Workflow
- Kinase Signaling Analysis
- Sample Requirements
- Deliverables
DIA and 4D Phosphoproteomics: How We Achieve 36,000+ Phosphosites per Run
Phosphopeptides are inherently challenging — they ionize poorly, exist at low stoichiometry, and compete with unmodified peptides during MS acquisition. Three technical pillars overcome these challenges. You choose which acquisition platform best fits your project:
| Pillar | Technology | What It Solves |
|---|---|---|
| Enrichment | TiO₂ (titanium dioxide) or IMAC (Fe³⁺/Ga³⁺) with optimized loading buffers | Selectively captures phosphopeptides from complex digests — >95% specificity, eliminating >99% of non-phosphorylated background |
| Acquisition (choose one or both) | Option A: Orbitrap DIA (Exploris 480) — high mass accuracy, standardized DIA windows Option B: timsTOF 4D-diaPASEF — adds ion mobility separation, resolves co-eluting phospho-isomers, higher duty cycle |
Both options deliver >36,000 phosphosites per run. Option B is recommended for complex matrices, phospho-isomer resolution, and maximum depth. Option A is cost-efficient for standard cell/tissue phosphoproteomics |
| Data Analysis | Hybrid spectral library (DDA + DIA) with Spectronaut, site localization probability scoring | Library contains 150,000+ phosphopeptides for deep matching. Class 1 sites (probability >0.75) reported with median CV <5% |
DIA vs DDA for Phosphoproteomics
| Dimension | DDA Phosphoproteomics | DIA + 4D Phosphoproteomics |
|---|---|---|
| Phosphosites per run | 8,000–15,000 | 36,000+ |
| Missing values across replicates | 15–30% | <5% |
| Low-abundance phosphopeptide detection | Limited — stochastic precursor selection | Systematic — all precursors fragmented |
| Phospho-isomer resolution | Limited by chromatography alone | 4D ion mobility separates co-eluting positional isomers |
| Quantitative reproducibility (median CV) | 10–20% | <5% |
Large-Scale Phosphoproteomics Service Advantages

Phosphosite Depth
36,000+ Sites per Run
Single-shot DIA identifies and quantifies >36,000 phosphorylation sites — 2.4× more than conventional phosphoproteomics services.

Site Localization Confidence
Class 1 Sites (>0.75 Probability)
Every reported phosphosite carries a localization probability score. Only high-confidence class 1 sites are used for downstream kinase analysis.

Flexible Platform Choice
Orbitrap DIA or timsTOF 4D
Choose Orbitrap DIA for cost-efficient standard phosphoproteomics, or add 4D ion mobility for phospho-isomer resolution and maximum coverage. Tell us your project goals — we recommend the right platform.

Quantitative Reproducibility
Median CV <5%
Validated against 166 synthetic phosphopeptide standards. Batch-to-batch CV consistently below 5%, enabling robust statistical comparisons across large cohorts.

Kinase Activity Inference
KSEA + Network Mapping
Kinase-substrate enrichment analysis identifies which kinases are activated or suppressed — transforming a phosphosite list into a signaling map.

Total Proteome Option
Phospho + Total from Same Sample
Parallel total proteome and phosphoproteome profiling enables phosphosite normalization against protein abundance — distinguishing phosphorylation changes from expression changes.
Large-Scale Phosphoproteomics Workflow
From sample to kinase signaling map — each step optimized for phosphopeptide recovery, detection sensitivity, and biological interpretation.
Matrix-specific lysis with phosphatase inhibitors to preserve endogenous phosphorylation. Trypsin/Lys-C digestion optimized for phosphopeptide recovery.
TiO₂ or IMAC (Fe³⁺/Ga³⁺) enrichment with optimized loading buffers (glycolic acid/lactic acid) for >95% phosphopeptide specificity. Dual enrichment option available for maximum coverage.
timsTOF diaPASEF (4D ion mobility DIA) or Orbitrap Exploris 480 DIA. Variable isolation windows optimized for phosphopeptide density. Single-shot or fractionated workflows per project goals.
Data searched against a hybrid phosphoproteome spectral library (DDA + DIA, 150,000+ phosphopeptides) using Spectronaut. Site localization probability calculated for every phosphosite.
Label-free quantification with normalization, missing value handling, and statistical testing (moderated t-test, ANOVA). Phosphosite-level and protein-level differential analysis.
Kinase-substrate enrichment analysis (KSEA) infers kinase activity from substrate phosphorylation changes. Signaling network maps, motif analysis, and pathway enrichment delivered in a comprehensive report.
From Phosphosites to Kinase Signaling Maps
A list of phosphosites tells you what changed. Kinase analysis tells you why — and which kinase to target next.

Kinase-Substrate Enrichment Analysis (KSEA)
- Infers kinase activity from the phosphorylation status of its known substrates — no need for kinase expression or activity assays.
- Identifies which kinases are activated or inhibited in your condition, ranked by statistical significance.

Signaling Network Visualization
- Kinase-substrate relationships mapped onto annotated signaling pathways — PI3K/AKT, MAPK/ERK, JAK/STAT, and more.
- Node color represents phosphorylation change; edge thickness represents confidence.

Motif Analysis
- Extracts conserved phosphorylation motifs (e.g., basophilic, proline-directed, acidophilic) from differentially regulated sites.
- Motif enrichment reveals which kinase families are active — even for kinases without well-characterized substrates.

Kinase Inhibitor Response Profiling
- Compare phosphoproteomes before and after kinase inhibitor treatment to identify on-target effects, off-target pathway rewiring, and resistance mechanisms.
- Directly applicable to targeted proteomics validation of key phosphosites in larger cohorts.
- TiO₂ and IMAC enrichment options — dual enrichment for maximum phosphosite coverage
- Choose Orbitrap DIA or add timsTOF 4D for ion mobility separation — we recommend based on your project
- Kinase activity inference and signaling network mapping as standard deliverables
- For projects requiring positional isomer resolution via CCS, see our 4D phosphoproteomics service
Phosphoproteomics Sample Requirements

Critical: Include phosphatase inhibitors during lysis. Snap-freeze samples immediately. Avoid phosphate-containing buffers — they interfere with TiO₂ enrichment.
Total proteome option: If you also need total proteomics data, we split the digest before enrichment — one aliquot for phospho-enrichment, one for total proteome analysis.
| Sample Type | Phospho Only | Phospho + Total Proteome | Handling |
|---|---|---|---|
| Cell pellet | ≥ 5×10⁶ cells | ≥ 1×10⁷ cells | Snap-freeze; include phosphatase inhibitors |
| Tissue (fresh/frozen) | ≥ 30 mg | ≥ 50 mg | Snap-freeze within 30 min; avoid phosphate buffers |
| FFPE | 5–10 sections (10 μm) | 10–15 sections | Ambient storage; provide H&E reference |
| Plasma/Serum | ≥ 200 μL | ≥ 500 μL | Freeze promptly; avoid heparin (interferes with MS) |
Unsure about sample preparation for phosphoproteomics?
Contact us — we provide detailed protocols including lysis buffer recommendations and phosphatase inhibitor specifications.
Large-Scale Phosphoproteomics Deliverables
From phosphosite matrices to kinase activity maps
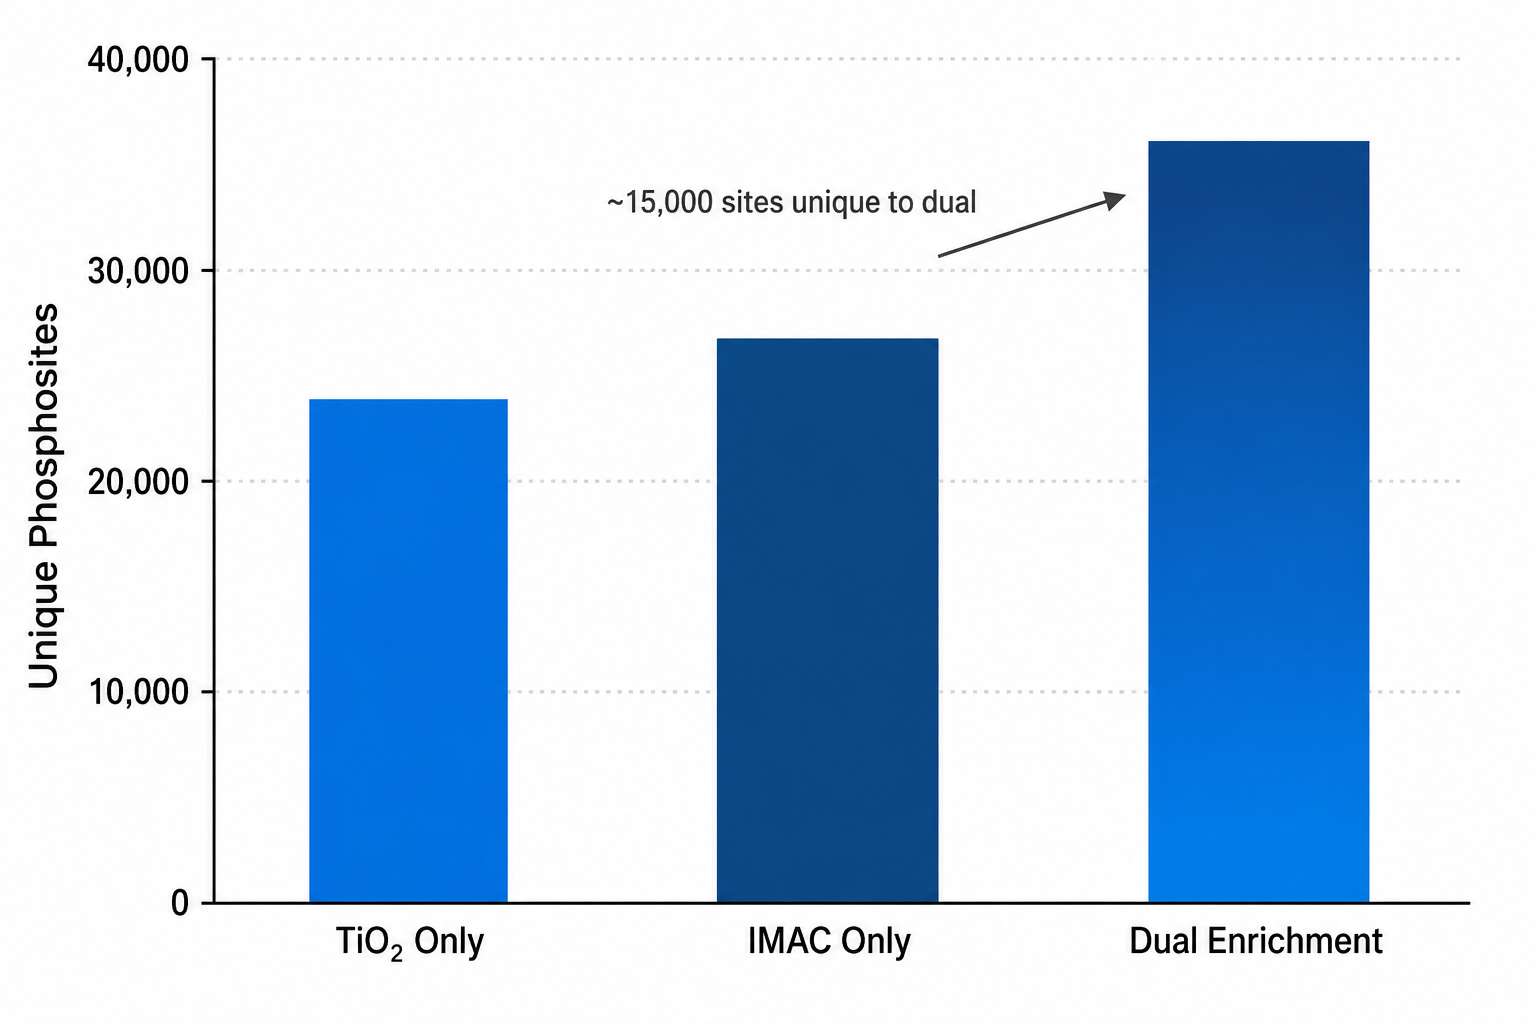
TiO₂ vs IMAC enrichment efficiency compared — dual enrichment captures >36,000 phosphosites by combining complementary selectivity of both methods.
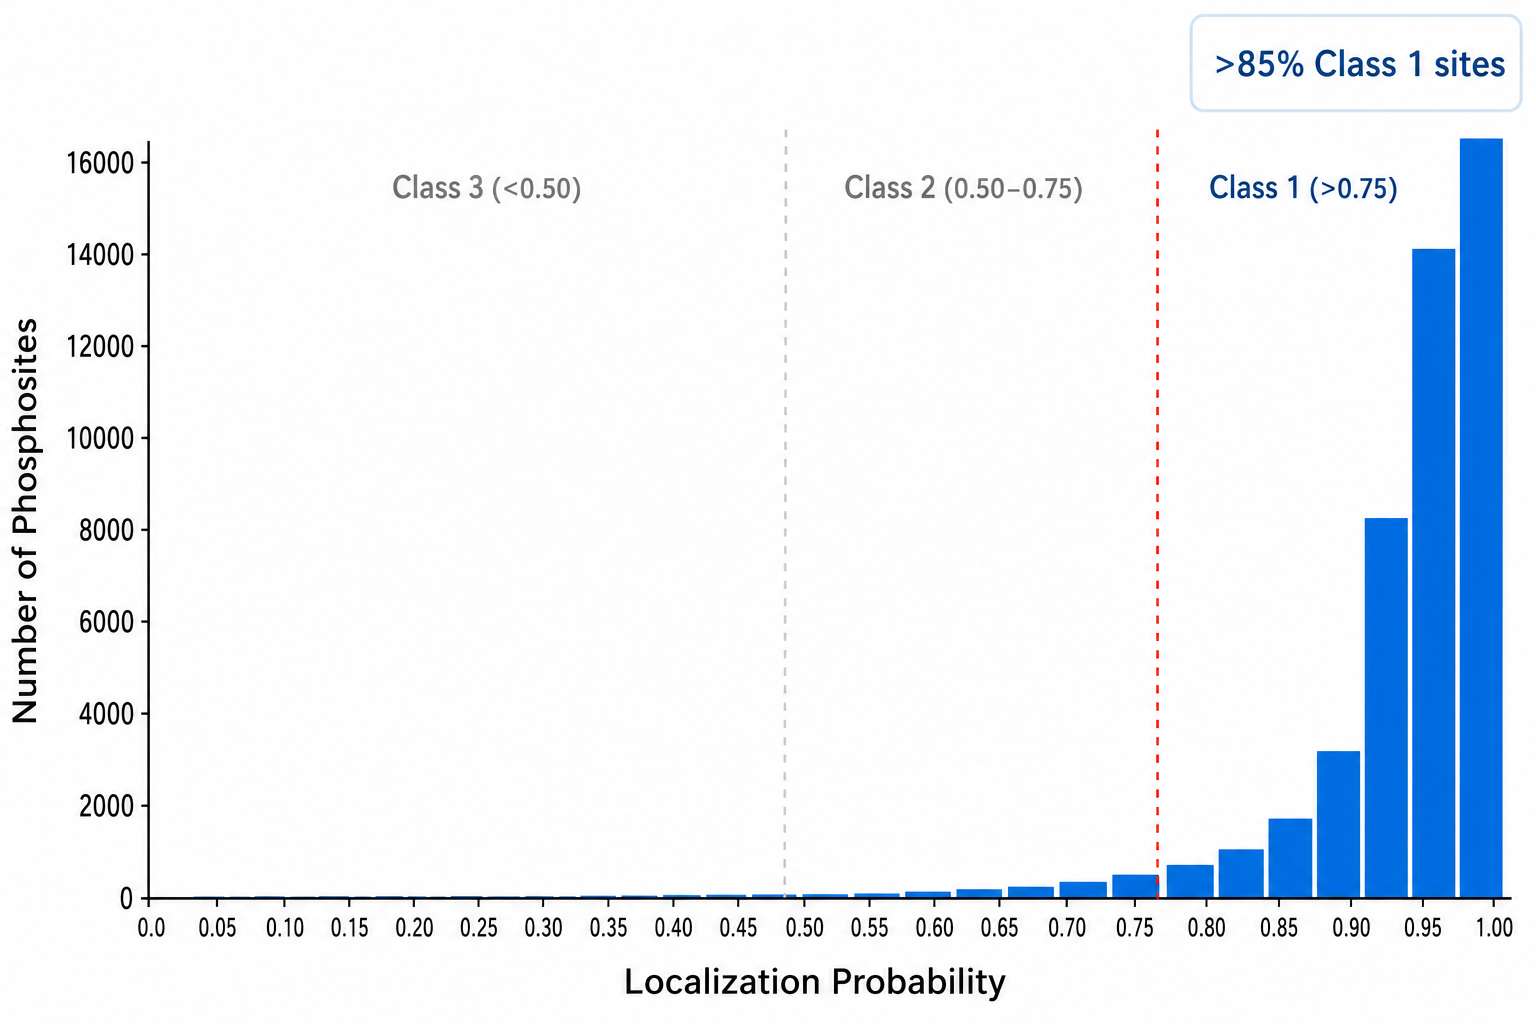
Site localization probability distribution — >85% of identified sites classified as Class 1 (>0.75 probability), ensuring high-confidence site assignment for kinase analysis.
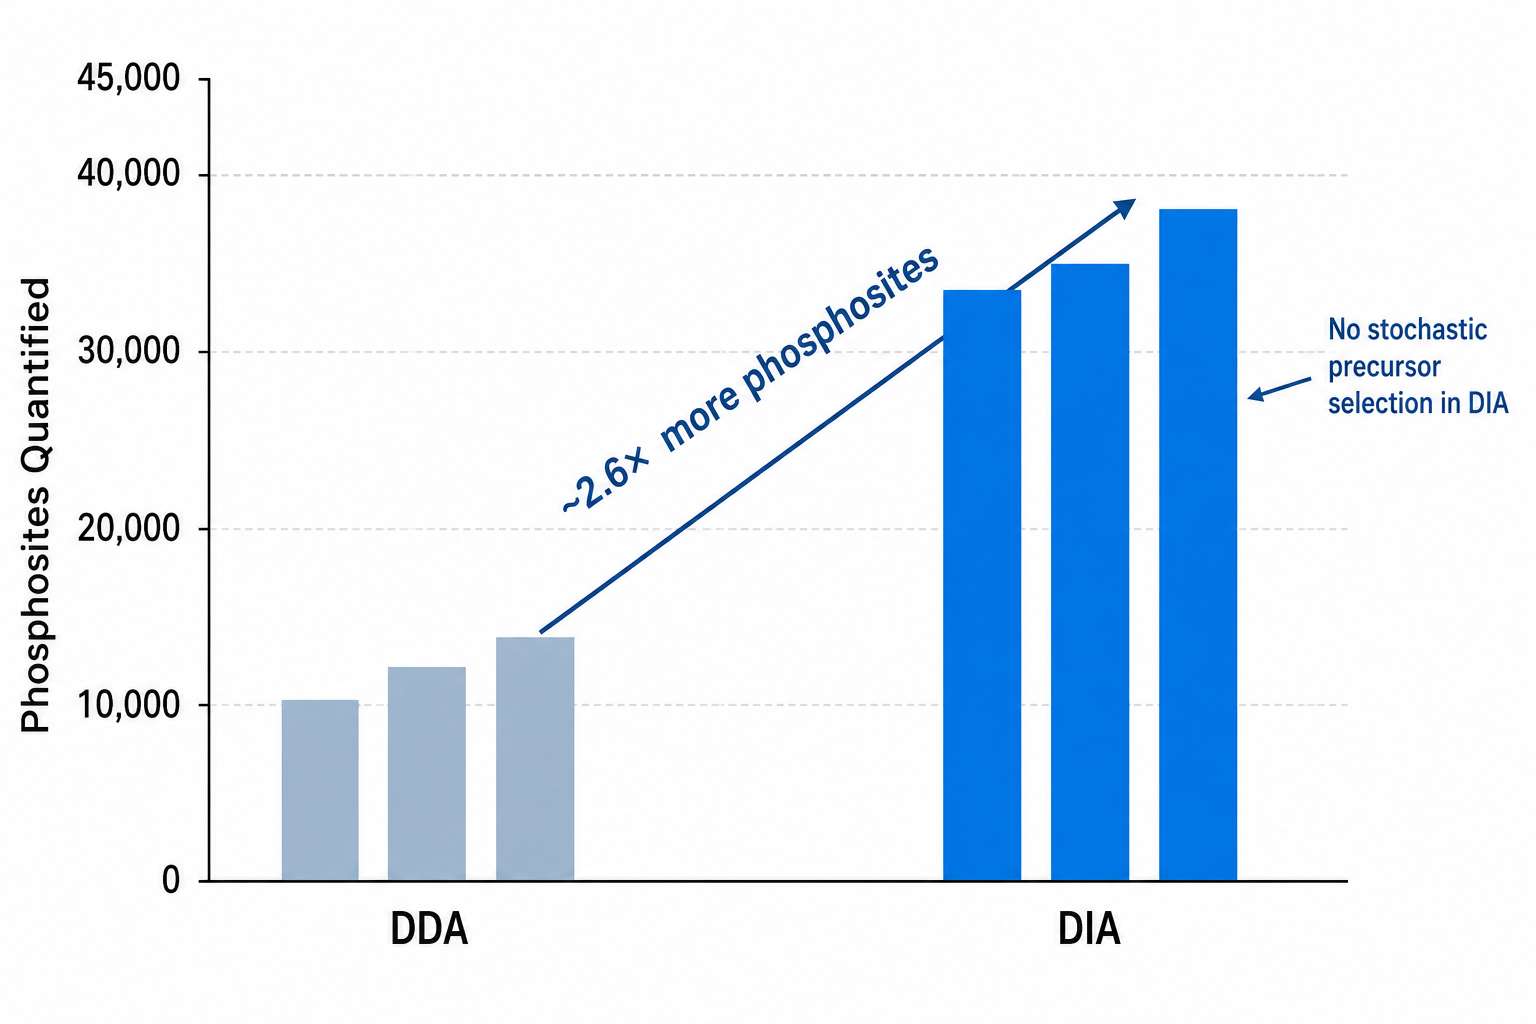
DIA vs DDA comparison — systematic precursor fragmentation in DIA quantifies 2.4× more phosphosites than conventional data-dependent acquisition.
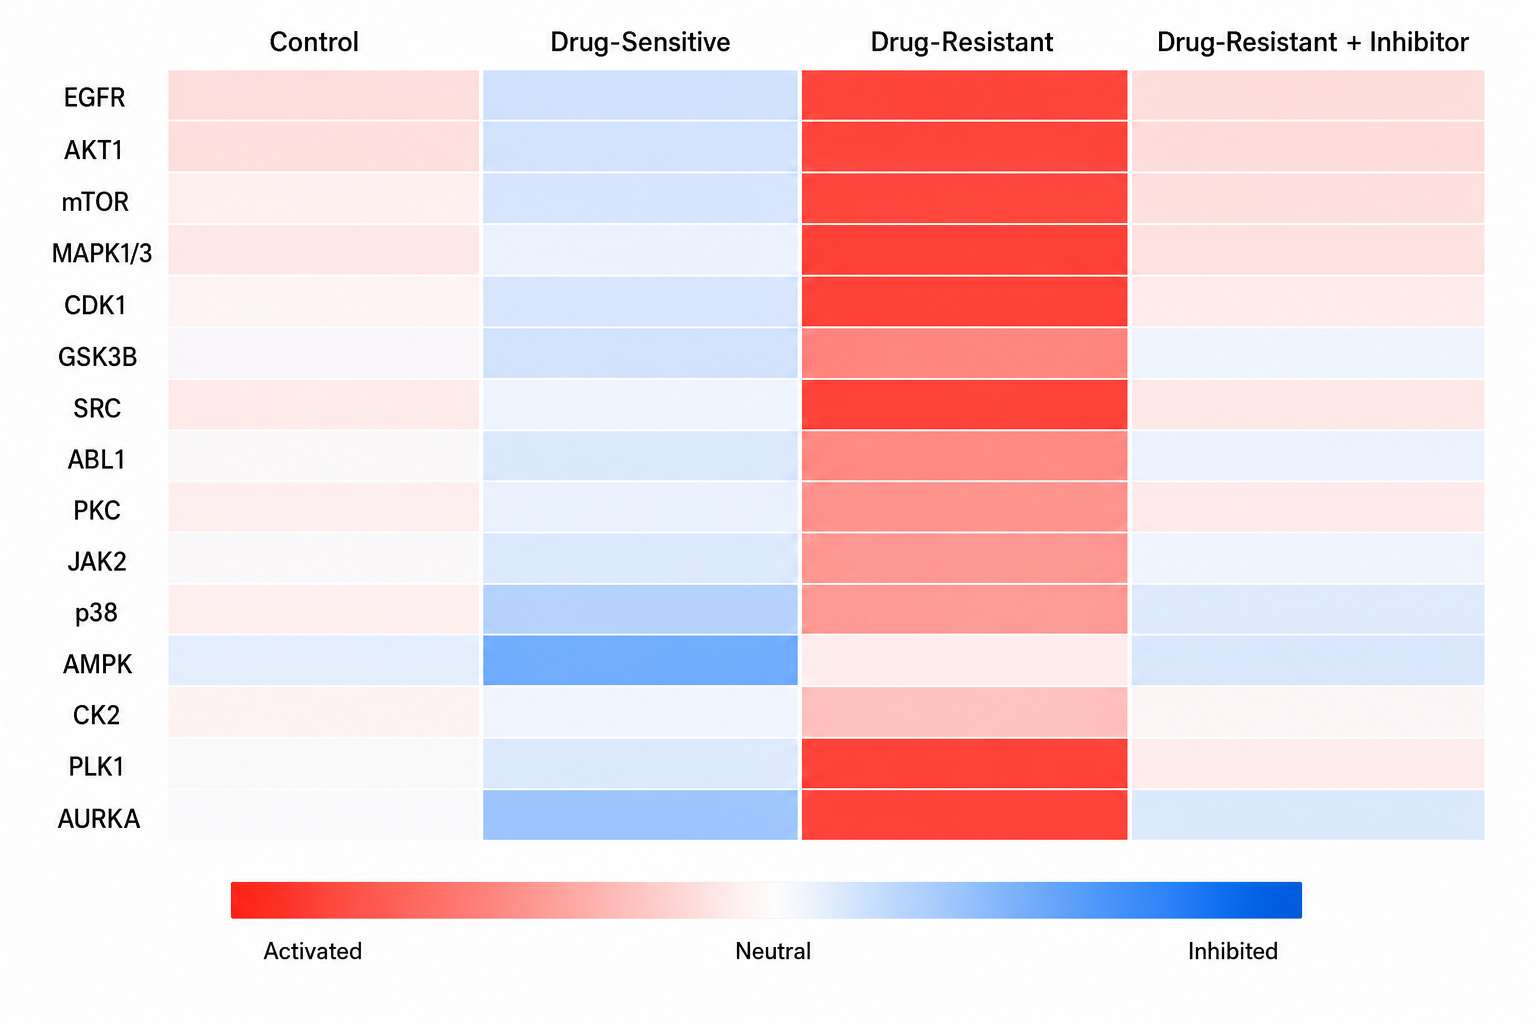
KSEA kinase activity heatmap — each row is a kinase, each column a condition. Red = activated, blue = inhibited. Your signaling roadmap in one figure.
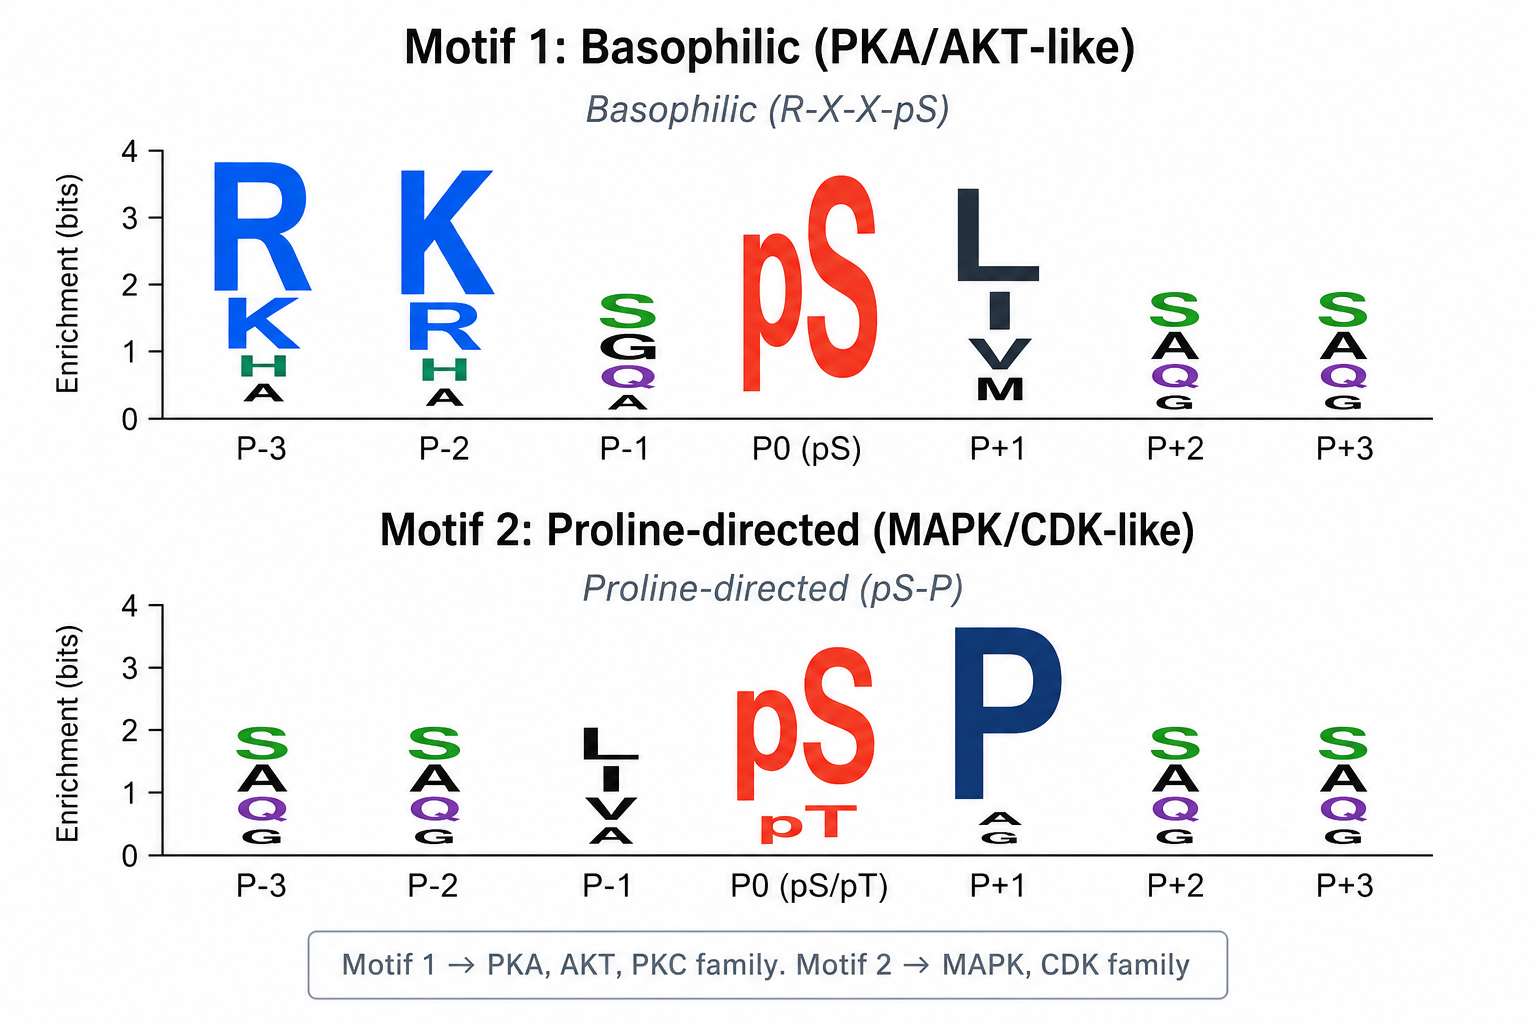
Phosphorylation motif analysis — enriched sequence motifs extracted from differentially regulated phosphosites reveal which kinase families drive the phenotype.
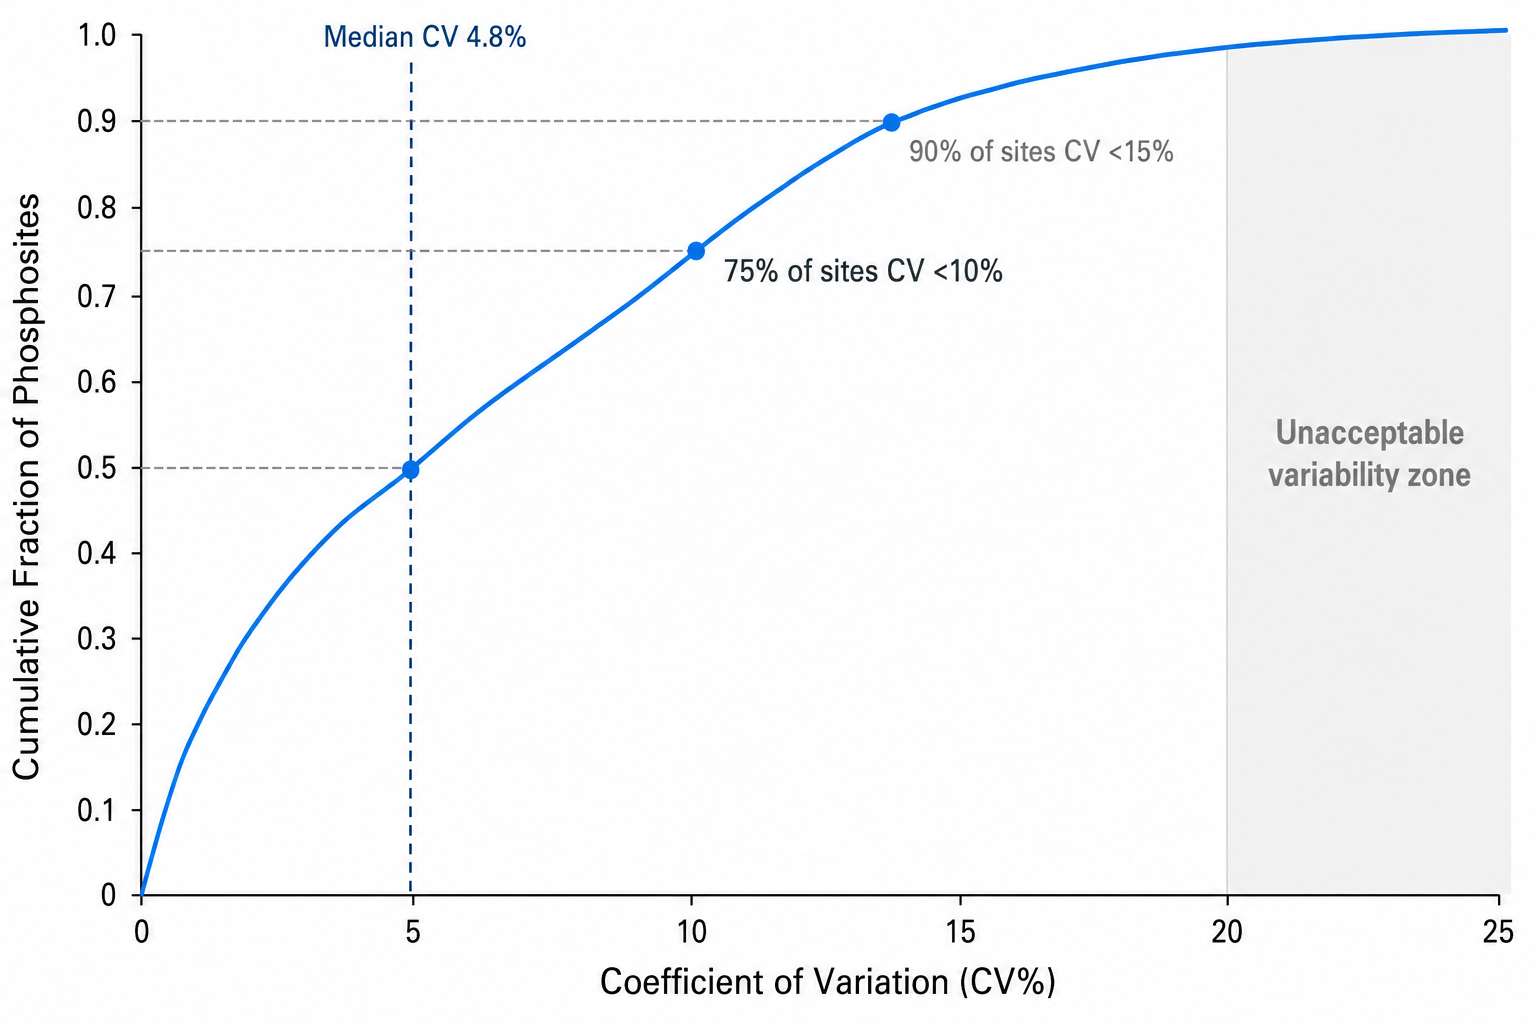
Quantitative reproducibility across a large sample cohort — median CV <5%, with >90% of phosphosites below 10% CV, enabling robust statistical comparisons.
Standard Deliverables Checklist
- Complete phosphosite identification and quantification matrix
- Site localization probability scores (Class 1/2/3 classification)
- Differential phosphosite analysis with statistics
- Kinase-substrate enrichment analysis (KSEA)
- Signaling pathway and network maps
- Phosphorylation motif analysis and kinase family inference
- Raw MS data files (.d or .raw format)
- Complete QC report with enrichment efficiency and instrument metrics
- Detailed experimental methods documentation
Large-Scale Phosphoproteomics FAQ
In a typical large-scale phosphoproteomics experiment, we quantify >36,000 phosphorylation sites across >7,000 phosphoproteins in a single run. The total number of identified phosphosites is typically 3–5× higher than the number of phosphoproteins, because most proteins carry multiple phosphorylation sites.
When running parallel total proteomics from the same sample, we typically quantify 7,000–9,000 protein groups. This allows phosphosite-level normalization — distinguishing whether a phosphorylation change reflects altered kinase activity or simply altered protein expression.
For standard phosphoproteomics, we require ≥500 µg of protein digest (equivalent to ~5×10⁶ cells or 30 mg tissue). For low-input samples (FACS-sorted cells, laser-capture microdissection, or limited biopsy material), we offer a mini-scale workflow that can process as little as 100 µg starting material, though phosphosite coverage will be proportionally lower.
The key variable is not the MS sensitivity but the enrichment step — TiO₂ and IMAC both benefit from higher peptide input to maximize phosphopeptide recovery.
We calculate a localization probability score for every phosphosite using Spectronaut's site localization algorithm. Sites with probability >0.75 are classified as Class 1 (high confidence), 0.50–0.75 as Class 2, and <0.50 as Class 3. Only Class 1 sites are carried forward into kinase analysis and biological interpretation.
We validated this approach against a set of 166 synthetic phosphopeptides with known phosphorylation positions, achieving >97% correct localization for Class 1 sites. For projects requiring positional isomer resolution — distinguishing phosphorylation on adjacent Ser/Thr residues — our 4D phosphoproteomics service uses ion mobility CCS values as an orthogonal validation dimension.
Yes. While our standard workflow captures all phospho-Ser/Thr/Tyr, tyrosine phosphorylation (pTyr) represents <1% of total cellular phosphorylation and is often underrepresented in global phosphoproteomics. For projects focused on tyrosine kinase signaling (e.g., RTK activation, TKI response), we offer an anti-phosphotyrosine antibody enrichment step prior to TiO₂/IMAC.
This pTyr-focused workflow typically identifies 500–2,000 tyrosine phosphorylation sites — sufficient to map receptor tyrosine kinase activation and downstream signaling cascades in detail.
Yes. Our DIA-based phosphoproteomics workflow is designed for cohort-scale studies. We randomize samples across batches, include pooled QC samples at regular intervals, and apply batch-aware normalization during data processing. For cohorts of 50–500+ samples, we maintain median CV below 10% across all batches and phosphosite missing value rates below 15% after normalization.
For very large studies, we recommend a pilot run of 10–20 samples to establish baseline phosphosite coverage and variance estimates — this allows us to power the full study appropriately.
Every phosphoproteomics project includes: differential phosphosite analysis (moderated t-test or ANOVA with multiple testing correction), kinase-substrate enrichment analysis (KSEA), phosphorylation motif enrichment, GO/KEGG pathway enrichment of phosphoproteins, and protein-protein interaction network analysis.
Advanced options include: time-series phosphorylation dynamics analysis, kinase activity trajectory modeling, integration with transcriptomics or total proteomics data, and customized kinome-wide visualization. Discuss your analysis needs during study design — we tailor the bioinformatics package to your biological question.
We strongly prefer to perform the entire workflow in-house to ensure consistent quality. However, we can accept peptide digests prepared elsewhere if they meet our specifications: ≥500 µg total peptide, digested with trypsin (or trypsin/Lys-C), desalted, and dried. Phosphatase inhibitors must have been included during lysis.
Note that phosphoproteomics is particularly sensitive to sample handling — dephosphorylation occurs rapidly at room temperature in the absence of inhibitors. Samples prepared without proper phosphatase inhibition will show substantially reduced phosphosite coverage.
Case Study: DIA Phosphoproteomics Maps Drug Resistance Signaling in Lung Cancer
88,107
phosphosites in hybrid library
36,350
phosphosites per single run
<5%
median CV across replicates
<0.1 ng
detection sensitivity
The Challenge: Finding Which Kinases Drive EGFR Inhibitor Resistance
Non-small cell lung cancer (NSCLC) patients treated with EGFR tyrosine kinase inhibitors (TKIs) almost inevitably develop resistance. The mechanism is rarely a simple loss of the drug target — instead, tumor cells rewire their signaling networks, activating alternative kinases that bypass EGFR blockade. Identifying which kinases take over requires measuring phosphorylation across the entire signaling network, not just a handful of candidate proteins.
How DIA Phosphoproteomics Solved It
Researchers profiled EGFR-TKI-sensitive and -resistant NSCLC cell lines using a hybrid DIA phosphoproteomics approach. Phosphopeptides were enriched by IMAC, acquired on an Orbitrap Fusion Lumos in DIA mode, and searched against a hybrid spectral library containing 159,524 phosphopeptides (88,107 unique phosphosites). The single-shot DIA workflow quantified 36,350 phosphosites per run with a median CV below 5%.
Comparing resistant vs sensitive cells revealed dramatic phosphorylation rewiring — hundreds of phosphosites changed without corresponding changes in total protein levels. KSEA analysis identified specific kinases whose predicted activity increased in resistant cells, pinpointing the bypass pathways activated under TKI pressure. These findings were then validated in patient-derived NSCLC tissues, confirming the clinical relevance of the identified resistance mechanisms.
| Metric | Result | Relevance to Your Project |
|---|---|---|
| Phosphosites quantified per run | 36,350 (19,755 Class 1) | Depth sufficient to capture entire kinome signaling state |
| Quantitative reproducibility | Median CV <5% | Statistical power to detect subtle phosphorylation changes between conditions |
| Detection sensitivity | <0.1 ng synthetic phosphopeptide | Captures low-stoichiometry phosphorylation on low-abundance signaling proteins |
| Patient tissue validation | Confirmed in NSCLC clinical specimens | Method proven on clinically relevant samples, not just cell lines |
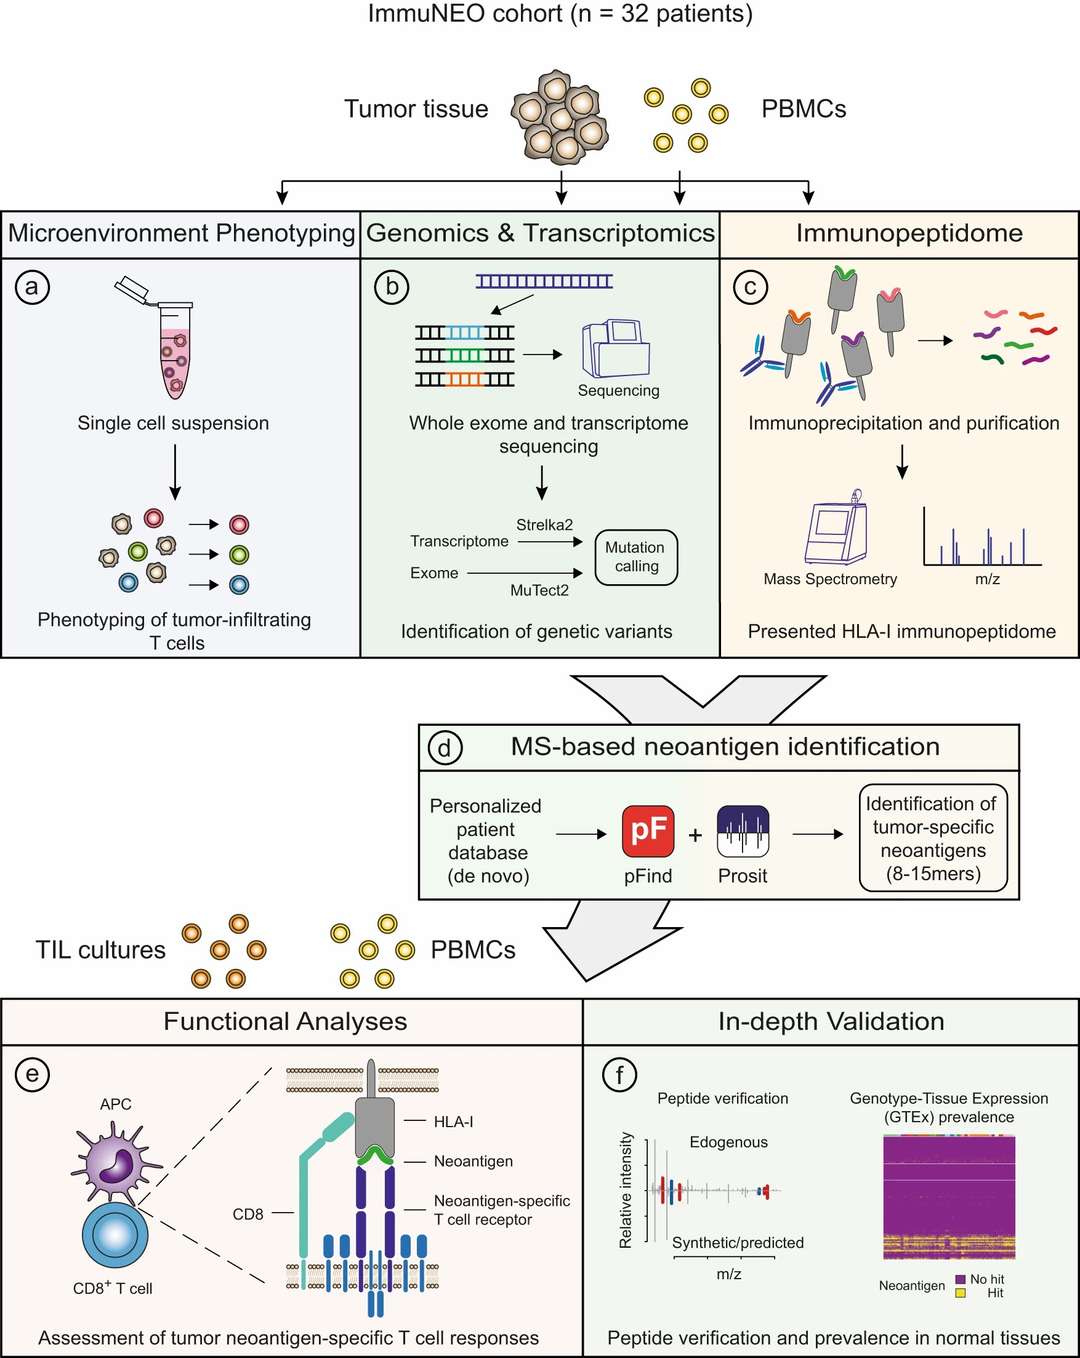
Hybrid phosphoproteome spectral library construction: DDA data from fractionated samples combined with DIA data to create a 159,524-phosphopeptide reference — enabling deep single-shot quantification.
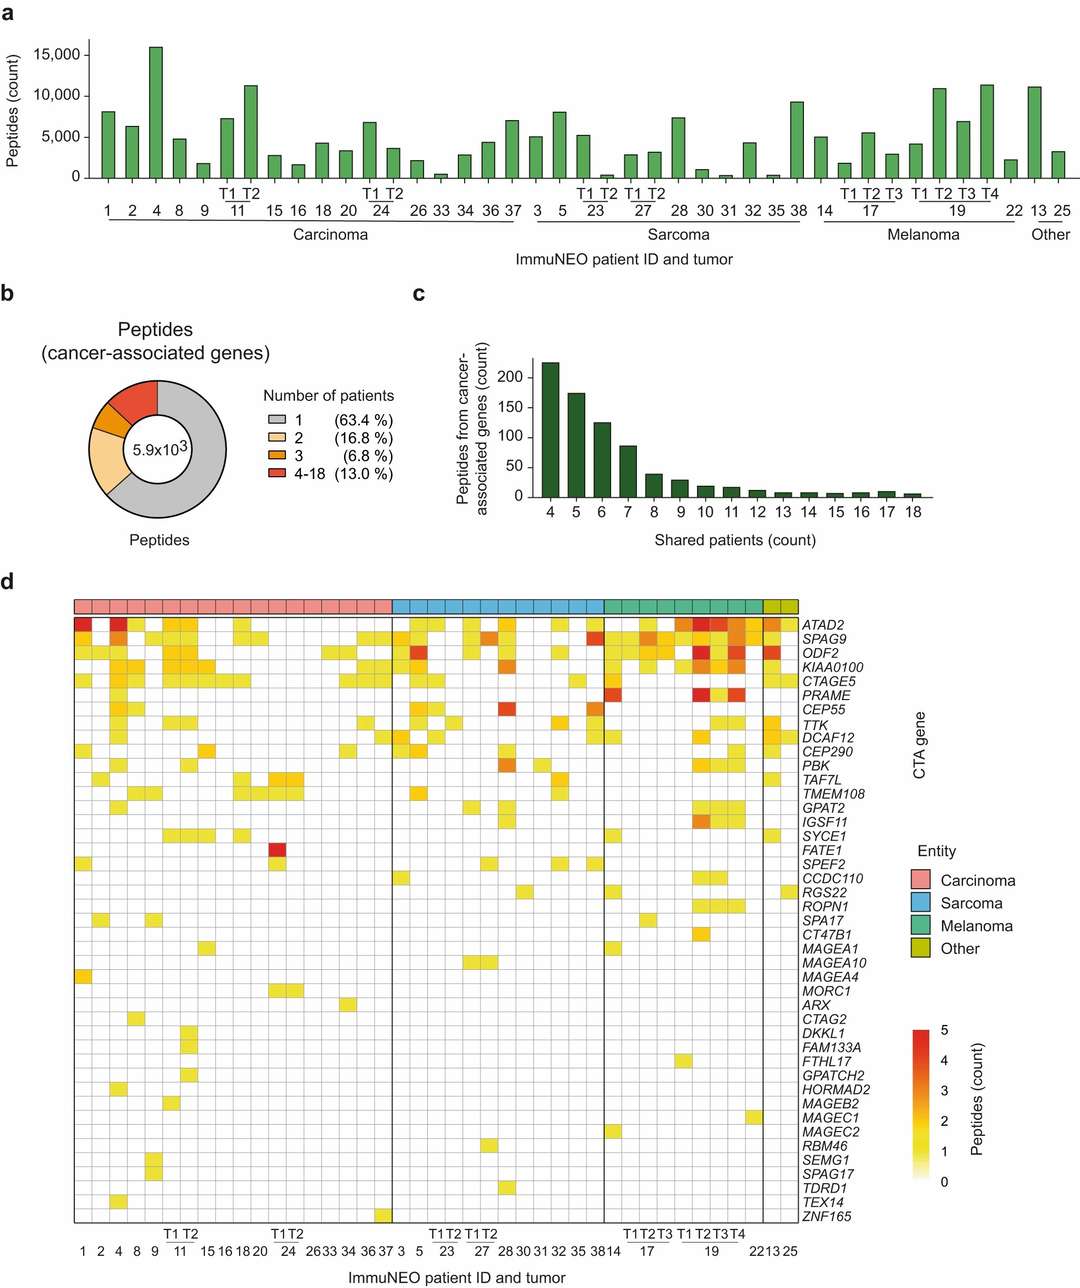
Phosphoproteome profiling of patient-derived NSCLC tissues: thousands of differentially regulated phosphosites between tumor and adjacent normal tissue, revealing disease-specific kinase activation patterns.
What This Means for Your Phosphoproteomics Project
- 36,350 phosphosites per run means you see the full signaling picture. This is 2–3× deeper than standard phosphoproteomics services. Kinase inhibitor studies, resistance mechanism research, and signaling pathway mapping all benefit from this depth — you're not limited to the top few hundred most abundant phosphosites.
- Changes in phosphorylation do not require changes in protein expression. In the NSCLC study, hundreds of phosphosites changed significantly between resistant and sensitive cells while total protein levels remained unchanged. Without phosphoproteomics, these signaling events are completely invisible.
- KSEA transforms a list of phosphosites into a list of actionable kinase targets. Instead of manually mining phosphosite tables, KSEA automatically identifies which kinases are activated or suppressed — giving you direct hypotheses for follow-up validation by targeted proteomics or inhibitor studies.
Reference: Kitata RB, Choong WK, Tsai CF, et al. A data-independent acquisition-based global phosphoproteomics system enables deep profiling. Nature Communications. 2021;12:2539. doi:10.1038/s41467-021-22759-z