
What Makes FFPE Proteomics Challenging — and How We Solve It
Formalin fixation creates methylene crosslinks between proteins, nucleic acids, and other biomolecules. These crosslinks stabilize tissue architecture for histology — but they also trap proteins in an insoluble, heavily modified state. Standard lysis buffers barely touch FFPE tissue, and what little protein is extracted carries chemical modifications (formaldehyde adducts, methylol groups) that confound peptide identification.
Our protocol addresses all three barriers simultaneously: a heat-induced antigen retrieval step reverses crosslinks, a detergent-optimized extraction solubilizes the full proteome, and a two-step digestion (Lys-C followed by trypsin) ensures complete cleavage despite residual modifications. DIA acquisition then provides the systematic fragmentation needed to confidently identify peptides with chemical adducts that would be missed by stochastic DDA selection.
Content Guide
- FFPE Protein Extraction
- DIA for FFPE Proteomics
- Service Advantages
- Workflow
- Clinical Bioinformatics
- Cohort Study Design
- Sample Requirements
- Deliverables
Why DIA Is the Right Acquisition Method for FFPE Proteomics
FFPE-derived peptides carry chemical modifications that shift their masses and fragment ions. In DDA mode, these modified peptides are often deprioritized by the instrument's precursor selection algorithm — the mass spectrometer simply doesn't recognize them as worth fragmenting. DIA quantitative proteomics eliminates this problem by fragmenting all precursors systematically. Even modified peptides with unexpected mass shifts produce interpretable fragment ion spectra.
| Dimension | DDA on FFPE | DIA on FFPE |
|---|---|---|
| Modified peptide detection | Poor — stochastic selection skips peptides with mass shifts | Complete — all precursors fragmented regardless of modification |
| Proteins quantified | 2,000–4,000 | 7,000–9,000+ |
| Cohort reproducibility | Moderate — run-to-run variability in precursor selection | High — systematic acquisition, ideal for 100+ sample studies |
| Missing values across cohort | 20–40% | <10% after normalization |
| Data reusability | No — only selected precursors recorded | Yes — complete archive, re-analyze with updated databases |
FFPE Proteomics Service Advantages

Protein Identification Depth
9,000+ Proteins from FFPE
DIA acquisition combined with optimized antigen retrieval delivers deep proteome coverage from FFPE tissue — approaching what most labs achieve from fresh-frozen samples.

Proven at Clinical Scale
Cohorts of 100–1,000+ Samples
Workflow validated on clinical-scale studies with consistent batch-to-batch performance. Published reference: >11,000 proteins across 1,220 FFPE cases.

Flexible Slide Compatibility
H&E · Unstained · Recycled · Curls
Accept standard FFPE slides including previously stained H&E sections and archived curls. Compatible with macro- and microdissected samples.

Clinical Bioinformatics
Survival · Subtyping · Biomarkers
Go beyond differential expression: survival curve analysis, WGCNA co-expression networks, LASSO regression for biomarker panels, and molecular subtype classification.

Minimal Sample Requirement
2–4 FFPE Sections (5μm)
Optimized extraction achieves deep coverage from minimal material — critical when working with precious clinical specimens or small biopsy cores.

Discovery to Validation
DIA Discovery → PRM/MRM Panels
Candidate biomarkers identified from FFPE discovery cohorts can be transitioned directly to targeted proteomics assays for independent validation.
FFPE Proteomics Workflow
From paraffin block to biomarker panel — each step optimized for FFPE-specific challenges.
FFPE blocks sectioned at 5–10 μm. Sections deparaffinized with xylene and rehydrated through graded ethanol. Compatible with curls, slides, and microdissected regions.
Heat-induced antigen retrieval (citrate or Tris-EDTA buffer, 95°C) reverses formaldehyde crosslinks. Detergent-based extraction (SDS or SDC) solubilizes the full proteome with >80% recovery efficiency.
Two-step digestion: Lys-C (4 h) followed by trypsin (overnight) for complete cleavage of crosslink-modified proteins. S-Trap or SP3 cleanup removes detergents and residual paraffin.
Peptides analyzed on timsTOF or Orbitrap platforms in DIA mode. Variable isolation windows optimized for peptide density. iRT peptides spiked for retention time normalization across batches.
Spectronaut or DIA-NN processes DIA data. FDR <1% at peptide and protein levels. TIC-based or median-normalized quantification with batch effect correction for multi-batch cohorts.
Differential expression, survival analysis, molecular subtyping, WGCNA, and biomarker panel development. All results delivered with annotated figures and statistical documentation.
FFPE Proteomics Bioinformatics: From Protein Lists to Clinical Insights
Standard and advanced analysis options tailored to clinical cohort studies — from differential expression to biomarker proteomics panel development.
| Analysis Category | Standard | Advanced |
|---|---|---|
| Quality Control | Protein/peptide ID counts, PCA, correlation heatmaps, CV distribution | Batch effect diagnostics, sample outlier detection, TIC normalization plots |
| Differential Expression | Moderated t-test / ANOVA, volcano plots, heatmaps | LIMMA with multiple covariates, time-series analysis, paired-sample designs |
| Pathway & Network | GO, KEGG, Reactome enrichment, PPI networks | GSEA, kinase-substrate enrichment, WGCNA co-expression modules |
| Biomarker Discovery | ROC analysis for individual candidates | LASSO/elastic net regression, random forest feature selection, multi-marker panel development |
| Clinical Correlation | Univariate survival analysis (Kaplan-Meier) | Cox proportional hazards regression, clinical variable adjustment, molecular subtyping with consensus clustering |
Planning Your FFPE Cohort Study
Retrospective FFPE studies have unique design considerations beyond those of prospective fresh-tissue studies. Getting these right at the planning stage determines whether your data will support robust statistical conclusions.
Case-Control Matching
Match cases and controls on block age (±2 years), fixation protocol, and tissue storage conditions. FFPE blocks from different eras or different pathology departments can introduce systematic proteomic differences unrelated to disease biology. When possible, pull cases and controls from the same archive.
Sample Size & Power
For differential expression, plan for ≥20 samples per group to detect 2-fold changes with 80% power at FDR <0.05 — adjusting for the higher biological variability typical of clinical specimens. For biomarker discovery with machine learning (LASSO, random forest), ≥50 samples per group with an independent validation set of ≥30 per group.
Batch Randomization
Randomize cases and controls across processing and acquisition batches. Do not process all controls first, then all cases — this confounds biological signal with batch effects. Include pooled QC samples (aliquots from a single large FFPE block digest) every 10–15 samples to monitor and correct for technical drift.
Histology Review Before Proteomics
Have a pathologist review an H&E section from each block before committing it to proteomics. Key checks: tumor content (>50% recommended for tumor-focused studies), necrosis (<30%), and tissue area (>50 mm²). Sections falling below these thresholds can often still be used — but their limitations should be documented and considered during statistical analysis.
Clinical Metadata: What to Collect
At minimum: diagnosis, age, sex, and block archive date. For biomarker studies, add: treatment history, survival status with follow-up time, tumor stage/grade, and any relevant molecular markers (e.g., mutation status from prior sequencing). The more covariates you have, the more confounders can be adjusted for in Cox regression and differential expression models.
- Compatible with H&E-stained, unstained, and archived FFPE slides and curls
- DIA acquisition for cohort-scale reproducibility — batch effects minimized through systematic fragmentation
- Clinical bioinformatics included — survival analysis, biomarker panels, molecular subtyping
- Compatible with clinical proteomics research workflows including multi-center cohort studies
FFPE Proteomics Sample Requirements
Slide formats accepted: Unstained sections, H&E-stained sections, curls, and microdissected regions. Provide an H&E reference slide for tissue region annotation when possible.
Storage: FFPE blocks and slides are stable at ambient temperature. Avoid exposure to high humidity or direct sunlight.
| Sample Format | Minimum Input | Recommended Input | Notes |
|---|---|---|---|
| FFPE sections (5–10 μm) | 2 sections (50–100 mm² each) | 4–6 sections | More sections = deeper coverage. Sections from the same block preferred |
| FFPE curls | 2 curls (5–10 μm, ~50 mm²) | 4 curls | Collect directly into microcentrifuge tubes; avoid contamination with embedding paraffin edge |
| Microdissected FFPE | 2–4 mm² total area | 5–10 mm² total area | LCM or manual macro-dissection. Provide annotated H&E for region identification |
| FFPE cell pellets | 1×10⁶ cells | 5×10⁶ cells | Process cell pellets into FFPE blocks before sectioning |
| Tissue microarrays (TMA) | 1 core (1–2 mm diameter) | 2–3 cores | Per individual core; multiple cores per patient recommended |
For projects combining FFPE and fresh-frozen specimens from the same patients, our tissue biomarker discovery service supports both sample types with harmonized data outputs. Unsure about your FFPE sample quality or format?
Contact us — we evaluate sample suitability and can run a pilot test on 2–3 representative sections before committing to a full cohort study.
FFPE Proteomics Deliverables
From FFPE sections to clinical-grade proteomics data
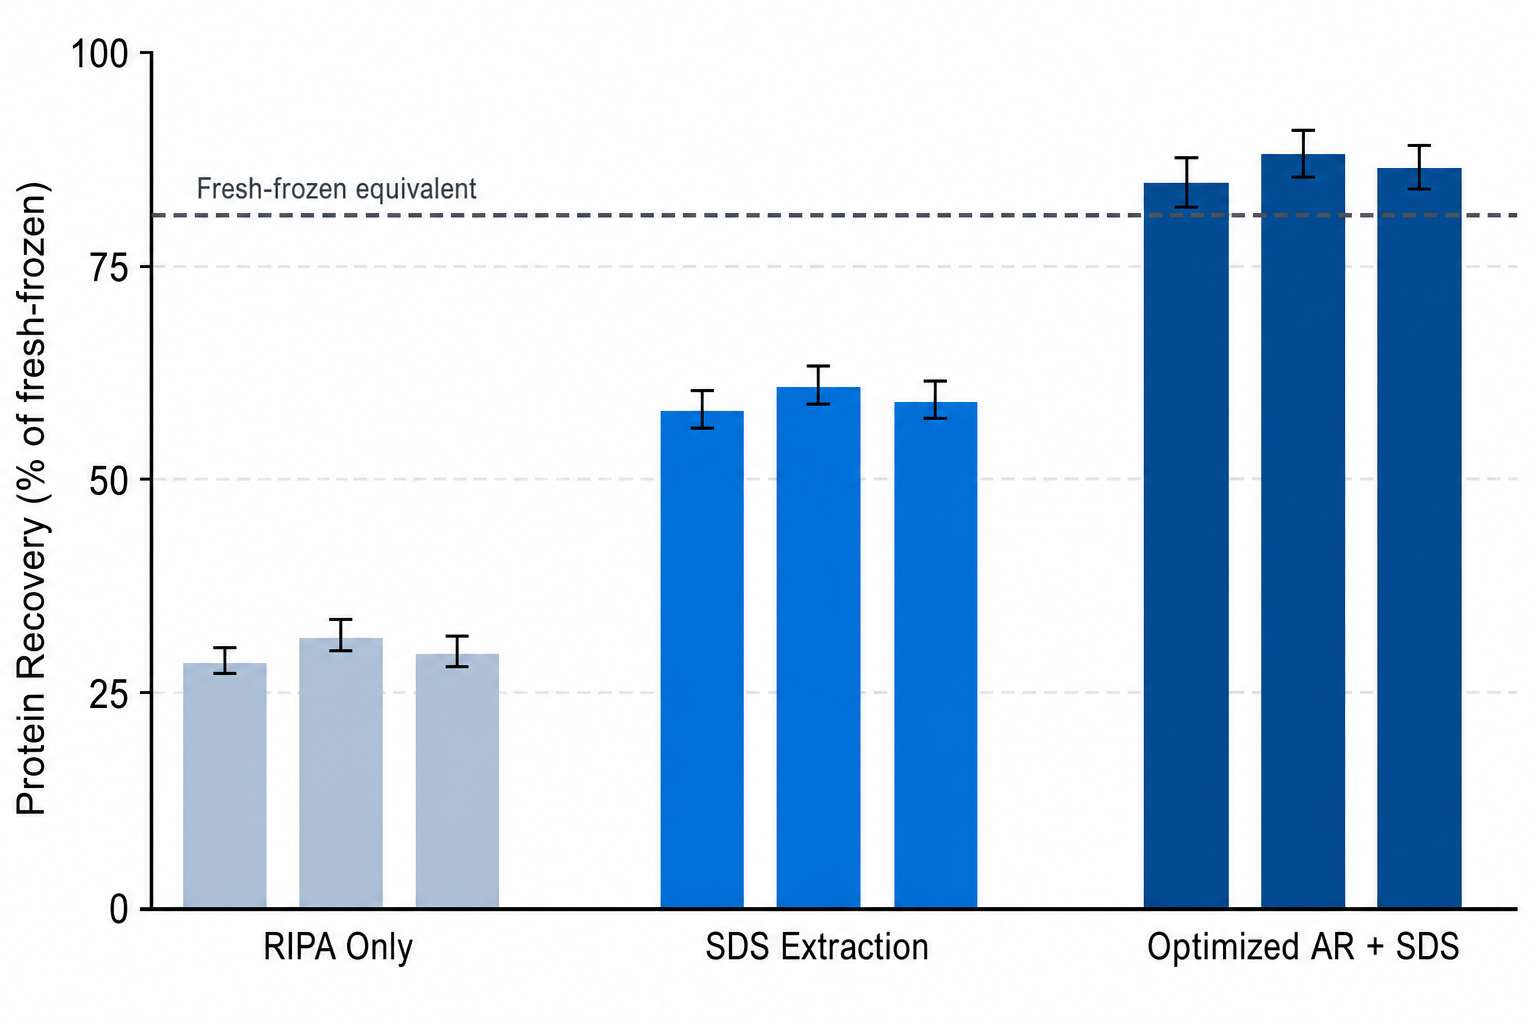
Protein recovery efficiency — our optimized antigen retrieval and detergent extraction achieve >80% recovery from FFPE tissue, comparable to fresh-frozen yields.
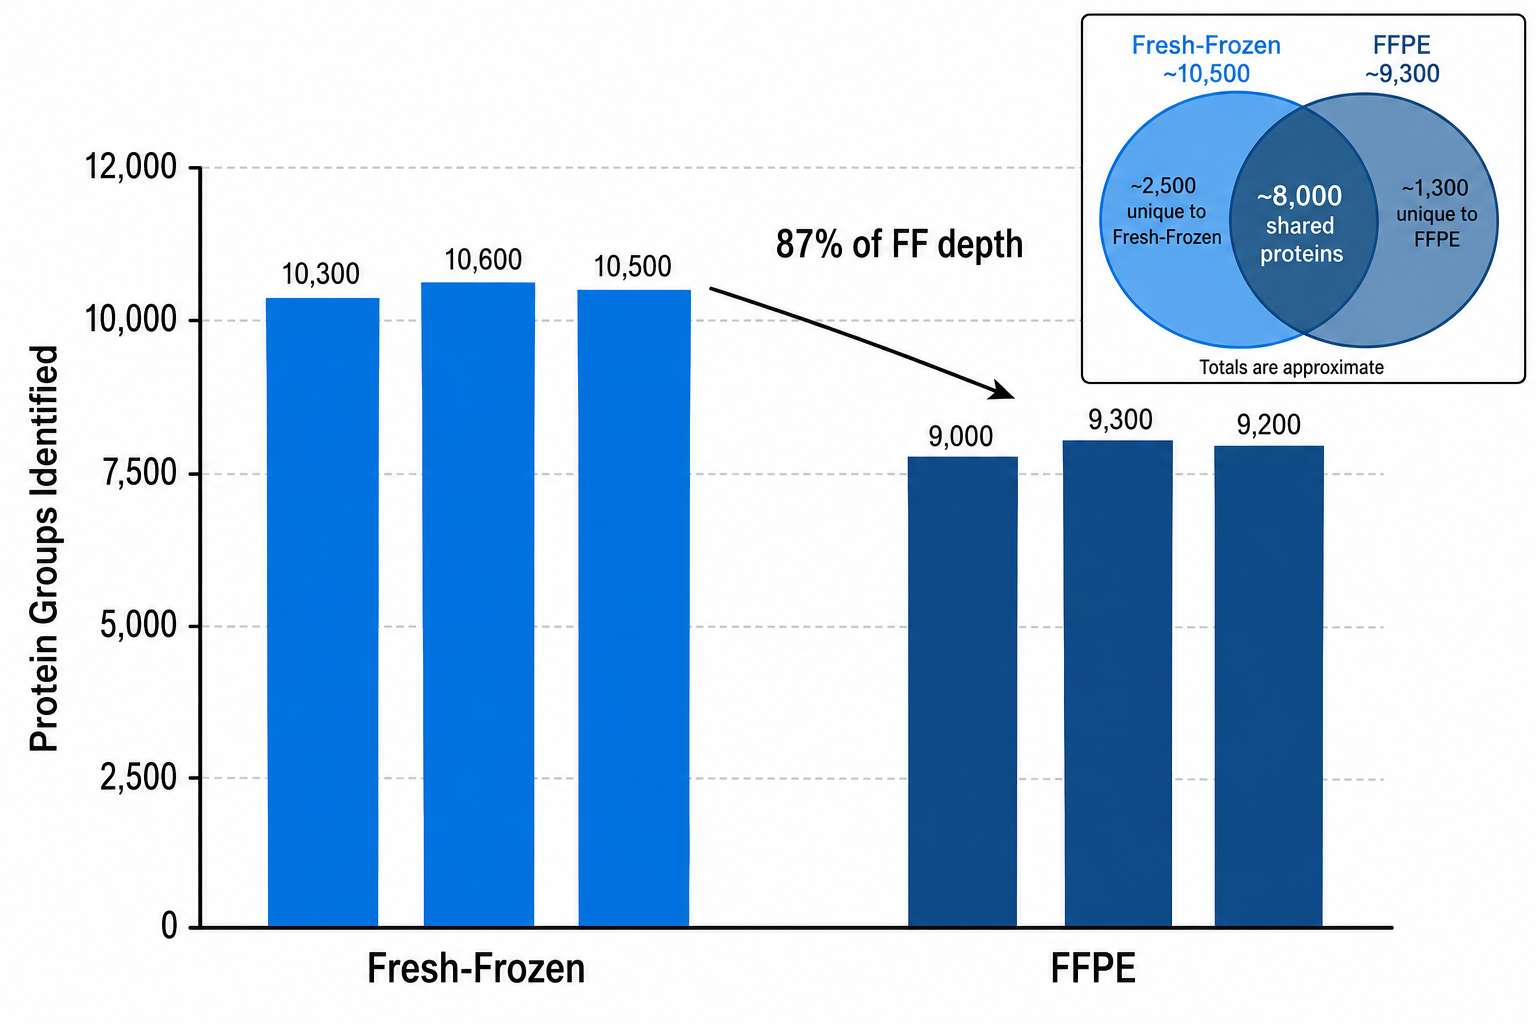
FFPE vs fresh-frozen comparison — DIA proteomics from FFPE tissue identifies 9,000+ proteins, reaching >85% of the depth achievable from paired fresh-frozen samples.
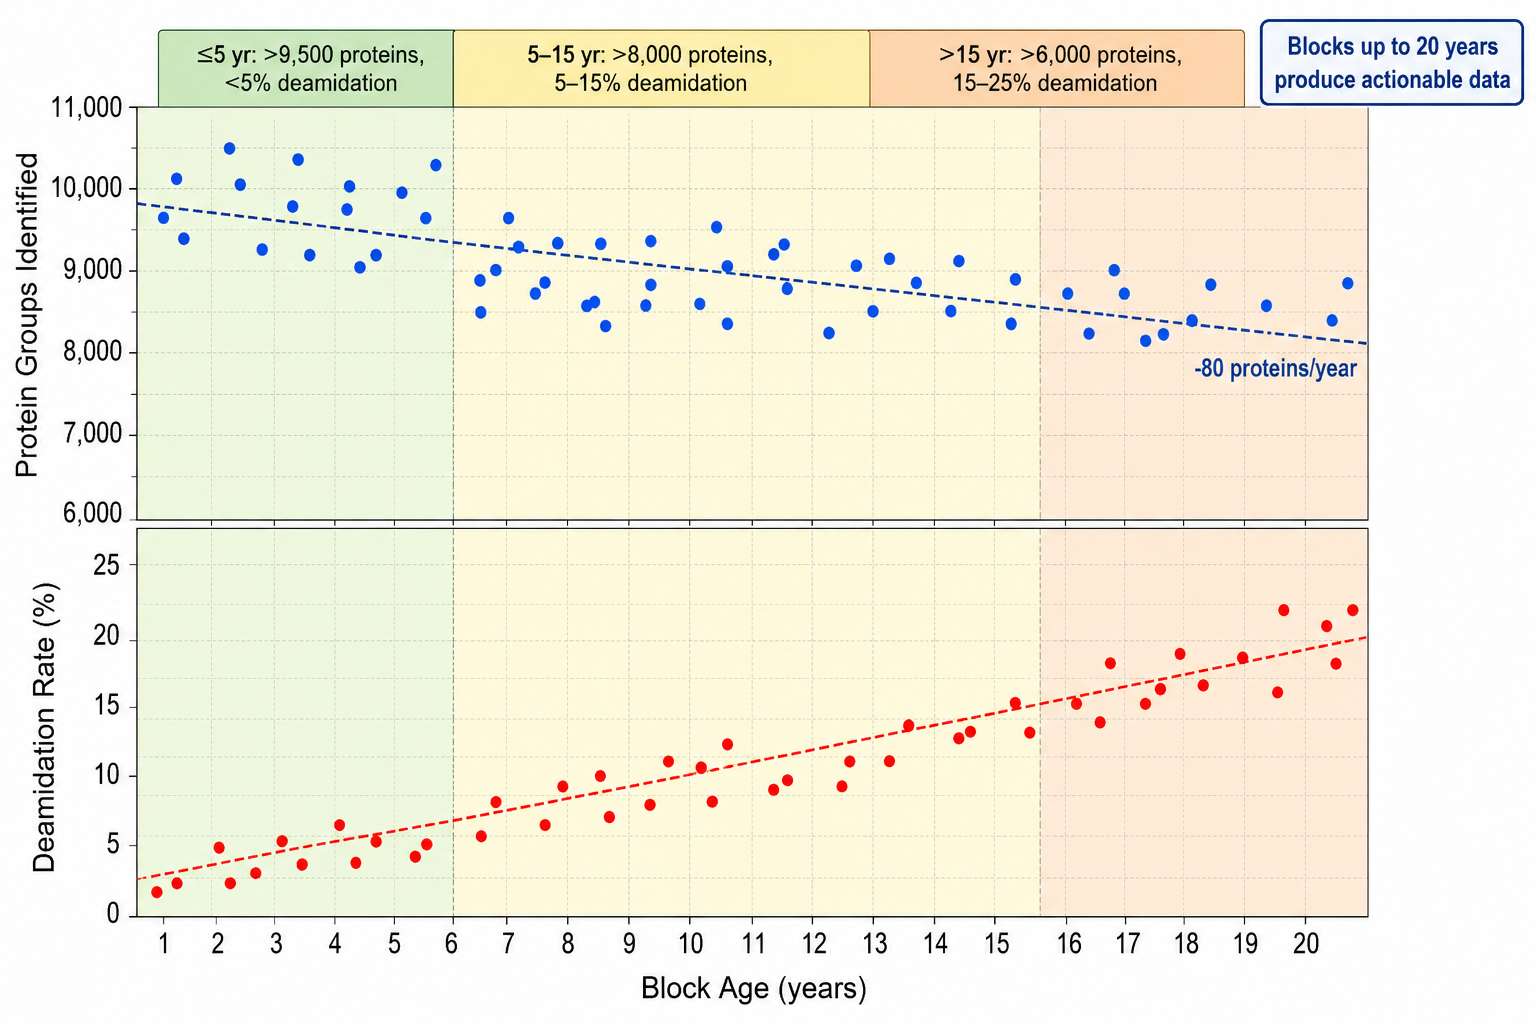
Blocks up to 20 years old yield actionable proteomics data — protein IDs decline gradually (~80 proteins/year), with deamidation rates rising but remaining manageable below 15 years.
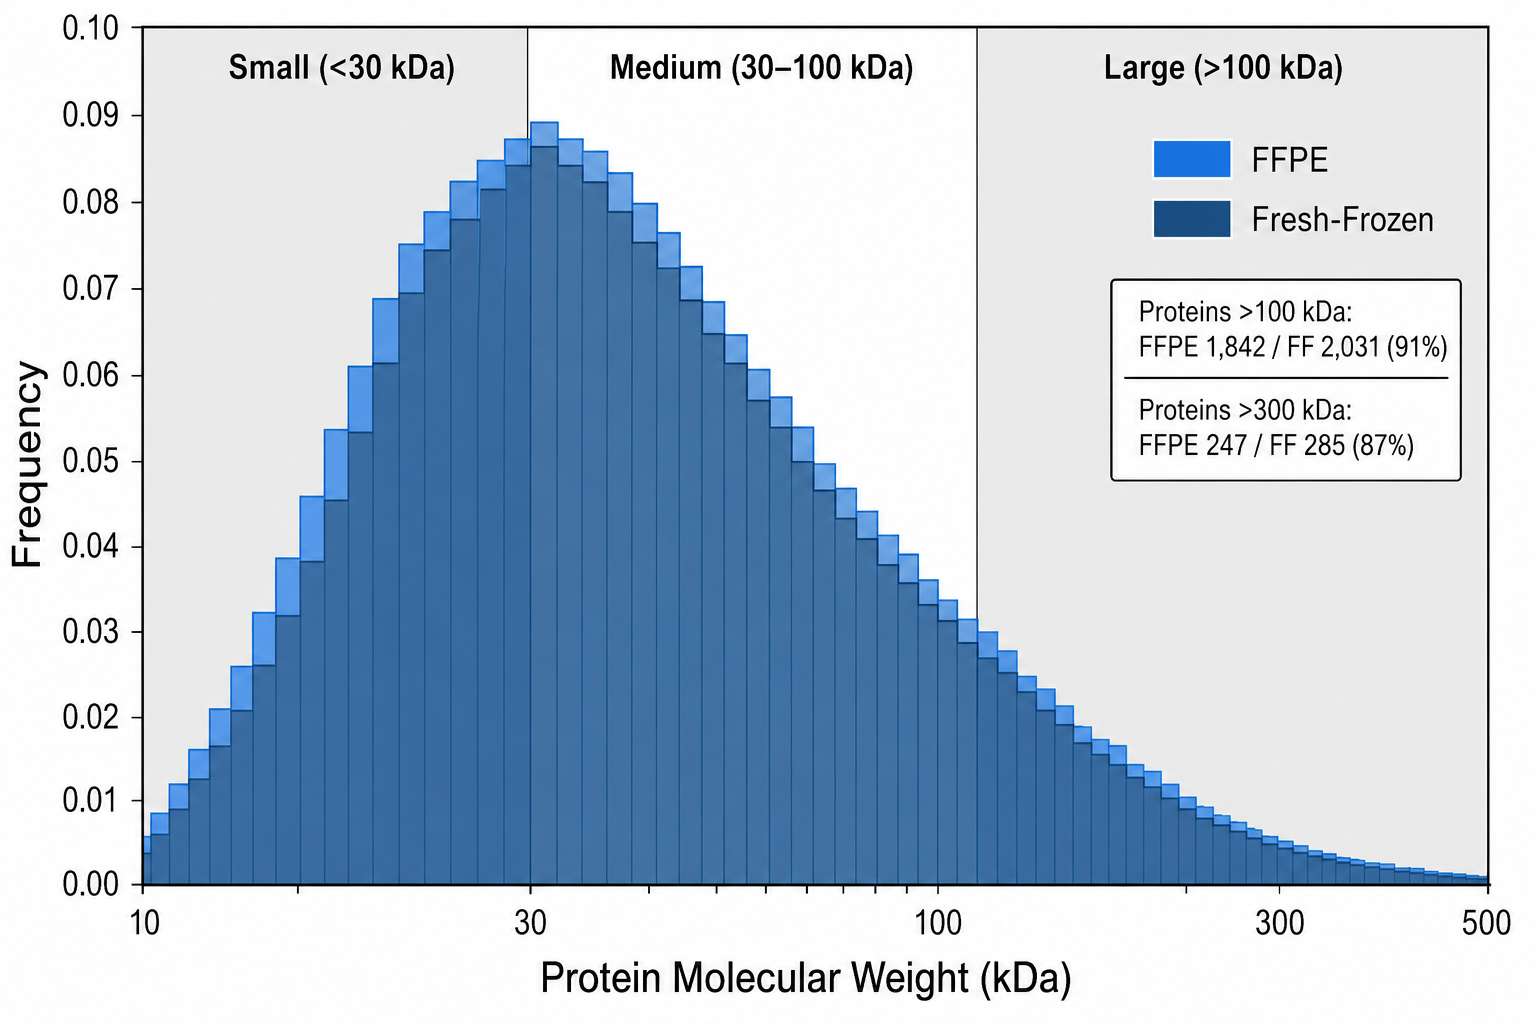
FFPE extraction recovers proteins across the full molecular weight range — large proteins (>100 kDa) at 91% of fresh-frozen levels, with no bias toward small fragments.
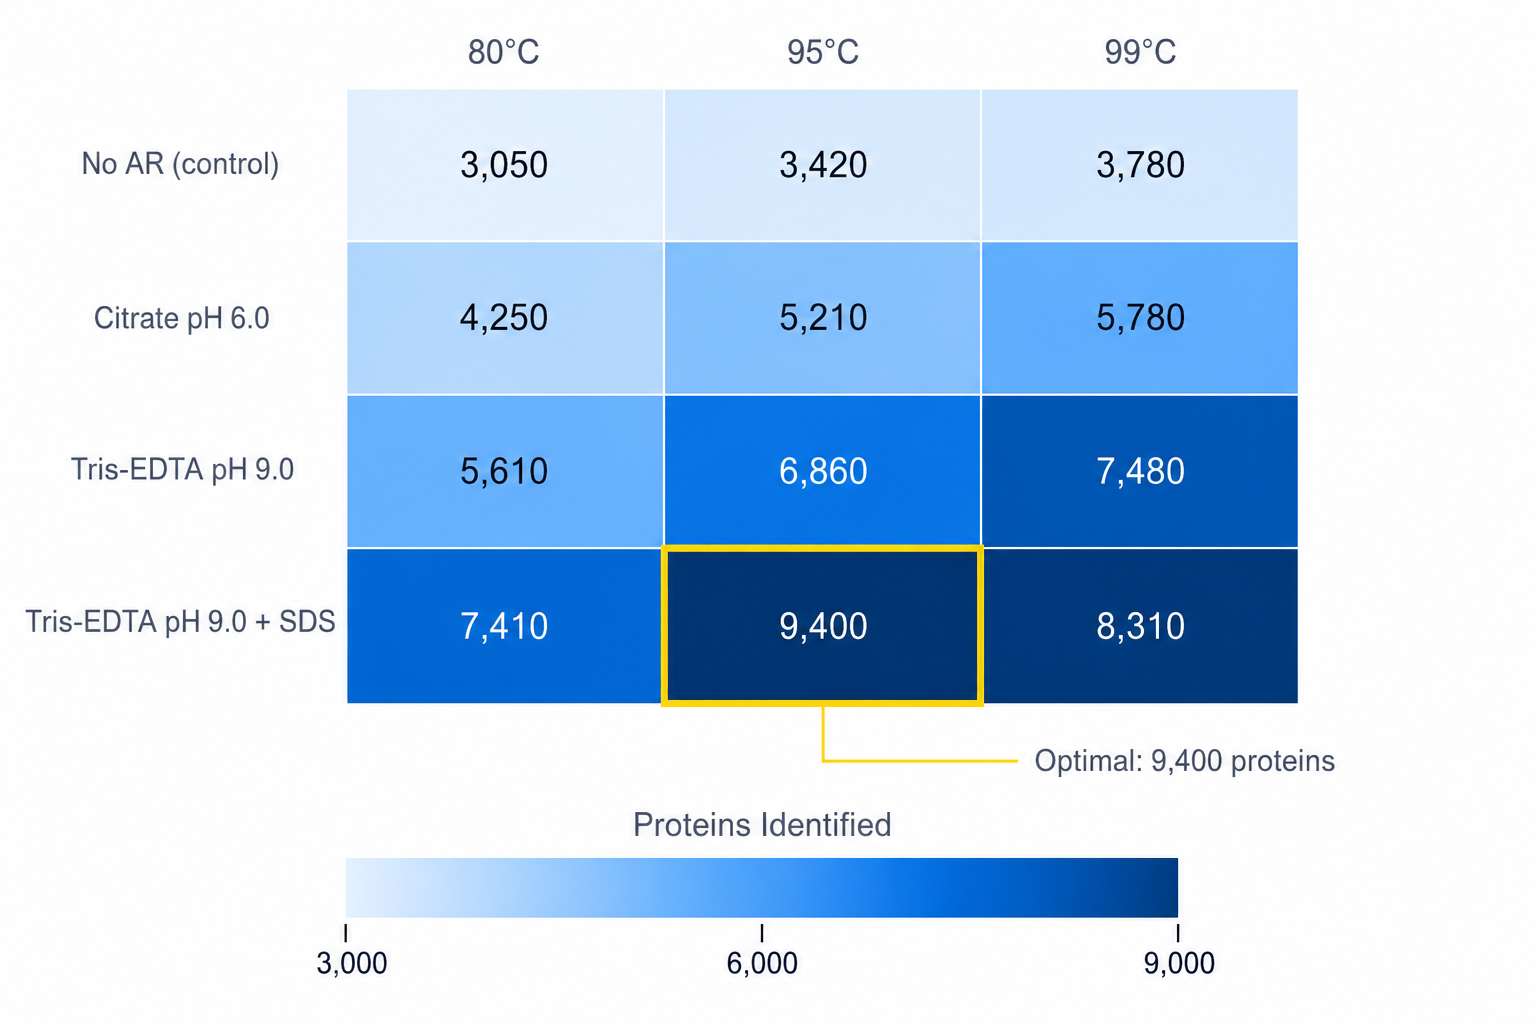
Antigen retrieval was systematically optimized — 4 buffer conditions tested at 3 temperatures. Tris-EDTA pH 9.0 with SDS at 95°C delivers the highest protein yield from FFPE tissue.
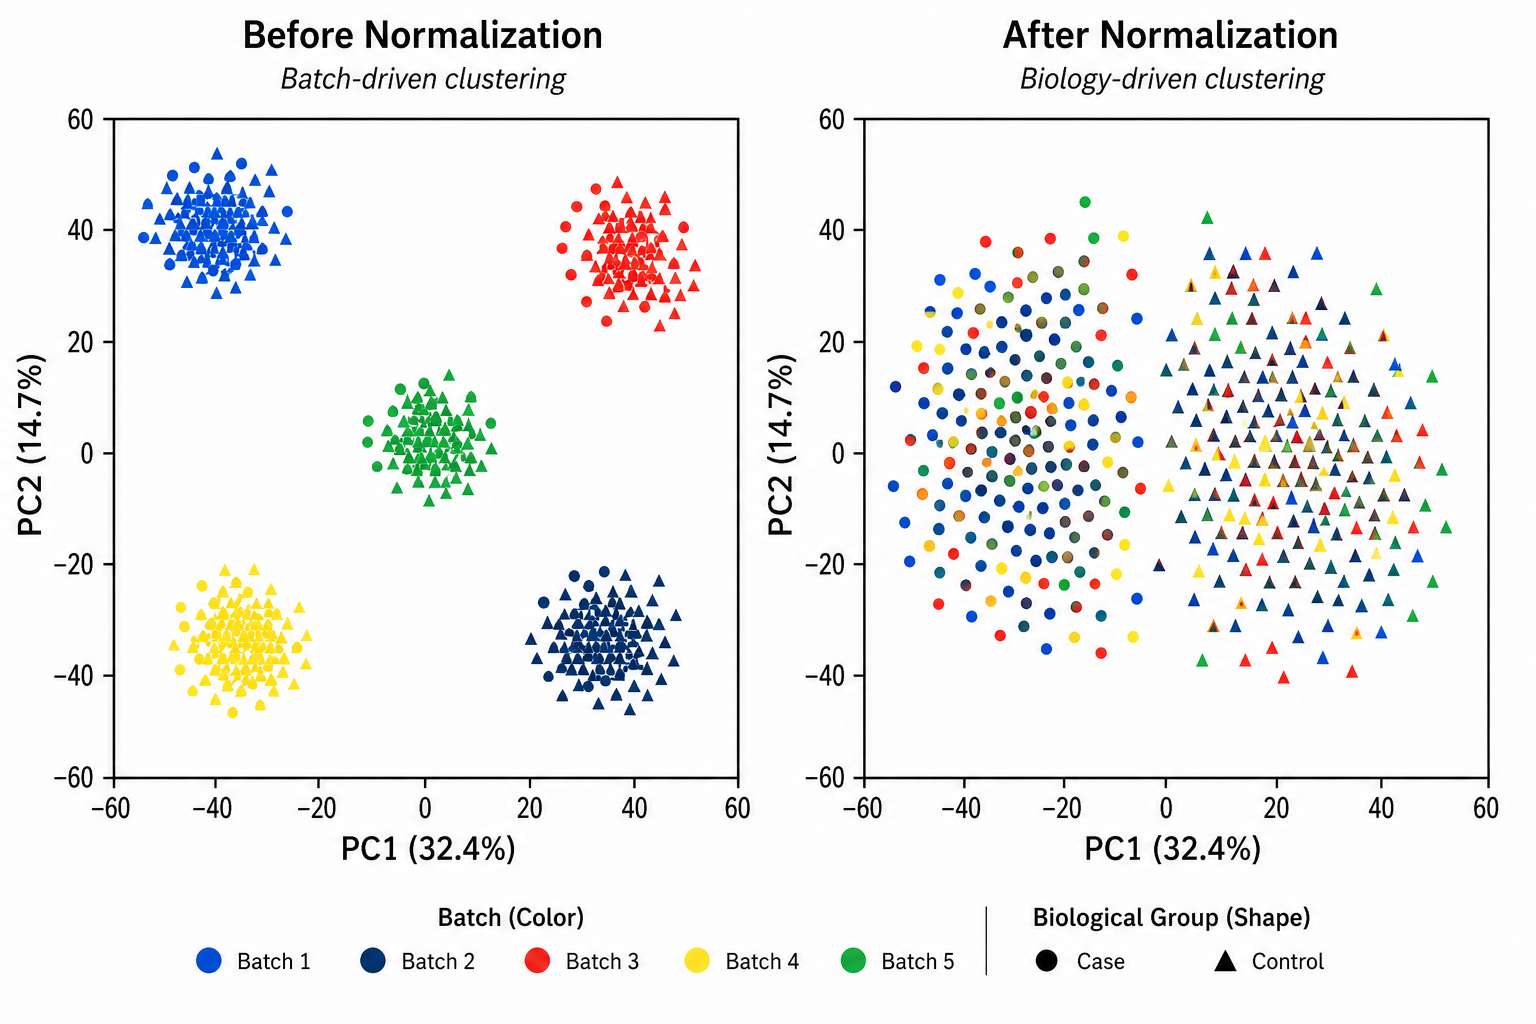
Batch effects resolved — TIC-based normalization collapses batch-driven clustering (left) into biological group separation (right), preserving true signal across your multi-batch FFPE cohort.
Standard Deliverables Checklist
- Protein identification and quantification matrix
- PCA, correlation heatmaps, sample clustering
- Differential expression analysis with statistics
- GO, KEGG, Reactome pathway enrichment
- Protein-protein interaction network analysis
- Survival analysis (Kaplan-Meier + Cox regression)
- Biomarker ROC analysis and panel development
- Raw MS data files (.d or .raw format)
- Complete QC report with batch metrics
- Detailed experimental methods documentation
FFPE Proteomics Frequently Asked Questions
We have successfully analyzed FFPE blocks up to 20 years old. The limiting factor is not chronological age but storage conditions — blocks stored at ambient temperature in dry, dark conditions preserve protein integrity far better than those exposed to humidity or temperature fluctuations.
Older blocks (>10 years) may show moderately reduced protein yield and a slight increase in non-enzymatic modifications (deamidation, oxidation), but DIA acquisition handles these modifications well. When working with very old or questionably stored blocks, we recommend a pilot run on 2–3 representative samples to establish baseline coverage before committing to the full cohort.
Every FFPE proteomics project includes: differential expression analysis (moderated t-test or ANOVA), PCA and hierarchical clustering, pathway enrichment (GO/KEGG/Reactome), and PPI network analysis. For clinical cohort studies, we also include univariate survival analysis (Kaplan-Meier curves stratified by protein expression tertiles or quartiles) and ROC analysis for individual biomarker candidates.
Advanced options — recommended for studies with >50 samples and clinical metadata — include: LASSO or elastic net regression for multi-marker panel development, Cox proportional hazards regression adjusted for clinical covariates, consensus clustering for molecular subtyping, and WGCNA for co-expression network analysis. We tailor the bioinformatics package to your clinical question and sample size.
Case Study: Pan-Cancer Proteomics Across 1,220 FFPE Clinical Specimens
1,220
FFPE tumor specimens
6
cancer types analyzed
~11,000
proteins identified
~4,000
proteins per sample avg.
The Challenge: FFPE Proteomics at Population Scale
Hospital pathology archives contain millions of FFPE tissue blocks with linked clinical outcome data. If these could be analyzed systematically by proteomics, they would represent an unprecedented resource for biomarker discovery. But FFPE proteomics has historically been limited to small proof-of-concept studies — the technical hurdles of crosslink reversal, variable protein recovery, and batch-to-batch reproducibility had prevented scaling to hundreds or thousands of samples.
How FFPE Proteomics Was Validated at Clinical Scale
A team at the Technical University of Munich set out to make FFPE proteomics routine. They assembled 1,220 FFPE tumor specimens across six cancer types — glioblastoma, oral squamous cell carcinoma, diffuse large B-cell lymphoma, pancreatic adenocarcinoma, colorectal cancer, and melanoma — and processed them over three years using a standardized workflow. The key innovation was a TIC-based peptide loading normalization method that eliminated the need for individual protein quantification prior to MS injection, dramatically simplifying the pre-analytical pipeline.
Samples were analyzed on an Evosep One LC system coupled to an Orbitrap Exploris 480 with FAIMS Pro interface. The resulting dataset identified approximately 11,000 protein groups across the cohort, averaging 4,000+ proteins per individual sample — performance comparable to fresh-frozen tissue proteomics at a fraction of the pre-analytical effort.
| Metric | Result | Implication for Your FFPE Study |
|---|---|---|
| Study scale | 1,220 samples / 6 cancer types | Proves FFPE proteomics is viable at clinical cohort scale |
| Proteome coverage | ~11,000 proteins total; ~4,000/sample avg. | Sufficient depth for pathway analysis and biomarker discovery per individual specimen |
| Cancer-type separation | UMAP clustering cleanly separates 6 entities | FFPE proteomics captures tissue-of-origin and cancer-type-specific signatures |
| Data resource | Public interactive Shiny App available | Benchmark dataset for validating your own FFPE proteomics results |
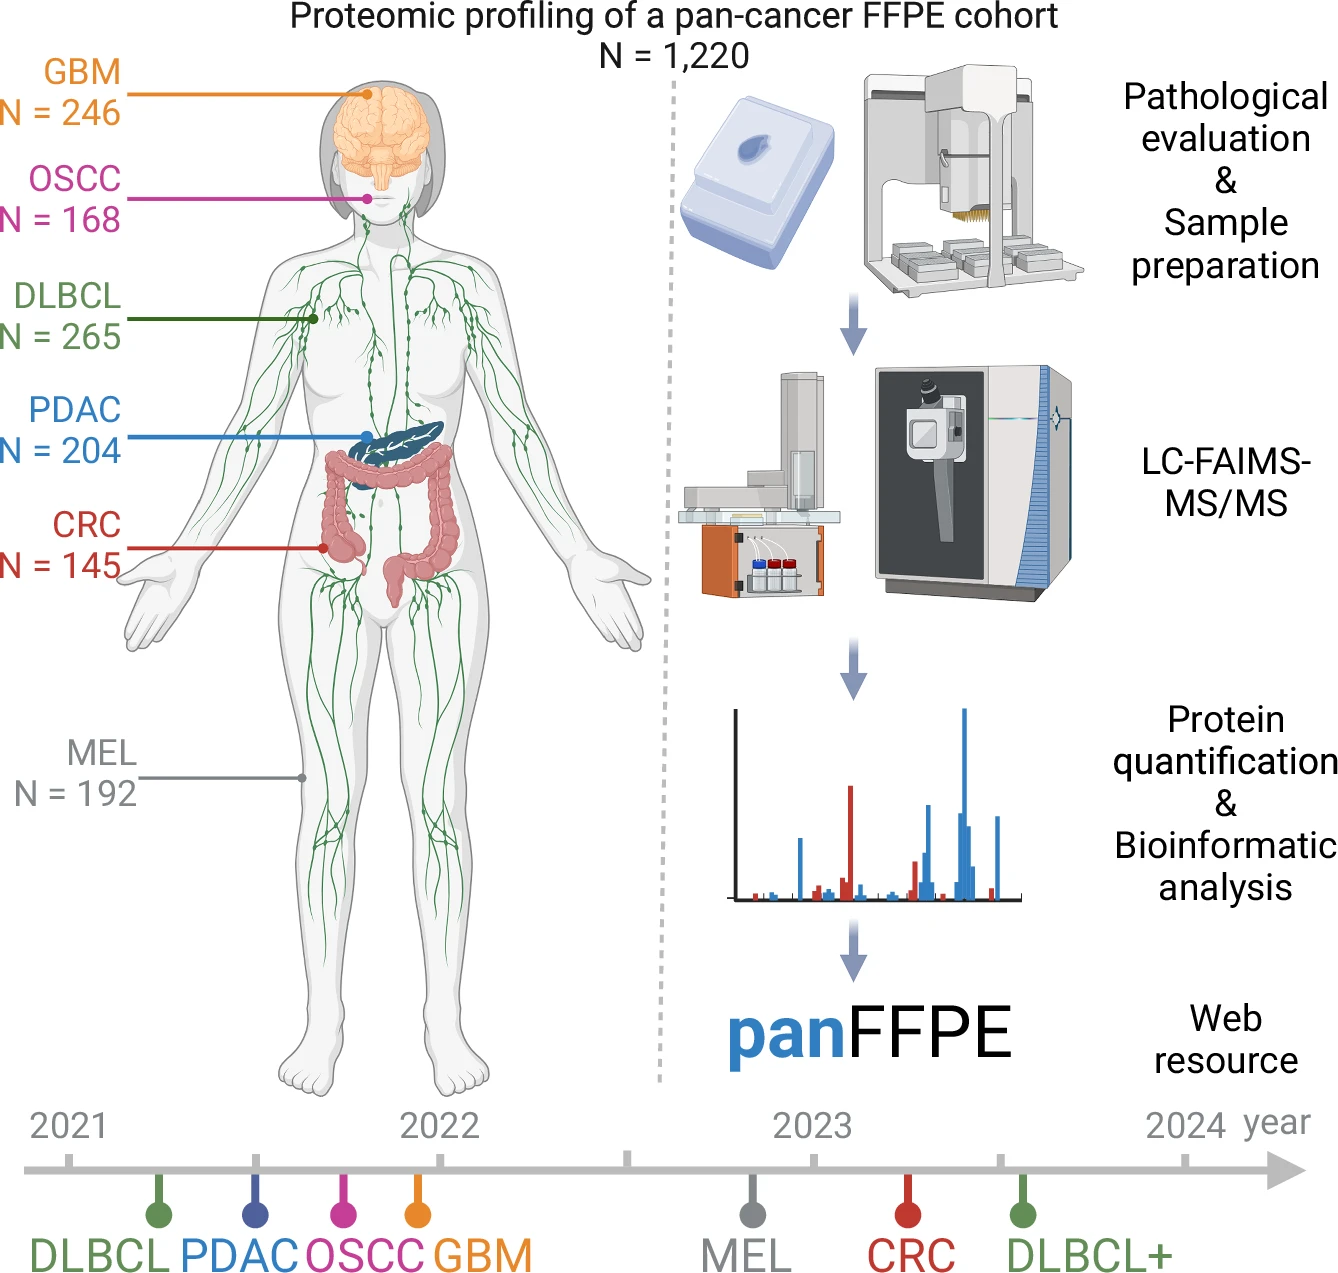
Study overview: 1,220 FFPE specimens from 6 cancer types processed over 3 years with a standardized DIA workflow — demonstrating the scalability of FFPE proteomics for clinical cohort studies.
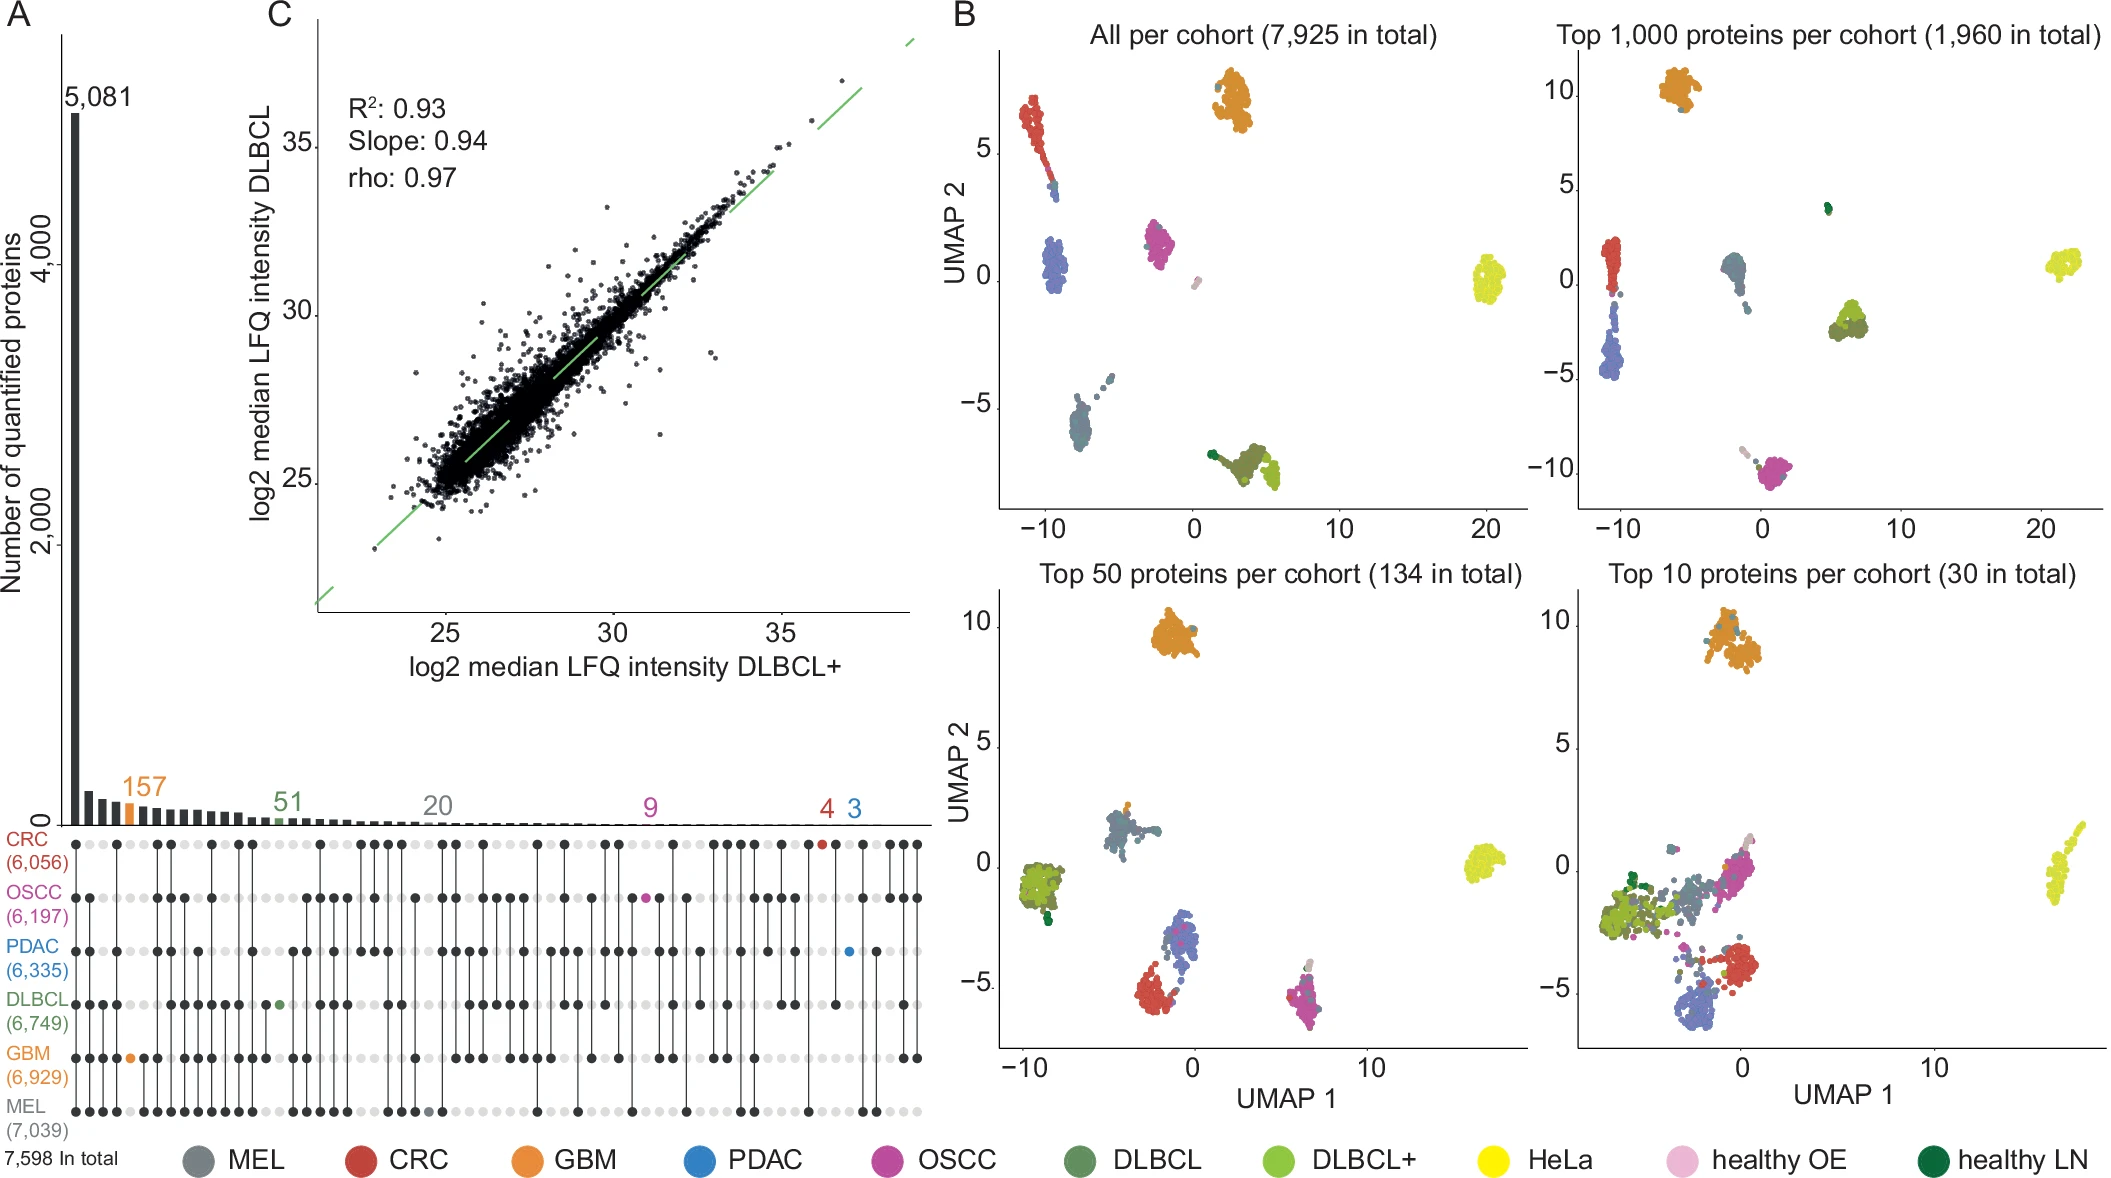
Global proteome comparison: UMAP clustering of all 1,220 FFPE proteomes cleanly separates samples by cancer type, confirming that FFPE-derived proteomics data preserves tissue-specific and disease-specific molecular signatures.
What This Means for Your FFPE Proteomics Study
- FFPE proteomics at scale has been demonstrated, not merely proposed. The EMBO Journal study processed 1,220 samples with consistent data quality across three years. Your retrospective FFPE cohort — whether 50 or 500 samples — falls well within the range validated by published data.
- Standard FFPE sections produce deep proteome coverage. An average of 4,000 proteins per individual FFPE specimen is sufficient for pathway-level biological interpretation, biomarker candidate identification, and molecular subtyping — without needing fresh-frozen tissue.
- Proteomic data from FFPE preserves cancer-type identity. UMAP clustering cleanly separated six cancer entities based on proteome profiles alone, confirming that FFPE-derived data captures biologically meaningful and disease-relevant protein expression patterns.
- The complete dataset is publicly available as a benchmark. The accompanying Shiny App ([panffpe-explorer.kusterlab.org](https://panffpe-explorer.kusterlab.org/)) allows you to explore the pan-cancer FFPE proteome before designing your own study — see how your proteins of interest behave across cancer types.
Reference: Tüshaus J, Eckert S, Schliemann M, et al. Towards routine proteome profiling of FFPE tissue: insights from a 1,220-case pan-cancer study. The EMBO Journal. 2025;44:304–329. doi:10.1038/s44318-024-00289-w