Proteomics Service
The high-throughput proteomics approaches employed by Creative Proteomics are powerful tools that facilitate the identification and quantification of thousands, or even millions, of proteins from a single analysis for large-scale protein profiling. Importantly, equipped with a highly experienced technical team and a senior bioinformatics data processing team, we possess the capability to handle diverse sample types and provide comprehensive investigations, encompassing whole proteome profiling, subcellular proteomics analysis, PTMs characterization,protein-protein interaction assessment, and monitoring of protein turnover dynamics. We are also professional in small protein (length<100), or peptidomics investigation.
Submit Your Request Now
×
- Overview
- Proteomics Service
- Technical Platforms
- Workflow
- Applications
- Demo
- FAQs
- Case & Publications
- Sample Requirements
As one of the core contents of the "post-genome" era, proteomics directly and comprehensively analyzes the protein abundance or PTMs level of samples, and comprehends regulatory mechanisms such as protein function and interaction relationship that cannot be determined by genomics and transcriptomics. Importantly, proteins are direct products of genes; one gene sequence may produce two or more protein products. Even under different conditions or at different period, the cellular proteome may be completely different. Therefore, proteomics research is of great value for pathology, toxicology and pharmacokinetics investigation. The advancement of proteomics technologies has significantly enhanced the opportunities for identifying diagnostic markers of diseases and screening potential drug targets.
What is Proteomics?
The field of proteomics involves a comprehensive and systematic investigation into the complete repertoire of proteins expressed by organisms or cells, encompassing information on protein expression abundances, variations and degradation, post-translational modifications (PTMs), as well as their interacting partners and networks. By conducting qualitative, quantitative, molecular function analysis, pathway analysis and protein interaction analysis of the proteome, proteomics can better reveal biological functions, mechanisms, prediction of upstream and downstream changes in proteins and disease markers for diagnosis. Besides, proteomics can overcome the uncertainty of nucleic acid level prediction and reflect translation results. Importantly, MS-based proteomics has undergone rapid development and significant maturation over the past few decades that collectively contribute greatly to our understanding of protein functions and biological systems.
Proteomics Service in Creative Proteomics
Service Contents
- Protein Post-translational Modification Analysis
- Protein-Protein Interaction Networks
- Protein Gel and Imaging
- Protein Identification Services
- Protein Quantification
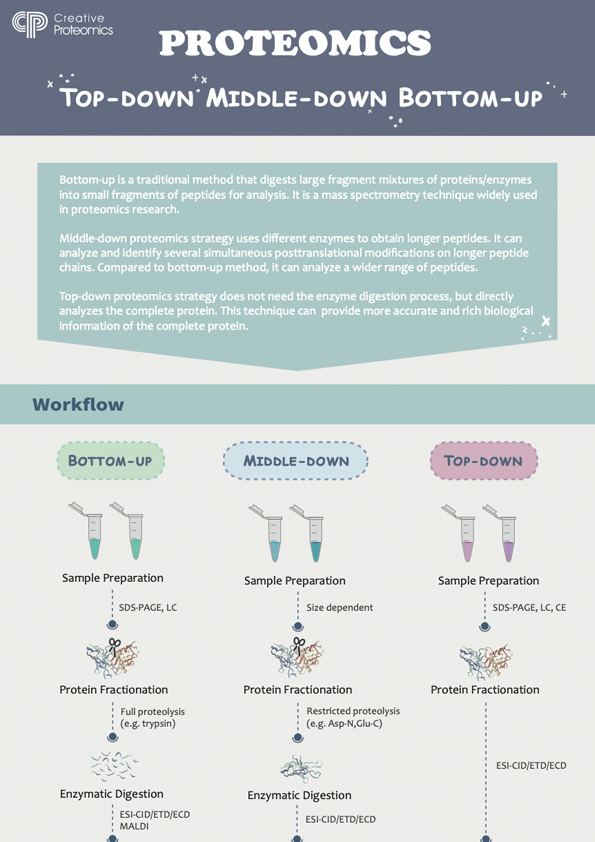
- Top Down Proteomics
- Peptidomics Analysis
- Subcellular Proteomics Service
- Exosome Proteomics
- Cell Surface Proteomics
- Plasma/Serum Proteomics Service
- Others Service
Protein Post-translational Modification Analysis
- Crotonylation Proteomics Analysis Service
- Protein Glutathione Sites Identification Service
- Histone PTMs Analysis Service
- Identification of Protein Hydroxylation Site
- Palmitoylation Site Identification Service
- Propionylation Analysis Service
- Protein Lipidation Analysis Service
- S-prenylation Site Identification Service
- Succinylation Analysis Service
Peptidomics Analysis
Subcellular Proteomics Service
Focuses on proteomic analysis of specific organelles, including membranes, chloroplasts, mitochondria, and exosomes, to elucidate their protein compositions and functions.
Exosomes, lipid vesicles secreted by cells, carry proteins, lipids, and RNA, playing key roles in cell communication, immune response, and disease processes. Our service provides precise exosome isolation, advanced mass spectrometry, and bioinformatics for detailed protein profiling and biomarker discovery.
Cell surface proteins mediate vital cellular functions like signaling and immune recognition. Creative Proteomics employs cutting-edge LC-MS/MS technologies and advanced enrichment methods to ensure accurate identification and quantification.
Plasma/Serum Proteomics Service
Blood proteomics investigates circulating proteins for disease biomarkers. Advanced mass spectrometry and bioinformatics workflows enable analysis of plasma and serum proteins, focusing on low-abundance, early disease markers.
We provide customized proteomics services tailored to your specific research needs, ensuring flexibility and reliable, high-quality results.
Analytics Platform for Proteomics Services
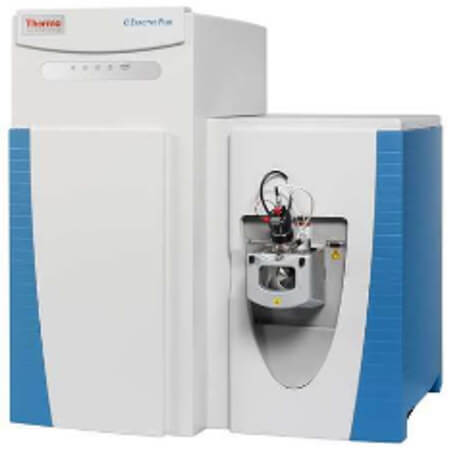
Thermo Q ExactiveTM series
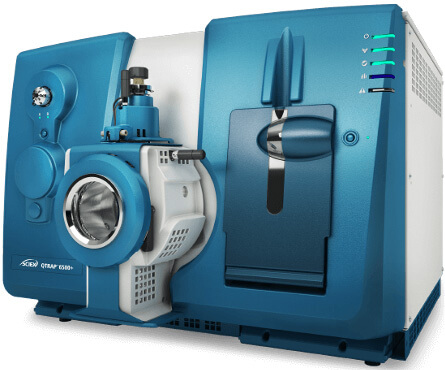
AB Sciex 6500+
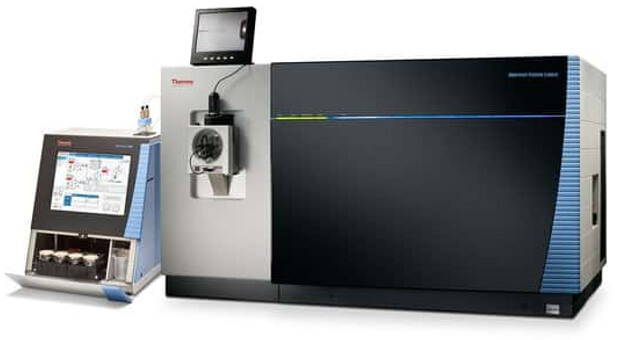
Thermo Orbitrap Fusion Lumos
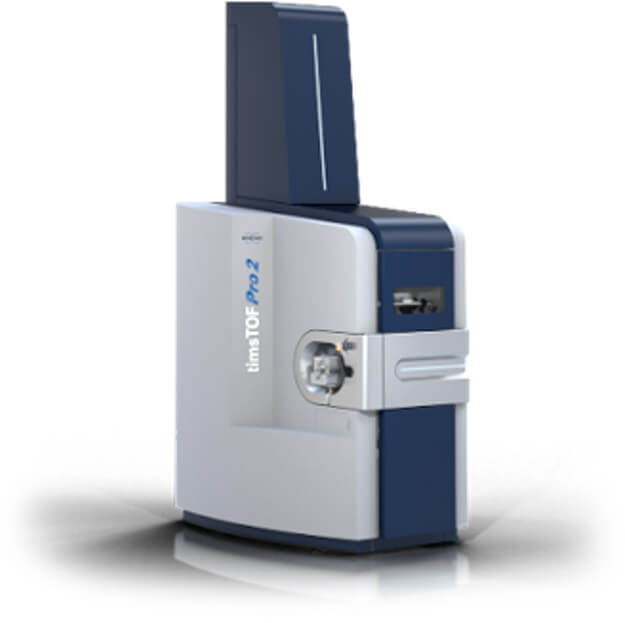
Bruker timsTOF Pro
Workflow of Our Proteomics Services
In Creative Proteomics, we will professionally design for your project as figure 1. The classical process is: 1) Project design; 2) Protein fractionation; 3) Peptide fractionation; 4) Mass spectrometry; 5) Data identification and analysis; 6) Quantification.
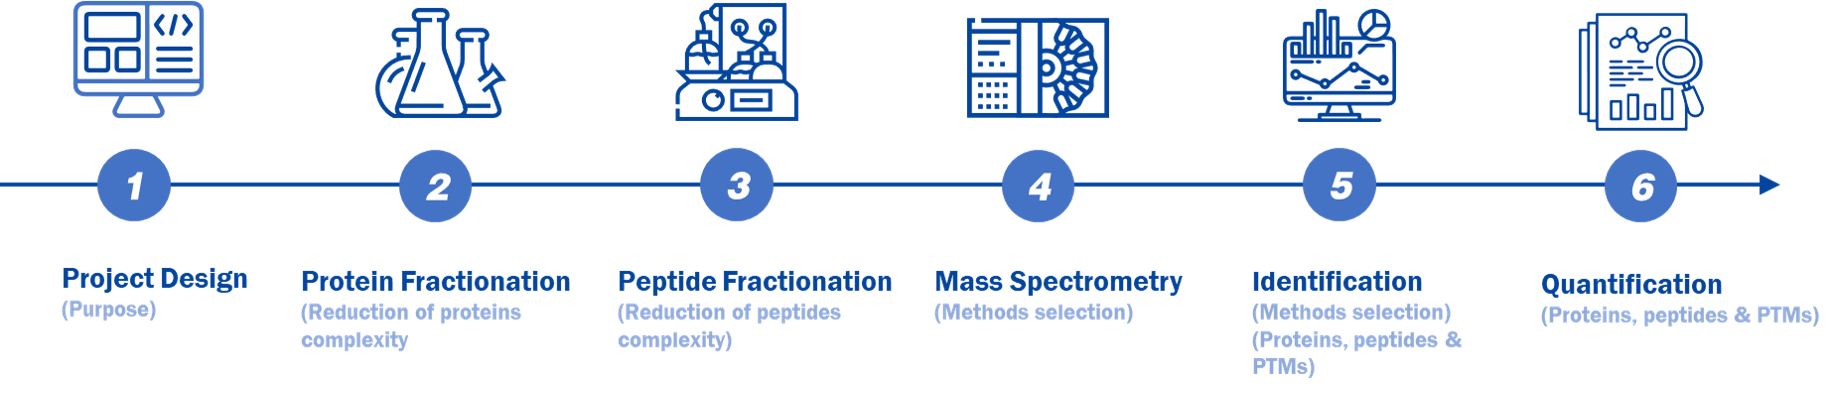 Figure 1. A typical MS-based proteomic workflow.
| Experimental Procedure | Technical Methods |
|---|---|
| Project Design (Purpose) | Untargeted proteomics Targeted proteomics PTMs proteomics |
| Protein Fractionation (Reduction of proteins complexity | 1D or 2D gel electrophoresis |
| Peptide Fractionation (Reduction of peptides complexity) | Reversed phase High Performance Liquid Chromatography (RP-HPLC) |
| Mass Spectrometry (Methods selection) | lon Source
Mass Analyzer
lon Activation
MS scanning modes
|
| ldentification (Methods selection) (Proteins, peptides & PTMs) | Database searching
|
| Quantification (Proteins, peptides & PTMs) | Label
Absolute quantification (AQUA, Qcon CAT) |
The Main Contents of Proteomics Research


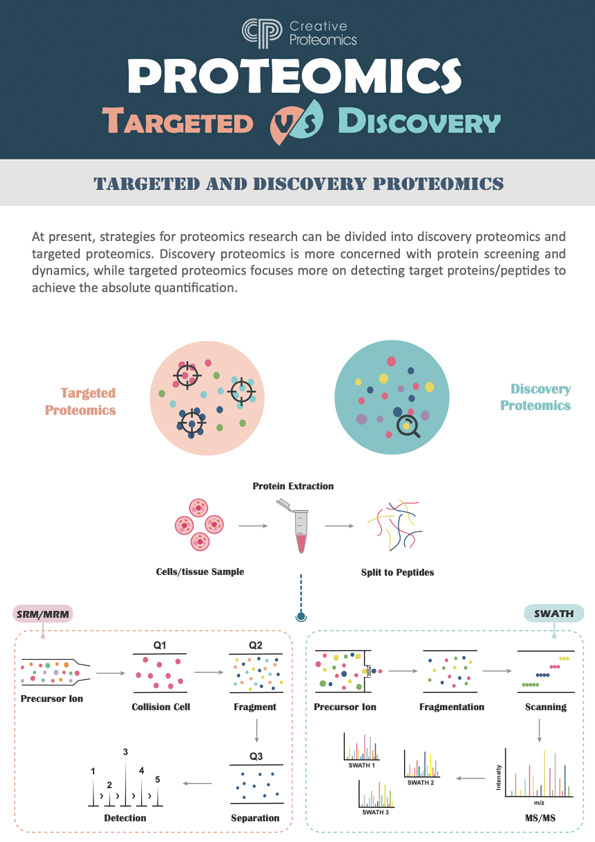
Discovery Proteomics
Proteomics identifies and catalogs proteins in biological samples, revealing uncharacterized proteins and post-translational modifications using mass spectrometry.
Targeted Proteomics
Targeted proteomics quantifies specific proteins using MRM and PRM, offering high sensitivity for studying pathways and diseases.
Differential Proteomics
Differential proteomics identifies proteins with altered expression between conditions, revealing disease mechanisms and potential biomarkers.
Functional Proteomics
Functional proteomics explores protein roles in cellular processes, including signaling, metabolism, gene regulation, and protein interactions.
Structural Proteomics
Structural proteomics studies protein structures using techniques like X-ray crystallography, NMR, cryo-EM, and modeling.
Spatial Proteomics
Spatial proteomics studies protein localization in cells, tissues, or organs using techniques like fluorescence microscopy and MALDI imaging.
Demo for Proteomics
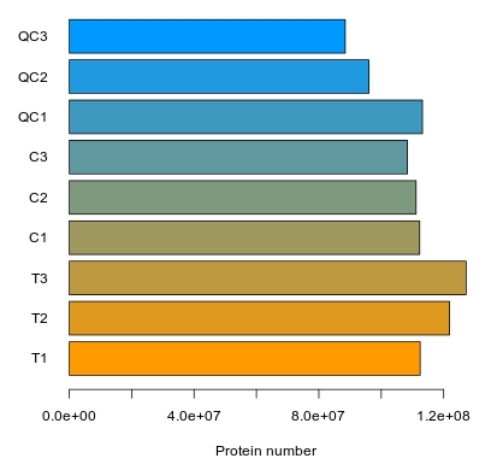
Bar Chart of Total Protein Identification
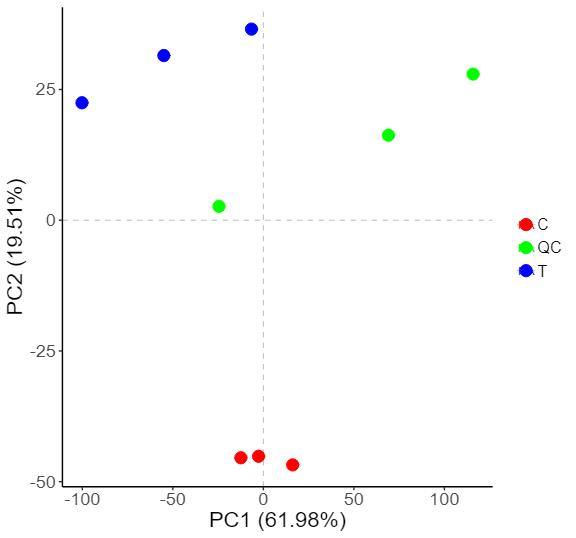
2D PCA Plot of Sample Grouping
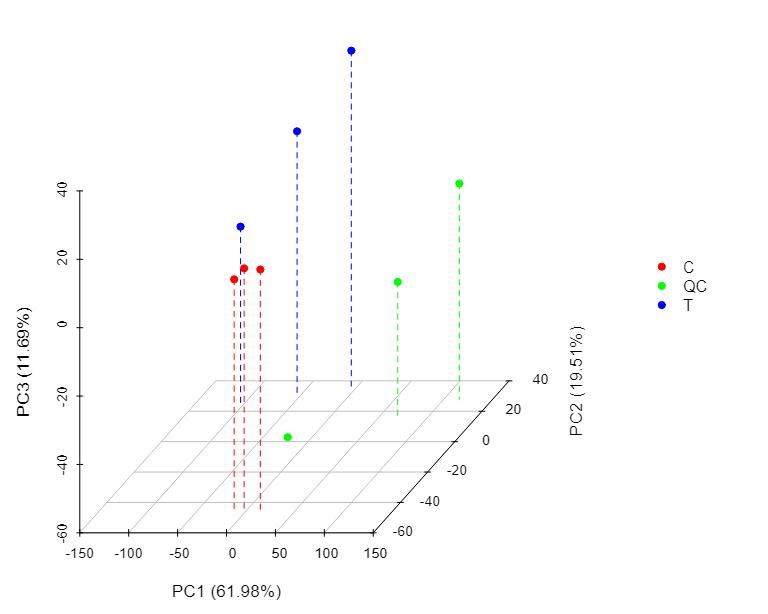
3D PCA Plot of Sample Grouping
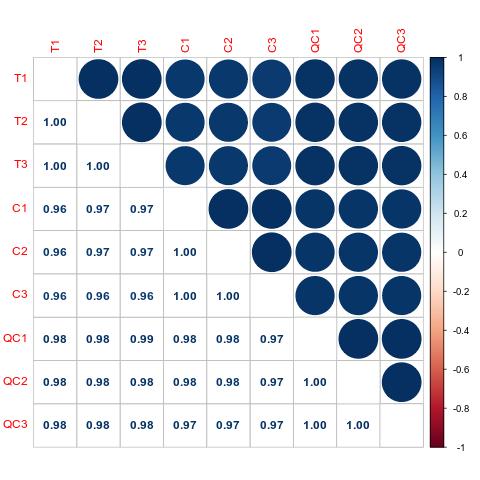
Pearson Correlation Analysis
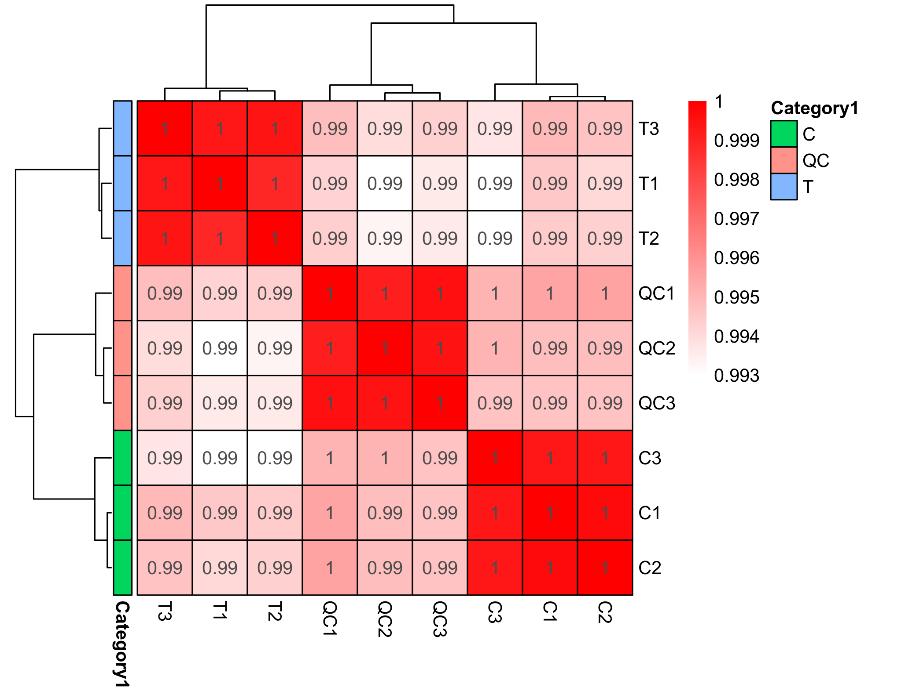
Sample Hierarchical Clustering
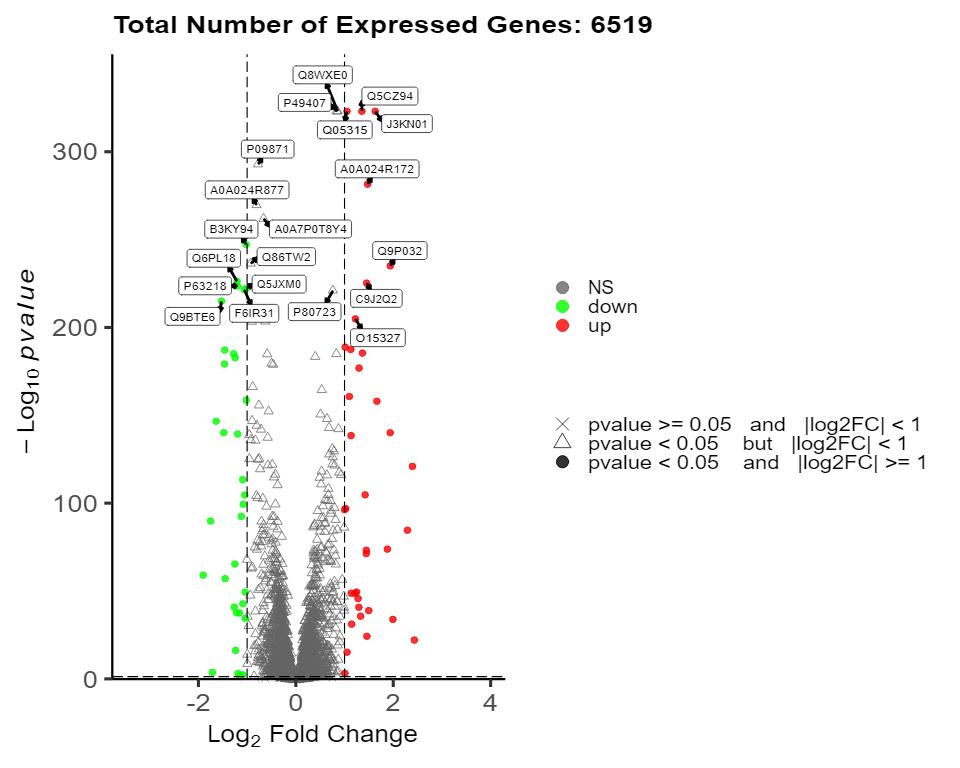
Volcano Plot of Differential Proteins
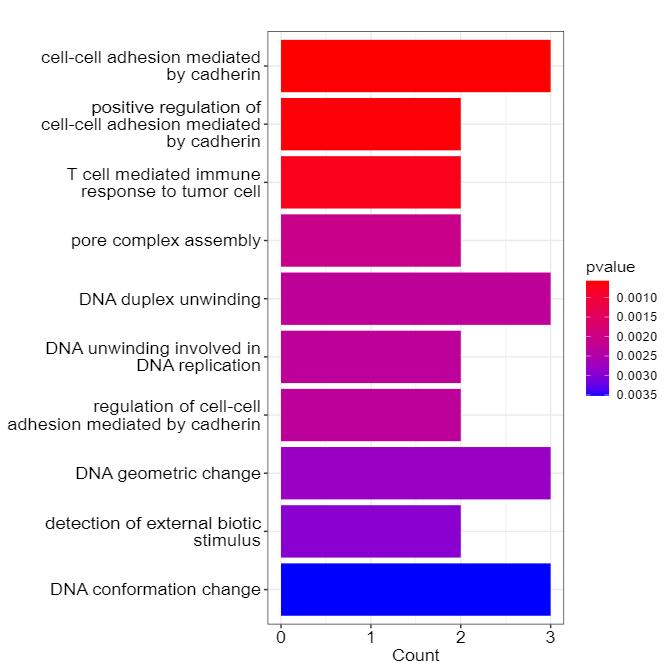
Bar Chart of GO Enrichment for Candidate Proteins
KEGG Pathway Enrichment of Candidate Proteins
Proteomics FAQs
How many biological replicates are generally recommended for proteomics?
In principle, the more biological replicates, the better, as this helps eliminate individual differences and results in more accurate identification of differential proteins, thereby increasing the success rate of validation. Considering budget constraints, statistical analysis requirements, and potential scrutiny from editors, it is recommended to have at least ten replicates per group for clinical samples, and at least three replicates per group for samples from other sources.
Which proteomics technique should I choose for my research?
TMT Labeling Technology: If your sample size is less than 18, TMT technology, which allows the simultaneous detection of up to 18 samples with good parallelism and accuracy, is recommended.
DIA Technology: If the sample size exceeds 16, DIA is more stable and reproducible, so it is recommended.
TMT vs. DIA: TMT can only detect proteins common to all samples and is not suitable for highly variable samples (e.g., different species or tissues). DIA, being label-free, can detect unique proteins in samples and is better for highly variable samples or when unique proteins are of interest.
Budget Constraints: If budget is a concern, Label-free technology can be chosen.
How should proteomics samples be shipped?
Standard biological samples such as tissues, cells, and fluids should be stored at low temperatures and shipped with dry ice. Gel strip samples can be shipped with ice packs.
Can proteomics detect unknown proteins or exogenous proteins not present in the sample species' database?
Proteomics results are compared against known protein databases, so unknown proteins cannot be predicted. If you need to detect unknown proteins, sequencing or other methods should be used. If the protein of interest is not in the database, it cannot be detected. However, the protein sequence can be added to the database as a search file for analysis.
Why are fewer proteins detected?
This could be due to a small database, leading to fewer detected results. You may expand the database or select a related, well-studied species or model organism database for analysis. Additionally, check the gel images to see if there are few bands in the sample itself or if high-abundance proteins are present, as high-abundance proteins can affect the detection quantity.
Why is there a significant difference between the molecular weight of identified proteins and those estimated from the gel electrophoresis?
Due to in vivo or in vitro factors, the same protein may undergo different modifications, cleavage, or degradation, resulting in protein bands of varying molecular weights seen on the gel electrophoresis. However, during mass spectrometry identification, these proteins point to the same theoretical, full-length, unmodified protein sequence in the database. Hence, the molecular weight seen in the gel (actual molecular weight) may differ from the identified protein's theoretical molecular weight.
How are differential proteins selected?
The criteria for selecting differential proteins mainly combine the p-value from a T-test and the FC (fold change) value. Generally, for labeled products, the criteria are FC > 1.2 or FC < 0.83, p < 0.05; for unlabeled products, FC > 1.5 or FC < 0.67, p < 0.05. During actual selection, the criteria can be relaxed or tightened, typically controlling within 20% of detected results, with 5-10% being optimal.
What validation methods should be used after proteomics?
The conventional protein validation methods include WB (Western Blot), ELISA, and PRM. If the number of proteins of interest is small and corresponding commercial test kits or antibodies are available, ELISA or WB is recommended for validation as these methods are more mature. If many proteins are of interest and commercial antibodies are unavailable, PRM is recommended. If the budget allows, antibody preparation is also a good option.
Why was the protein detected by Western Blot not detected by mass spectrometry or only detected with one peptide?
Western Blot detects target proteins by amplifying the signal many times, making it very sensitive and almost unaffected by the abundance of background proteins in complex samples (except for specificity binding). In mass spectrometry, proteins with higher abundance in the sample are preferentially detected multiple times, while lower-abundance proteins may be masked due to weak peptide signals and thus not detected. Therefore, if the target protein in the sample has low abundance, even if WB can detect it, mass spectrometry may not or may only detect a few peptides.
Why do transcriptomic data show downregulation while proteomics results show upregulation for the same batch of samples?
This is a normal phenomenon, as the relationship between upstream and downstream is not one-to-one. The conventional correlation coefficient between mRNA and proteins is only 0.4 to 0.5. The expression of a protein is controlled by many factors, including transcription factors, enhancers, inhibitors, and DNA and RNA modifications, in addition to the corresponding mRNA.
How can I improve protein yield from low-abundance samples?
For low-abundance samples, you can improve protein yield by:
- Enrichment Methods: Use protein enrichment techniques such as immunoprecipitation or fractionation to concentrate low-abundance proteins.
- Optimized Lysis Buffers: Choose lysis buffers that are effective for your specific sample type and contain protease and phosphatase inhibitors to prevent protein degradation.
- Concentrate Sample: Use techniques like ultrafiltration or lyophilization to concentrate the sample before analysis.
What are common challenges in proteomics data interpretation, and how can they be addressed?
Data Overload: Proteomics generates large datasets, which can be overwhelming. Using specialized bioinformatics tools and software can help manage and analyze the data efficiently.
False Positives/Negatives: Statistical noise or variability can lead to false positives or negatives. Applying stringent statistical criteria and validating key findings with independent methods like WB or ELISA can mitigate this.
Sample Heterogeneity: Biological variability between samples can complicate data interpretation. Ensuring sufficient biological replicates and proper experimental design can reduce the impact of sample heterogeneity.
How do I select the appropriate controls for a proteomics experiment?
- Negative Controls: Use samples that do not have the condition or treatment of interest to identify background noise or non-specific signals.
- Positive Controls: Include known proteins or peptides that should be detected to ensure the system is working correctly.
- Internal Standards: Adding stable isotope-labeled peptides or proteins as internal standards can help with quantitation and normalization across samples.
What factors should be considered when designing a proteomics experiment?
Negative Controls: Use samples that do not have the condition or treatment of interest to identify background noise or non-specific signals.
Positive Controls: Include known proteins or peptides that should be detected to ensure the system is working correctly.
Internal Standards: Adding stable isotope-labeled peptides or proteins as internal standards can help with quantitation and normalization across samples.
How can I address issues with protein solubility during sample preparation?
Protein solubility issues can be managed by:
- Choosing Appropriate Buffers: Use lysis buffers containing detergents (e.g., SDS, Triton X-100) or chaotropes (e.g., urea, guanidine hydrochloride) to solubilize proteins.
- Adjusting pH and Salt Concentrations: Modifying the pH or salt concentration in the buffer can improve solubility for specific proteins.
- Sonication or Mechanical Disruption: Applying sonication or mechanical disruption can help break down cellular structures and improve protein extraction.
Learn about other Q&A about other technologies.
Proteomics Case study

Publications
Here are some publications from our clients:

- Impact of alanyl-tRNA synthetase editing deficiency in yeast. 2021. https://doi.org/10.1093/nar/gkab766
- Pressure overload induces ISG15 to facilitate adverse ventricular remodeling and promote heart failure. 2023. https://doi.org/10.1172/JCI161453
- Hyperfunction of post-synaptic density protein 95 promotes seizure response in early-stage aβ pathology. 2024. https://doi.org/10.1038/s44319-024-00090-0
- Control of ribosomal protein synthesis by the Microprocessor complex. 2021. https://doi.org/10.1126/scisignal.abd2639
- Molecular signature of the ontogenic development of the prawn Macrobrachium tenellum. 2023. http://dx.doi.org/10.7717/peerj.16344
Why Creative Proteomics?
- Professional detection and analysis capability: Experienced research team, strict and matured techniques.
- Breadth: we could skillfully deal with protein samples derived from a wide range of sources, encompassing animal and plant tissues, bacteria, blood, membrane proteins, nuclear proteins, secreted proteins, etc.
- High stability and reproducible: Obtain consistent and reproducible inter- and intra- assay results for data analysis.
- High specificity and accuracy: Skillful quantification proteomics techniques, and PTMs enrichment methods.
- High resolution and sensitivity: Triple TOF 5600, Q-Exactive, Q-Exactive HF, Orbitrap Fusion™ Tribrid.
Sample Requirements
| Sample type | Recommended sample size | |
|---|---|---|
| Animal tissues | Hard tissues (bones, hair) | 300-500mg |
| Soft tissues (leaves, flowers of woody plants, herbaceous plants, algae, ferns) | 200mg | |
| Plant tissues | Hard tissues (roots, bark, branches, seeds, etc.) | 3-5g |
| Microbes | Common bacteria, fungal cells (cell pellets) | 100μL |
| cells | Suspension/adherent cultured cells (cell count/pellet) | >1*107 |
| Fluids | Plasma/serum/cerebrospinal fluid (without depletion of high abundance proteins) | 20μL |
| Plasma/serum/cerebrospinal fluid (with depletion of high abundance proteins) | 100μL | |
| Follicular fluid | 200μL | |
| Lymph, synovial fluid, puncture fluid, ascites | 5mL | |
| Others | Saliva/tears/milk | 3-5mL |
| Culture supernatant (serum-free medium cannot be used) | 20mL | |
| Pure protein (best buffer is 8MUrea) | 300μg | |
| FFPE | Each slice: 10µm thickness, 1.5×2cm area | 15-20 slices |
Reference
- Shibata, Hirofumi et al. "A Non-targeted Proteomics Newborn Screening Platform for Inborn Errors of Immunity." Journal of clinical immunology vol. 45,1 33. 25 Oct. 2024.