Fluorescence Colocalization Service
What is Fluorescence Colocalization?
Fluorescence colocalization analysis can be performed with a variety of fluorophores, including commonly used ones like GFP, RFP, and Cy dyes. The choice of fluorophore depends on your specific research needs, such as the spectral properties, compatibility with your sample type, and available imaging equipment. We can also accommodate custom fluorophores upon request to suit specialized applications.
At Creative Proteomics, we offer comprehensive Fluorescence Colocalization Services tailored to meet the diverse needs of researchers across academia and industry. With state-of-the-art instrumentation and a team of highly skilled scientists, we ensure accurate, reproducible, and high-resolution data to advance your scientific discoveries.
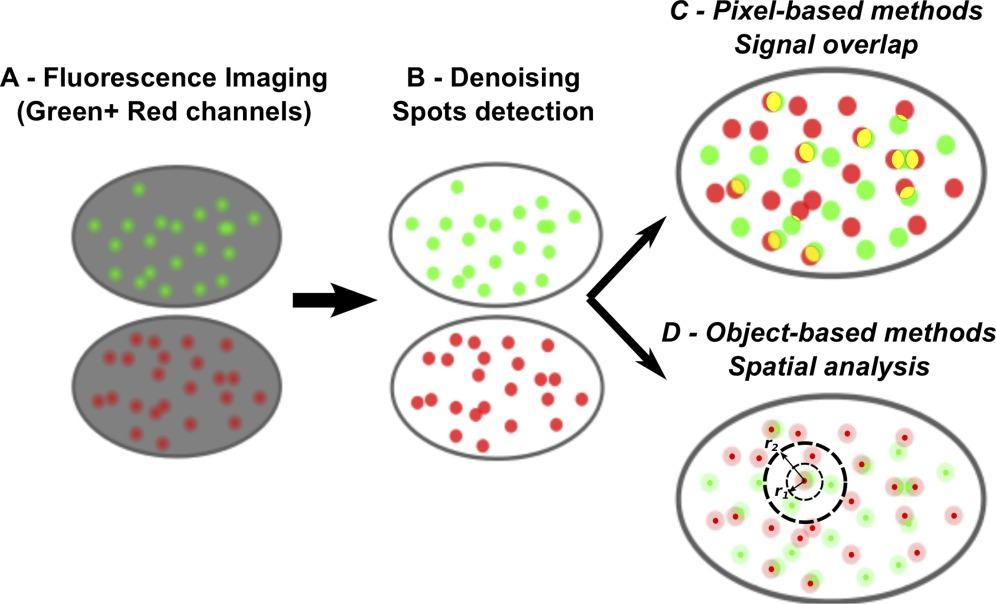
Figure 1. Principles of fluorescence colocalization analysis in microscopy.
Why is Visual Determination of Colocalization Insufficient?
Subjectivity: Overlapping fluorescent signals may appear colocalized, even when they are not. Interpretation can vary between individuals, leading to inconsistent results.
Resolution Limits: Fluorescent signals may seem to overlap due to the limitations of standard microscopy. Molecular interactions often occur below the resolution limit of conventional microscopy.
Complex Intensity Patterns: Variations in brightness or imaging conditions can create false positives. Autofluorescence or scattered light can hide true colocalization.
Lack of Quantitative Data: Visual analysis cannot provide the precise measurements needed to confirm colocalization.
Dynamic Interactions: Quantitative methods are necessary to study how interactions change over time.
How to Analyze Fluorescence Data?
Analyzing fluorescence colocalization data involves a series of steps to ensure accurate and reproducible results. These include:
Image Acquisition
High-quality fluorescence images are captured using advanced microscopes such as confocal or super-resolution systems. Proper settings for laser power, exposure time, and detector gain are crucial to minimize noise and photobleaching.
Image Preprocessing
Images are processed to remove artifacts such as background noise, photobleaching, or uneven illumination. Techniques like deconvolution or background subtraction are often applied.
Region of Interest (ROI) Selection
Specific regions within the image are selected for detailed analysis. ROIs help to focus on areas of biological significance while excluding irrelevant regions.
Quantitative Analysis
Pearson's Correlation Coefficient (PCC): Measures the linear correlation between the intensity distributions of two fluorophores.
Manders' Overlap Coefficient (MOC): Indicates the proportion of one fluorophore overlapping with another.
Intensity Profile Analysis: Tracks intensity variations across specific regions to identify patterns of colocalization.
Statistical Validation
Statistical tools and software are employed to ensure that the observed colocalization is not due to random chance. Commonly used software includes Fiji (ImageJ), Imaris, and CellProfiler.
Difference Between Fluorescence Colocalization and Bimolecular Fluorescence Complementation (BiFC)
| Aspects | Fluorescence Colocalization | BiFC |
| Definition | A microscopy technique to determine the spatial overlap of two fluorescently labeled molecules within a cell. | A technique that detects protein-protein interactions by reconstituting a fluorescent signal from two split fluorophore fragments. |
| Purpose | To study co-localization and potential interaction of molecules based on proximity. | To directly confirm physical interactions between two proteins. |
| Principle | Measures the overlap of fluorescence signals emitted by two distinct fluorophores. | Fluorescence occurs only when two non-fluorescent fragments of a split fluorophore come together due to protein interaction. |
| Fluorophore Design | Independent fluorophores are used to label the two molecules of interest. | The fluorophore is split into two non-fluorescent fragments, each fused to a protein of interest. |
| Proximity vs. Interaction | Indicates proximity but does not confirm direct interaction. | Confirms direct interaction by reconstitution of the fluorophore. |
| Resolution | High spatial resolution, dependent on microscopy system. | Relies on the interaction of split fluorophores, with lower spatial detail. |
| Live-Cell Imaging | Suitable for live or fixed cells, depending on experimental design. | Commonly used in live-cell imaging to study dynamic protein interactions. |
| Signal Dependency | Signals overlap based on spatial closeness of molecules. | Fluorescence is dependent on successful protein-protein interaction. |
| Applications | Studying co-localization of proteins, organelles, or macromolecules. | Validating direct interactions of proteins in living systems. |
| Complexity of Setup | Requires precise fluorophore labeling and advanced imaging systems. | Requires engineering of split fluorophores and protein fusion constructs. |
| Limitations | Cannot distinguish between co-localization and direct interaction. | May lead to false positives due to forced interactions of split fragments. |
Creative Proteomics' Fluorescence Colocalization Service Workflow
Creative Proteomics offers a streamlined fluorescence colocalization service tailored to meet diverse research needs. Our workflow ensures high precision and reproducibility:
Experimental Design: Comprehensive discussion with clients to understand project objectives. Selection of appropriate fluorophores and imaging systems.
Sample Preparation: Optimization of sample labeling and fixation protocols.
Image Acquisition: High-resolution imaging using state-of-the-art confocal or super-resolution microscopy.
Data Processing and Analysis: Application of advanced image preprocessing techniques. Detailed quantification using industry-standard colocalization metrics.
Report Delivery: Comprehensive analysis reports including images, quantitative data, and interpretation.

Why Choose Creative Proteomics for Fluorescence Colocalization Services?
Expertise in Advanced Imaging Techniques: Our team comprises skilled scientists with extensive experience in fluorescence microscopy and image analysis.
State-of-the-Art Technology: We utilize cutting-edge confocal and super-resolution microscopes to achieve unparalleled image clarity and resolution.
Tailored Solutions: Services are customized to align with the specific research goals and experimental requirements of our clients.
Comprehensive Data Analysis: We apply advanced quantitative methods, such as Pearson's correlation coefficient and Manders' overlap coefficient, to deliver robust, objective colocalization data.
Simple Requirement for Fluorescence Colocalization Analysis
| Sample Type | Description | Required Volume |
| Cells | Live-cell or fixed-cell. | 1-2 million cells are sufficient for analysis, depending on the experiment and imaging resolution. |
| Tissues | Fresh or fixed tissue sections. | Approximately 10-50 µm thick sections, depending on the tissue type and imaging technique used. |
| Biological Samples | tissue lysates, exosomes, or other biological extracts for analysis of molecular interactions at the cellular level. | 100-200 µL of protein extract or sample solution. |
FAQ
-
Q1: What types of fluorophores can be used in fluorescence colocalization analysis?
A1: Fluorescence colocalization uses fluorophores like GFP, RFP, Alexa Fluor, and Cy dyes, selected based on spectral properties, sample type, and imaging compatibility. Custom fluorophores can be accommodated to meet specialized research needs.
-
Q2: What are the limitations of fluorescence colocalization analysis?
A2: While fluorescence colocalization is a powerful tool, it has limitations. It relies on the proper selection and spectral separation of fluorophores, which can be challenging in highly dense or overlapping structures. Additionally, nonspecific binding or improper antibody labeling can introduce errors. At Creative Proteomics, we minimize these issues through careful optimization of experimental protocols, but it's important to consider the limitations when interpreting results.
-
Q3: Do you offer any troubleshooting services if my experiment fails to show colocalization?
A3: Yes, Creative Proteomics offers troubleshooting services for experiments that do not yield expected colocalization results. Our scientists can review your experimental setup, including sample preparation, fluorophore selection, and imaging conditions, to identify potential sources of error and recommend optimizations or alternative approaches.
-
Q4: What types of protein are compatible with fluorescence colocalization analysis?
A4: Fluorescence colocalization analysis can be applied to various proteins, including membrane proteins (e.g., GPCRs), cytoskeletal proteins (e.g., actin), nuclear proteins (e.g., transcription factors), enzymes (e.g., kinases), receptor proteins (e.g., EGFR), chaperones (e.g., Hsp70), secretory proteins, signaling proteins, and fusion proteins. It helps study protein interactions, cellular localization, and signaling pathways.
-
Case Study
Case: Analysis of protein-protein interactions and co-localization between components of gap, tight, and adherens junctions in murine mammary glands
Abstract
The study investigates the role of junctional proteins in cell-cell interactions within murine mammary glands. These interactions are crucial for tissue integrity and function, with junctional protein mislocalization potentially leading to dysfunction. The mammary gland development involves gap (GJ), tight (TJ), and adherens (AJ) junctions, each playing an essential role in maintaining tissue structure. The study aims to understand protein localization and protein-protein interactions (PPIs) using two techniques: co-immunofluorescence (co-IF) and co-immunoprecipitation (co-IP).
Methods
Co-IF Method: Involves sectioning mammary glands, performing double- or triple-labeling of proteins, and visualizing protein co-localization using confocal microscopy with fluorophore-labeled antibodies.
Co-IP Method: Used to detect physical protein-protein interactions. Involves lysate preparation, immunoprecipitation with specific antibodies, and identification of binding partners through SDS-PAGE and Western blot analysis.
Results
Co-IF Results: β-Catenin (AJ) and Cx26 (GJ) co-localize at the epithelial cell membrane of lactating murine mammary glands. Additionally, Claudin-7 (TJ), E-cadherin (AJ), and Cx26 co-localize in mammary glands at different developmental stages.
Co-IP Results: The interaction between Cx43 (GJ) and E-Cadherin and Claudin-7 (TJ) was confirmed, while no interaction between Cx43 and Claudin-3 was observed. Reciprocal IP further supported these findings, confirming the specific interactions between the junctional proteins in the mammary gland..
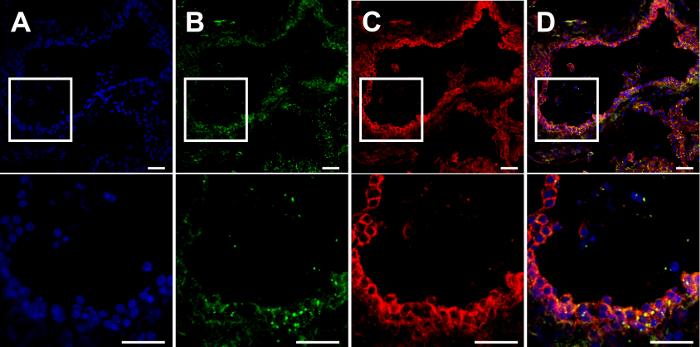
Figure 4. β-Catenin and Cx26 co-localize at the cell membrane in mice mammary glands. Cryosections from mammary glands of mice at lactation day 7 (L7) were cut (7 µm) and processed for immunofluorescent staining.
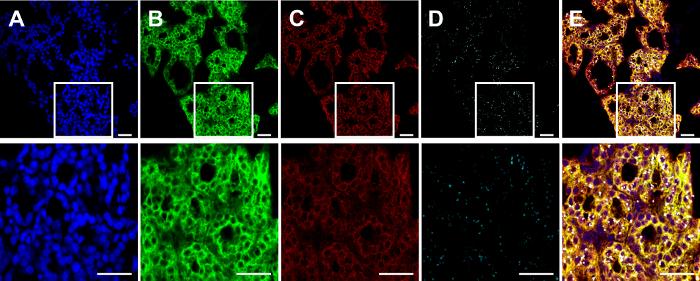
Figure 4. Connexin26 (Cx26), E-cadherin, and Claudin-7 co-localize at the cell membrane in mice mammary glands.
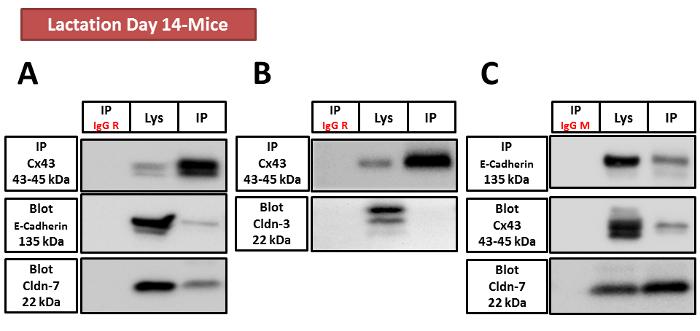
Figure 4. Cx43, E-Cadherin, and Claudin-7, but not Claudin-3, are involved in a protein complex.
Related Services
References
- Lagache T, Sauvonnet N, Danglot L, et al. Statistical analysis of molecule colocalization in bioimaging. Cytometry Part A, 2015, 87(6): 568-579. DOI: 10.1002/cyto.a.22629
- Comeau J W D, Costantino S, Wiseman P W. A guide to accurate fluorescence microscopy colocalization measurements. Biophysical journal, 2006, 91(12): 4611-4622. DOI: 10.1529/biophysj.106.089441
- Dunn K W, Kamocka M M, McDonald J H. A practical guide to evaluating colocalization in biological microscopy. American Journal of Physiology-Cell Physiology, 2011, 300(4): C723-C742. DOI: 10.1152/ajpcell.00462.2010
- Dianati E, Plante I. Analysis of protein-protein interactions and co-localization between components of gap, tight, and adherens junctions in murine mammary glands. Journal of visualized experiments: JoVE, 2017 (123): 55772. DOI: 10.3791/55772