Metabolomics Service
Creative Proteomics provides comprehensive metabolomics services, utilizing state-of-the-art analytical platforms such as LC-MS, GC-MS, and NMR, along with an extensive metabolite library of over 4,000 standards. Our tailored solutions support a wide range of research areas, offering services like untargeted and targeted metabolomics, metabolic profiling, and unknown metabolite identification. With a commitment to delivering high-quality data, actionable insights, and end-to-end support, we empower researchers to explore metabolic pathways, identify biomarkers, and advance discoveries across various scientific disciplines.
Submit Your Request Now
×
- What We Provide
- Advantages
- Sample Requirements
- Platforms
- Applications
- Demo
- FAQs
- Publications
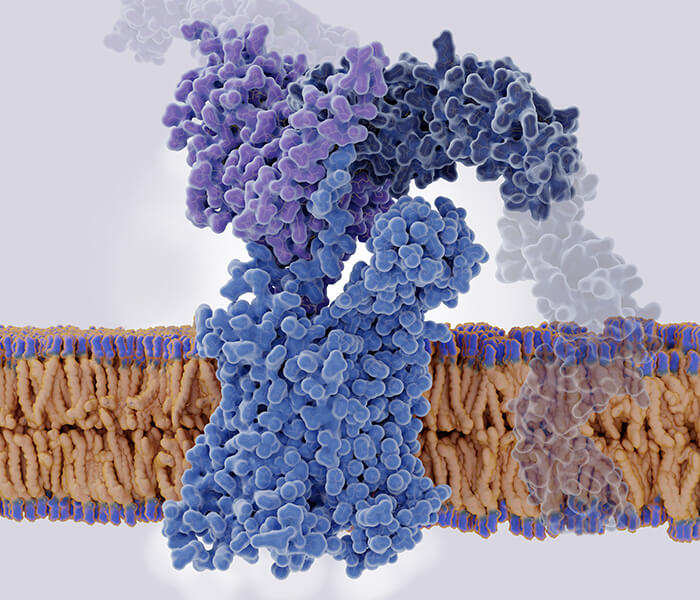
What Is Metabolomics?
Metabolomics refers to the systematic identification and quantification of the metabolome of a biological system at a specific point in time. And metabolome means the complete set of small-molecule chemicals found within a biological sample. Its main goal is to qualitatively and quantitatively study the diverse dynamic responses of living organisms to external stimuli, physiological and pathological changes, and genetic mutations, focusing on the levels of endogenous metabolites. The research primarily involves small molecule substances with a relative molecular mass ≤1000 Da, such as organic acids, amino acids, nucleotides, sugars, lipids, vitamins, etc.
Metabolites in biological systems can be divided into four levels depending on the research subjects and objectives: (1) Target metabolite analysis - for particular or partial analysis of components; (2) Metabolite profiling - a quantitative study of a predetermined limited number of metabolites; (3) Metabolomics - qualitative and quantitative analysis of all endogenous metabolite components in a biological sample under specific conditions; (4) Metabolic fingerprinting - quickly categorizing samples based on the comparison of difference in metabolic fingerprints rather than identifying a single component.
Why Choose Metabolomics?
- Small changes in gene and protein expression can be amplified in metabolites, making detection easier.
- Metabolomics research does not require the establishment of databases for whole genome sequencing or large-scale expressed sequence tags (ESTs).
- The number of metabolites studied is much smaller than the number of proteins; the quantity of metabolites varies significantly among species: plants (200,000 species), animals (2,500 species), microorganisms (1,500 species).
- The techniques used in this research are more versatile.
Metabolomics Service at Creative Proteomics
Creative Proteomics offers comprehensive support for metabolomics research. Our metabolomics platform has evolved into one of the most versatile in the industry, featuring a metabolite library with nearly 4,000 standard compounds and state-of-the-art metabolite analyzers. With expertise in both proteomics and metabolomics, their custom metabolomics analysis services include everything from discovery metabolomics to targeted metabolomics studies.
Creative Proteomics' metabolomics lab services cover everything from metabolite profiling and characterization to mass spectrometry-based assays. The company's robust metabolomics platform provides flexible options, whether clients need full metabolome profiling, targeted mass spec metabolomics, or specialized metabolomics CRO solutions.
As the metabolomics services market continues to expand, Creative Proteomics emphasizes high-quality data support and tailored metabolomic research services, meeting the diverse needs of researchers globally.
Service Contents
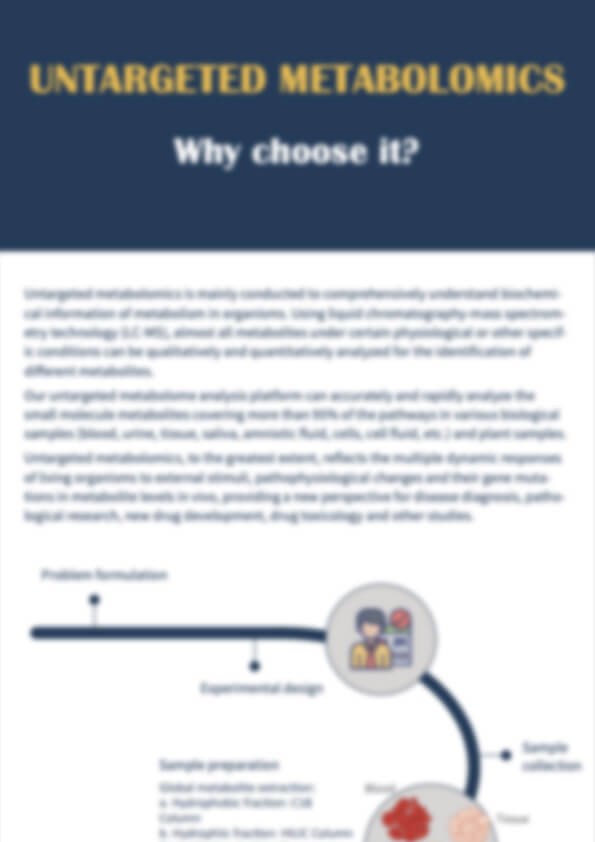
- Untargeted Metabolomics
- Plant Metabolomics Service
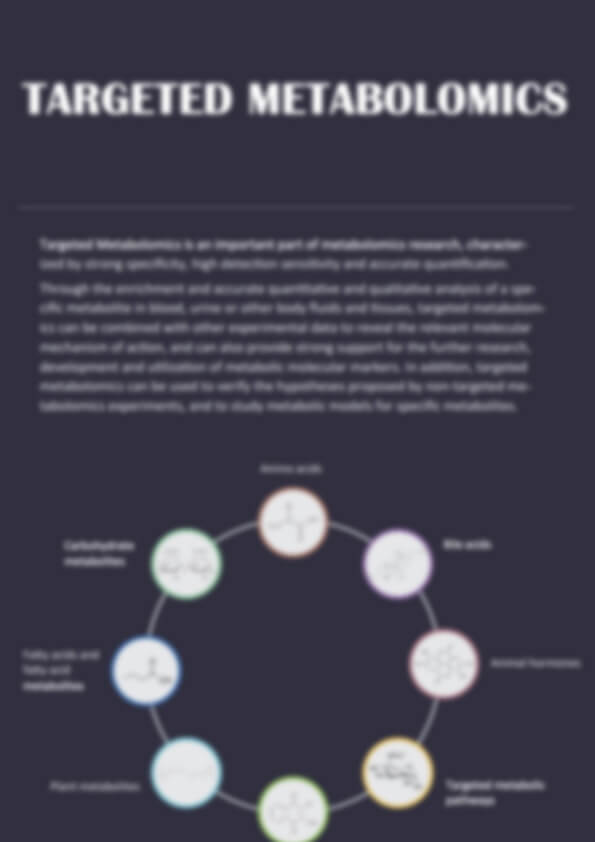
- Targeted Metabolomics
- Xenobiotic Metabolites Analysis Service
- Metabolic Flux Analysis(MFA)
- Unknown Metabolites Identification
- ICP-MS Ionomics Profiling
- Targeted Metabolic Pathways
- Targeted Metabolites
- Oxylipins
- Acylcarnitine
- Acyl CoAs
- dNTP,cdAMP
- Nucleoside/Nucleotide
- NAD Metabolites
- Neurotransmitters
- Low Molecular Weight Sugars
- Meat Biomarkers(TMAO)
- High-Value Disease Biomarkers
- Nucleotide Sugars
- Ketone Bodies
- Isoprostanes
- Mevalonic Acid
- Phenolic Acids
- Pipecolic Acid
- Plasmalogens
- Biliverdin(BV)Isomers
- Phosphorylated Compounds
- Quinolones
- Glucosylceramide
- Malondialdehyde
- Methylmalonic Acid
- 8-OHdG
- Glucosylsphingosine
- SAM and SAH
- Ubiquinone
- Glycosaminoglycans
- Polyols
- Respiratory Quinones
- DAP
- NADP
- Amino Acids Analysis Solution
- Vitamins Analysis Solution
- Inorganic Compounds
- Oxidative Stress Compounds
- Organic Acid Analysis Solution
- Malic Acid
- Oxalic Acid
- Quinic Acid
- Citric Acid
- Malonic Acid
- Succinic Acid
- Acetic Acid
- Lactic Acid
- Pyruvic Acid
- Shikimic Acid
- α-ketoglutaric Acid
- Cinnamic Acid
- Fumaric Acid
- Glyoxylic Acid
- Ferulic Acid
- Isoferulic Acid
- Tartaric Acid
- Glycolic Acid
- Aconitic Acid
- Formic Acid
- Propanoic Acid
- Butyric Acid
- Isobutyric Acid
- Valeric Acid
- Isovaleric Acid
- Maleic Acid
- Organic Compounds
- Plant Metabolites
- Plant Hormones Analysis Solution
- Coenzyme I Analysis Solution
- Biogenic Amine Analysis Solution
- Anthocyanins Analysis Solution
- Animal Hormones Analysis Solution
- Carbohydrate Metabolism Analysis Solution
- Adenosine Triphosphate Analysis Solution
- Signaling Molecule Analysis Solution
- cAMP
- Cryptotanshinone
- Tanshinone I
- Salvianolic Acid B
- Salvianolic Acid A
- Agrochemical
- Emerging Contaminants
- Drinking Water
- Environment Health
- Soil and Biota
- Unknown Surveillance
- Water Quality
- Disinfection By-Products
- Endocrine Disruptors
- Consumer Chemicals
- Natural and Freshwater Toxin
- Persistent Organic Pollutants
- Pesticide and Herbicide
- Pharmaceuticalsand Personal Care Products
Workflow of Metabolomics Analysis

Advantages Our Metabolomics Service
- Comprehensive Coverage: Analyze thousands of metabolites across diverse biochemical pathways, supporting in-depth insights and revealing new research opportunities.
- Data Comparability: Integrate datasets across studies, geographies, and time points, enabling robust, unified analyses.
- Expert Competency: Provide tailored study design, high-quality data, biological insights, and actionable recommendations, backed by a dedicated team.
- High Capacity: Process hundreds of thousands of samples quickly and cost-effectively, ready to meet high research demand.
- Extensive Database: Access to a library of over 4,000 standard metabolites, improving identification and data richness.
- Advanced Analytical Platforms: Use of high-sensitivity mass spectrometry and state-of-the-art tools, ensuring precise, repeatable results.
- End-to-End Support: Offer full-spectrum services from design to data interpretation, with continuous technical support throughout the research process.
Metabolomics Service Sample Requirements
| Sample Type | Untargeted Metabolomics | Targeted Metabolomics | Lipidomics | Metabolic Flux |
|---|---|---|---|---|
| Animal Tissue | 100-200 mg | 100-200 mg | 100-200 mg | |
| Plant Tissue | 100-200 mg | 100-200 mg | 100-200 mg | |
| Plasma/Serum | >100 μL | >100 μL | >100 μL | |
| Urine | 200-500 μL | 200-500 μL | 200-500 μL | |
| Saliva, Amniotic fluid, Bile, Tears, etc. | >200 μL | >200 μL | >200 μL | |
| Cells | >1*107 | >1*107 | >1*107 | >1*107 |
| Culture Supernatant | >2 mL | >2 mL | >2 mL | |
| Wastewater/Culture Medium | >2 mL | >2 mL | >2 mL | |
| Microbial Culture | >2 mL | >2 mL | >2 mL | |
| Feces/Intestinal Contents | 100-200 mg | 100-200 mg | 100-200 mg | |
| Soil Sample | >1 g | >1 g | >1 g | |
| Swab | 2 | 2 |
Metabolomics Research Platforms


Liquid Chromatography-Mass Spectrometry (LC-MS) Analysis
Applicable Sample Types: Unstable and non-volatile substances
Sensitivity: 10⁻⁹

Gas Chromatography-Mass Spectrometry (GC-MS) Analysis
Applicable Sample Types: Small molecules, volatile substances
Sensitivity: 10⁻⁹

Nuclear Magnetic Resonance (NMR) Spectroscopy Analysis
Applicable Sample Types: Few and complex substances
Sensitivity: 10⁻⁶
Applications of Metabolomics Service


Biomedical Research
Disease Diagnosis and Biomarker Discovery: Identifying disease-specific metabolic changes to discover biomarkers for early diagnosis and prognosis.
Drug Development and Toxicology: Understanding drug efficacy, metabolism, and toxicity profiles.
Personalized Medicine: Customizing treatment plans based on individual metabolic profiles.
Agriculture and Food Science
Crop Improvement: Identifying metabolic pathways linked to stress resistance, yield, and nutritional quality.
Food Quality and Safety: Ensuring food authenticity and detecting contaminants.
Animal Health: Monitoring livestock metabolism for better health management and productivity.
Environmental Science
Ecotoxicology: Evaluating the effects of pollutants on organisms by studying their metabolic responses.
Microbial Ecology: Understanding microbial interactions and their roles in ecosystems.
Biotechnology
Industrial Metabolomics: Optimizing microbial production of biofuels, pharmaceuticals, and other bioproducts.
Synthetic Biology: Designing metabolic pathways for enhanced production of target compounds.
Nutritional Science
Dietary Interventions: Evaluating the impact of diet on metabolism and health.
Nutritional Biomarkers: Identifying metabolic indicators of dietary intake and nutritional status.
Pharmacometabolomics
Linking metabolomics with pharmacology to study individual responses to drugs and optimizing therapeutic strategies.
Demo

PCA chart

PLS-DA point cloud diagram

Plot of multiplicative change volcanoes

Metabolite variation box plot

Pearson correlation heat map
FAQs of Metabolomics Service
How many biological replicates are generally required in metabolomics studies?
In metabolomic research, there are certain requirements for the number of biological repeat samples. Recommended standards are as follows: not less than 30 clinical samples, not less than 10 animal samples, not less than 8 cell samples, not less than 8 plant samples, and not less than 8 microbial samples. Metabolomics is downstream of systems biology and the amplification of biological processes may lead to amplified individual differences. Influencing factors are numerous, such as age, gender, and the physicochemical property differences of metabolites. To ensure analytical result accuracy and minimize individualized spectral error introduced by sample variability, the sample size should be maximized. Too few biological replicates may led to poor model building in later stages and possibly make statistical analysis impossible, thereby limiting the discovery of differential metabolites.
Why is High Resolution Mass Spectrometry Essential for LC-MS Metabolomics?
In present-day metabolomics research, LC-MS plays a vital role with the primary method of metabolite annotation involving a database search based on accurate molecular weight and secondary fragment information. Accurate molecular weight serves as an indispensable parameter in this procedure. To acquire the accurate molecular weight of substances, the application of high-resolution mass spectrometry is vital. Conventional high-resolution mass spectrometers can ensure the precise mass error of substances is controlled within 5 ppm, and even as low as 3 ppm, thereby significantly enhancing the accuracy of annotation.
What Are TOF, QQQ, QTRAP, and Orbitrap in Mass Spectrometry?
Mass spectrometers can be classified based on their mass analyzers, with TOF, QQQ, QTRAP, and Orbitrap representing different types of such analyzers: TOF (Time-of-Flight); QQQ (Triple Quadrupole); QTRAP (Quadrupole TRAP); Orbitrap (Orbitrap Analyzer).
Serum samples or plasma samples?
Extant research has demonstrated different metabolic varieties and abundances between the two. However, in terms of research objectives, no specific sample type has been definitively proved as superior. Consequently, when deciding to use either serum or plasma, the primary concern should be to ensure consistency in the collection process. In selecting blood samples, plasma anticoagulated with EDTA or heparin is preferable. During the collection process, it is vital to minimize hemolysis. After collection, samples should be stored at -80℃ to prevent any degradation and repeated freeze-thaw cycles should be strictly avoided to maintain sample integrity.
Are the metabolites detected by mass spectrometry all truly existing metabolites?
Qualitative assessment in untargeted metabolomics necessitates aligning the metabolite's tandem mass spectrometry (MS/MS) fragmentation information with database fragment data. Given the variance in fragment patterns for the same substance across different instruments and conditions, a nuanced matching discrepancy arises during data correlation. To mitigate the risk of false positives in substance identification, Creative Proteomics consistently advocates for a stringent matching criterion, emphasizing high concordance in the matching process. This approach underscores the commitment to meticulous data analysis and strives to uphold the integrity of metabolite identification in the pursuit of scientific rigor.
Why are some commonly metabolites sometimes undetectable?
The limitations of untargeted metabolite detection stem from its inherent lack of specificity. For metabolites with low signal intensity, untargeted metabolomics techniques may introduce interference, potentially masking signals and impeding accurate identification. In situations where research objectives are clearly defined, investigators often opt for targeted metabolomics, a method tailored to the specific detection of chosen metabolites, yielding more desirable outcomes. However, it is important to note that, currently, no single technique exists capable of simultaneously identifying all metabolites.
In metabolomics, the query emerging frequently is why, despite detecting thousands of metabolic feature peaks, does the final qualification of compounds remain relatively low?
Conventionally, the range for metabolite identification falls within approximately 300 to 400 species. During data analysis, a stringent standard reference database is applied, thereby contributing to a low rate of false-positive results. Yet, certain metabolites are not included in the standard reference library, hence undetectable. The public database, relying on molecular weight for matching, might propose numerous candidate metabolites, but the probability of false positives is elevated.
Moreover, a single metabolite, detected multiple times, can manifest itself in various charged (ionic) forms, such as protonated, deprotonated, adduct ions, isotopic peaks, dimers, trimers, and specific ionic forms. This phenomenon elucidates why numerous ionic peaks could be detected yet eventually be qualified as a singular metabolite.
In instances of insufficient fecal sample collection, is it permissible to supplement with intestinal contents?
The answer is negative. Research indicates significant disparities between metabolites found in intestinal contents and those in feces, with notable variations even among different segments of the intestine. In the context of metabolomic investigations, only samples collected beyond the colon can be considered representative of fecal material. This distinction underscores the importance of precision in sample selection for metabolomics examinations and highlights the necessity of drawing distinct boundaries when characterizing samples in scientific studies.
Does a peak in the TIC/BPC diagram represent a distinct compound?
In TIC/BPC diagrams, a single peak does not always denote a unique compound. In fact, a single peak could potentially be composed of multiple substances.
Is it feasible to submit samples individually for separate testing and subsequently amalgamate them for joint analysis?
Within the experimental framework, assuring the accuracy and consistency of data mandates the concurrent testing of identical experiments. Routine recalibration of equipment remains indispensable. Processing samples in batches may introduce variability attributable to calibration disparities, thereby incurring a batch effect. Consequently, conducting collective tests for the identical experiment becomes imperative.
For experiments characterized by prolonged sampling periods, such as those spanning a year or more, the practice of dispatching samples in batches, conducting separate analyses, and subsequently consolidating results is ill-advised. The consequential batch effect could wield substantial influence on experimental outcomes. It is recommended to store completed samples in a -80℃ freezer to mitigate the impact of repeated freeze-thaw cycles. Upon the completion of sample collection, dispatching them for testing collectively ensures the uniformity of test conditions.
What iS QC?
In the process of metabolomics research based on mass spectrometry techniques, the implementation of quality control (QC) is usually necessary to ensure the acquisition of reliable and high-quality metabolomics data. A QC sample, composed by mixing 20 μL from each test sample, principally serves to rectify deviations in the analysis results of mixed samples and to correct errors caused by the analytical instrument itself.
What are primary mass spectrometry (MS) and secondary mass spectrometry (MS/MS)?
In the context of LC-MS metabolomic studies, the primary role of MS is to acquire accurate mass-to-charge ratio information for molecular ions, facilitating the determination of a compound's precise molecular weight for the inference of its molecular formula. However, this process only addresses a portion of the requirements for structural inference and alignment.
To enhance the accuracy of substance structural inference, it becomes necessary to fragment the molecular ions, acquiring fragment information through secondary mass spectrometry, denoted as MS/MS data. This secondary level of analysis contributes crucial insights into the structural elucidation of compounds, complementing the information obtained from primary mass spectrometry.
During the LC-MS detection process, why are there positive and negative ion modes?
Positive and negative ion modes represent two distinct scanning approaches within mass spectrometry (MS). Following ionization by the ESI source, the sample generates ions carrying positive charges (such as M+H, M+NH4, M+Na, etc.) and negative charges (such as M-H, M+Cl, M+CH3COO, etc.). Given the diversity in physicochemical properties of metabolites, some compounds exhibit positive charges, while others present negative charges.
To ensure a comprehensive profiling of the metabolome, it becomes imperative to scan both positive and negative ion states, recognizing the varied ionization behaviors of different metabolites. This dual-mode approach allows for a more thorough exploration of the metabolic landscape, acknowledging the nuanced characteristics of diverse metabolites.
How to assess the stability of the instrument system during the detection process?
In the course of detection, evaluating the stability of the instrument system involves several key considerations. Firstly, prior to sample analysis, meticulous calibration and correction of the instrument are essential to ensure that its response and quality accuracy meet the required standards. Secondly, during the injection process, validation of the analytical system can be achieved by employing Quality Control (QC) samples. Lastly, after obtaining data, assessing the stability of the analytical system during the analysis process can be done by examining the clustering pattern of QC samples in the Principal Component Analysis (PCA) score plot.
When dealing with a large volume of samples, how can the stability of the entire analysis process be ensured, and the impact of instrument fluctuations minimized?
To address this question, the initial step involves the incorporation of Quality Control (QC) samples. Subsequently, depending on the quantity of samples, the detection process can be divided into several batches. During the data processing stage, adopting batch normalization methods becomes crucial to reduce instrument errors and diminish differences between batches. This meticulous approach ensures the stability of the overall analysis process and mitigates the influence of instrument fluctuations.
What types of substances can be detected by LC-MS?
LC-MS technology is versatile in detecting various substance types in the analysis of biological samples. Utilizing the ESI source, as favored by Creative Proteomics, it is particularly suitable for the detection of moderately polar and highly polar compounds. Specific substance categories encompass fatty acids, alcohols, phenols, vitamins, organic acids, polyamines, nucleotides, polyphenols, terpenes, flavones, lipids, and more.
What types of substances can be primarily detected by GC-MS?
Gas Chromatography-Mass Spectrometry (GC-MS) is predominantly applicable for the detection of a spectrum of chemical substances, including short-chain fatty acids, organic acids, fatty acids, sugars, polyols, amines, and sugar phosphates. These substances are chiefly associated with amino acid metabolism, sugar metabolism, the tricarboxylic acid cycle (TCA), and other biological metabolic pathways. It is noteworthy that for water-soluble substances, GC-MS detection requires derivatization treatment. Direct GC-MS analysis is only feasible when the sample possesses volatility and thermal stability.
Learn about other Q&A.
Case Study
Multiomics of a rice population identifies genes and genomic regions that bestow low glycemic index and high protein content
Journal: Proceedings of the National Academy of Sciences (PNAS)
Published: 2024
- Background
- Materials & Methods
- Results
- Reference
The rising global prevalence of diabetes and malnutrition has prompted efforts to develop healthier rice varieties that are both diabetic-friendly and rich in protein. Rice, a staple food for more than half of the global population, typically has a high glycemic index (GI), which contributes to the increasing incidence of type 2 diabetes. Additionally, rice is generally low in protein content, posing challenges for addressing protein deficiencies, particularly in low- and middle-income countries. This study focused on creating rice varieties with low GI and high protein content (PC) by identifying key genes and genomic regions associated with these traits. Using advanced genomics and metabolomics, the study aimed to produce rice lines with high amylose content (AC) and high PC to address food security and public health issues.
A. Population Development
An F2-derived F3 mapping population was developed by crossing Samba Mahsuri (high-quality rice) and IR36ae (high amylose). 369 F2 plants were selected and self-pollinated to F6.
B. Amylose & Protein Content
Amylose content was measured using iodine-iodine complex formation, and crude protein content was measured by the Kjeldahl method.
C. In-vitro Glycemic Index & Resistant Starch
Glycemic index was determined using an in vitro human digestion model. Resistant starch was analyzed by glucose concentration and AUC.
D. DNA Extraction & Sequencing
DNA was extracted using the CTAB method and sequenced using Illumina Hiseq X10. Genomic data were aligned to the Nipponbare reference genome.
E. QTL Mapping
SNP markers from whole-genome sequencing were used for bulk segregant analysis. QTL mapping was performed using composite interval mapping (CIM), with SNPs identified by the SNP-index method.
Metabolites were extracted using 80% methanol, followed by LC-MS for analysis. Data were processed using MetaboAnalyst v5.0 and pathways analyzed with KEGG.
G. Protein & Amino Acid Quantification
Protein was extracted with NaOH and analyzed for amino acids by HPLC after hydrolysis.
H. Gene Editing
CRISPR-Cas9 was used to edit OsSBEIIb in NSICRc222. sgRNA was cloned into pSR339, and transformation was performed using Agrobacterium tumefaciens. Gene editing was confirmed by PCR and sequencing.
 Analytical workflow of RIL population development and downstream multigenomic analysis pipeline for identifying candidate genes and genotypes with ultralow and low GI, high AC, and high PC.
Genetic Regions Influencing High Amylose, High Protein (HAHP) and Low GI in Rice:
- AC (Amylose Content) in the F3 population ranged from 18.1% to 36.8%, showing significant genetic variation.
- Key QTLs for AC were identified on chromosomes 1, 2, and 6, including qseqAC2.1, qseqAC2.2, qseqAC2.3, and qseqAC6.1, with candidate genes linked to starch synthesis, protein synthesis, and carbohydrate metabolism.
- For grain protein content (PC), QTLs were detected on chromosomes 2, 3, 4, 5, and 8, with genes associated with storage proteins, sugar transport, and stress response.
- Genetic loci influencing Ultralow GI (glycemic index), High Amylose, and High Protein were confirmed through fine mapping in the F6 population, with OsSBEIIb emerging as a key gene affecting GI and AC.
Machine Learning and Classification of GI:
- A machine learning model using artificial neural networks (ANN) was developed to classify GI levels with 74.47% accuracy.
- AC, PC, and specific SNPs from OsSBEIIb and OsFBK7 were identified as key predictors for GI classes, particularly for ultralow and high GI rice lines.
Metabolomic Profiling:
- Metabolite analysis revealed distinct profiles for high AC and high protein (HAHP) vs. low AC and low protein (LALP) rice lines.
- HAHP lines exhibited higher amino acid levels (e.g., lysine) and dipeptides, while LALP lines had elevated lipids, particularly phosphatidylcholines.
- Pathway analysis suggested that amino acid metabolism and lipid biosynthesis were major distinguishing features between GI classes.
 Metabolomic analysis of HAHP and LALP groups.
CRISPR/Cas9-Mediated OsSBEIIb Mutagenesis:
- CRISPR/Cas9 was used to target OsSBEIIb for mutations in rice, confirming its role in controlling GI.
- Mutant lines exhibited reduced GI values (53-55), confirming OsSBEIIb's importance in regulating GI, with changes in resistant starch (RS) content, increasing significantly in the mutant lines.
Reference
- Badoni, Saurabh, et al. "Multiomics of a rice population identifies genes and genomic regions that bestow low glycemic index and high protein content." Proceedings of the National Academy of Sciences 121.36 (2024): e2410598121.
Publications
Here are some publications in proteomics research from our clients:

- T cell Aryl Hydrocarbon Receptor Activity Tunes the Gut Microenvironment to Sustain Autoimmunity and Neuroinflammation. 2022. https://doi.org/10.1101/2022.04.19.488821
- Effect of arabinogalactan on the gut microbiome: A randomized, double-blind, placebo-controlled, crossover trial in healthy adults. 2021. https://doi.org/10.1016/j.nut.2021.111273
- Quantifying forms and functions of intestinal bile acid pools in mice. 2024. https://doi.org/10.1101/2024.02.16.580658
- Resting natural killer cell homeostasis relies on tryptophan/NAD+ metabolism and HIF‐1α. 2023. https://doi.org/10.15252/embr.202256156
- The activity of the aryl hydrocarbon receptor in T cells tunes the gut microenvironment to sustain autoimmunity and neuroinflammation. 2023. https://doi.org/10.1371/journal.pbio.3002000
Metabolomics Sample Submission Guidelines
Download our Metabolomics Sample Preparation Guide for essential instructions on proper sample collection, storage, and transport for optimal experimental results. The guide covers various sample types, including tissues, serum, urine, and cells, along with quantity requirements for untargeted and targeted metabolomics.