Semi-Quantitative Protein Array Service
What is Semi-Quantitative Proteomics?
Semi-quantitative proteomics is a powerful analytical approach that allows researchers to measure relative protein abundances across multiple samples or experimental conditions. Unlike fully quantitative methods, which provide absolute concentration values, semi-quantitative approaches focus on identifying fold-changes and expression patterns.
This method is particularly valuable when the primary research goal is to uncover differential protein expression, post-translational modifications (PTMs), or pathway changes between experimental groups. Label-based techniques (e.g., SILAC, iTRAQ, TMT) and label-free approaches (e.g., spectral counting, peptide ion intensity analysis) are widely employed, offering flexibility depending on experimental design and available resources. Semi-quantitative proteomics has become a cornerstone in biomedical and pharmaceutical research by enabling the detection of biologically meaningful protein regulation.
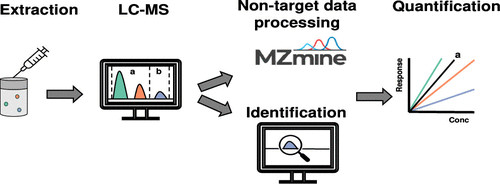
Figure 1. A semi-quantitative approach to nontarget compositional analysis of complex samples (Evans R L, et al, 2008).
Why Use Semi-Quantitative Protein Arrays?
A semi-quantitative protein array is a multiplexed platform that measures relative protein levels under different biological conditions. By capturing and detecting protein targets on immobilized substrates such as glass slides, membranes, or beads, these arrays allow researchers to compare expression patterns without requiring absolute quantification. Positioned between qualitative assays and fully quantitative proteomics methods, semi-quantitative arrays balance practicality, throughput, and precision. Semi-quantitative protein arrays offer several advantages for research teams:
- Cost-effectiveness: More affordable than absolute quantification methods while still providing biologically relevant insights.
- High throughput: Capable of analyzing hundreds of proteins simultaneously.
- Versatility: Suitable for exploratory studies where rapid profiling is required.
- Biological insight: Provides robust information on relative changes in expression, which is crucial for biomarker discovery, immune profiling, and drug response evaluation.
How Do Semi-Quantitative Arrays Work?
The principle of semi-quantitative arrays is based on comparing signal intensities across samples:
- Array design: Antibodies, proteins, or peptides are immobilized on array surfaces.
- Detection: Target proteins in biological samples bind to capture molecules.
- Signal measurement: Detection reagents generate signals proportional to protein abundance.
- Analysis: Relative intensity is compared across conditions.
Multiple platforms are available, including:
- Glass slide arrays for high-density multiplexing.
- Membrane-based arrays for cost-efficient detection.
- Bead-based arrays compatible with flow cytometry.
Advantages of Semi-Quantitative Protein Arrays
Semi-quantitative protein arrays provide several advantages for research and development projects:
- Cost-effectiveness: Lower expense compared to absolute quantification methods.
- High-throughput capability: Simultaneous analysis of tens to hundreds of proteins.
- Versatility: Suitable for diverse biological matrices, including serum, plasma, tissue lysates, and cell culture supernatants.
- Reliable and reproducible: Standardized workflows ensure consistent data quality.
- Biological insight: Enables the detection of subtle protein expression changes critical in disease research and drug development.
Differences between Semi-Quantitative Arrays and Other Methods
| Feature | Semi-Quantitative Protein Arrays | ELISA | Fully Quantitative Proteomics (LC-MS/MS) |
| Measurement Type | Relative protein abundance across multiple targets | Absolute or relative concentration of a single target | Absolute protein quantification with high accuracy |
| Multiplexing | High (tens to hundreds of proteins per sample) | Low (usually 1–2 proteins per assay) | Moderate to high, but limited by sample complexity |
| Sample Requirement | Low to moderate | Low | Moderate to high, depending on method |
| Throughput | High – simultaneous profiling of multiple proteins | Low – individual assays per protein | Moderate – runs take longer, may require fractionation |
| Cost | Moderate, cost-effective for comparative studies | Low to moderate per assay | High, due to instrumentation and sample prep |
| Ease of Use | Straightforward, standardized workflow | Simple, minimal technical expertise | Complex, requires specialized skills and data analysis |
| Applications | Biomarker discovery, cytokine profiling, drug response studies | Targeted validation, clinical diagnostics | Comprehensive proteome mapping, absolute quantification of protein changes |
Workflow for Semi-Quantitative Protein Array Service
- Array Preparation: Antibodies or proteins are immobilized on appropriate platforms, such as glass slides, membranes, or bead-based systems.
- Sample Application and Incubation: Samples are applied to the array under controlled conditions. Binding interactions are preserved to ensure signal fidelity.
- Signal Detection: Signal intensity is measured using fluorescence, chemiluminescence, or other detection methods.
- Data Acquisition and Normalization: Raw signals are processed to correct for experimental variability.
- Bioinformatics Analysis: Functional annotation, clustering, pathway enrichment, and protein-protein interaction network analyses provide biological context.
Deliverables and Reporting Standards
- Raw Data: Complete data sets including intensity values, spectral counts, or peptide information.
- Processed Data: Normalized and analyzed results highlighting relative protein expression changes.
- Visualizations: Volcano plots, heatmaps, principal component analysis (PCA), and protein interaction networks.
- Optional Bioinformatics Interpretation: Functional annotation, pathway enrichment, and network mapping to contextualize findings biologically.
Applications of Semi-Quantitative Protein Array
- Biomarker discovery and validation: Arrays help identify proteins that change in abundance during disease progression. These protein markers can be further validated as potential diagnostic tools or therapeutic targets.
- Cytokine and chemokine profiling: By measuring immune signaling molecules, arrays reveal patterns of inflammation or immune activation in conditions such as autoimmune disorders, infections, and cancer.
- Drug development and safety testing: Arrays monitor how drug candidates affect protein pathways. They can uncover desired effects, such as blocking a disease signal, and unintended effects that may cause toxicity.
- Cross-species comparisons: Researchers studying animal models can use arrays to compare protein responses between species, improving the translation of preclinical findings into human studies.
- Mechanistic studies: Arrays provide insight into how cells respond to stress, signaling cues, or environmental changes by tracking shifts in protein expression patterns.
Simple Requirements
| Sample Type | Serum, plasma, tissue lysates, cell culture supernatants, or purified proteins |
| Sample Volume | Typically 50–200 µL per sample; specific requirements depend on array platform |
| Sample Quality | High-quality, properly stored samples (e.g., frozen at −80°C, avoid repeated freeze-thaw cycles) |
| Number of Samples | Flexible; suitable for small pilot studies or large-scale profiling |
| Target Selection | Selection from existing panels or fully customized protein targets |
| Project Consultation | Optional pre-project consultation to define experimental design and analysis needs |
Why Choose Creative Proteomics for Semi-Quantitative Protein Array Assay
At Creative Proteomics, we combine more than a decade of proteomics expertise with advanced platforms to deliver high-quality semi-quantitative array services. Our capabilities include:
- Comprehensive technology platforms: Antibody arrays, protein arrays, and bead-based assays.
- Bioinformatics integration: Functional annotation, clustering, pathway enrichment, and network analysis.
- Advanced instrumentation: Including high-resolution detection systems for sensitivity and reproducibility.
- Quality assurance: Strict internal controls ensure accuracy, reliability, and consistency.
FAQ
-
Q1: How do semi-quantitative protein arrays compare to traditional Western blotting?
A1: While Western blotting is a gold-standard technique for protein detection, it is labor-intensive and typically analyzes one protein at a time. In contrast, semi-quantitative protein arrays allow for the simultaneous analysis of multiple proteins, offering a more efficient approach for large-scale studies. Additionally, arrays provide a broader dynamic range and can be more reproducible across different laboratories.
-
Q2: What factors influence the sensitivity and specificity of semi-quantitative protein arrays?
A2: The quality of antibodies, array design, sample preparation, and detection methods are critical determinants of sensitivity and specificity. Optimized protocols and rigorous quality controls are essential to minimize cross-reactivity and false positives.
-
Q3: Can semi-quantitative protein arrays detect post-translational modifications (PTMs)?
A3:Yes. With appropriately designed arrays using PTM-specific antibodies (e.g., phospho- or acetyl-specific), semi-quantitative arrays can profile changes in phosphorylation, acetylation, ubiquitination, and other PTMs across samples.
-
Q4: How many proteins can be analyzed simultaneously on a semi-quantitative array?
A4: Depending on the platform, arrays can measure a few proteins (5–40 targets) to hundreds or thousands of proteins using high-density glass-slide or bead-based systems. Research goals and sample availability determine the number.
-
Q5: What bioinformatics tools are typically used for analyzing semi-quantitative array data?
A5: Commonly, data are analyzed using statistical tools for normalization and significance testing, heatmap visualization, PCA for pattern recognition, and pathway enrichment tools like GO, KEGG, or Reactome. Network analysis can further reveal protein–protein interactions.
Demo
Demo: Protein Array-Based Detection of Proteins in Kidney Tissues from Chronic Kidney Disease Patients
Employed a semi-quantitative protein array (L-493 panel) to screen differential protein expression in kidney tissue, then followed up on candidate markers with orthogonal assays. This paper includes array fluorescence images and example data plots.
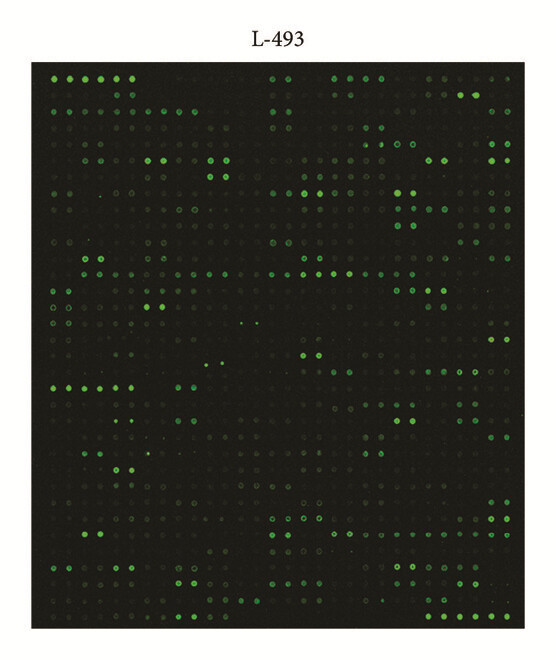
Figure 2. Fluorescence images and scatter plot of the semi-quantitative protein array L-493 (493 proteins) in detecting proteins in kidney tissue (Wang S, et al., 2017).
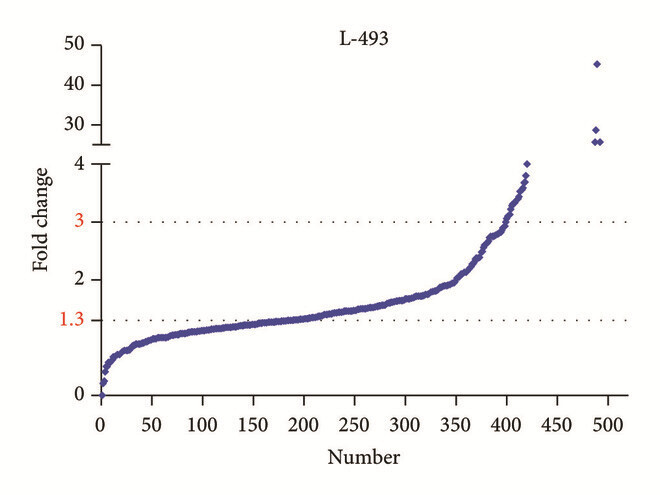
Figure 3. Fluorescence images and scatter plot of the semi-quantitative protein array L-493 (493 proteins) in detecting proteins in kidney tissue (Wang S, et al., 2017).
-
Case Study
Case: A SNAI2-PEAK1-INHBA stromal axis drives progression and lapatinib resistance in HER2-positive breast cancer by supporting subpopulations of tumor cells positive for antiapoptotic and stress signaling markers.
Abstract:
Therapy resistance in HER2-positive breast cancer is influenced not only by tumor cell–intrinsic mechanisms but also by the stromal microenvironment. PEAK1, a pseudokinase associated with focal adhesions and cytoskeletal regulation, has been implicated in tumor progression. Still, the stromal mediators and downstream effectors that enable resistance to HER2-targeted therapy (lapatinib) were incompletely understood. The study aimed to identify stromal factors and signaling axes that promote tumor progression and lapatinib resistance in HER2-positive breast cancer, with a focus on defining the role of stromal PEAK1 and its downstream effectors (including the potential role of INHBA/activin-A).
Methods
The authors combined bioinformatic analysis of patient datasets with experimental validation in co-culture models and functional assays. Key experimental approaches included immunostaining of patient tissues and in vitro co-culture systems (mesenchymal stromal cells (MSCs) with HER2+ tumor cells), genetic perturbation of PEAK1 (shRNA) in MSCs, and semi-quantitative protein array profiling (mouse antibody array L-308; ~308 protein antigens) to screen for PEAK1-dependent changes in stromal protein expression. Candidate hits from the array were validated by orthogonal assays (e.g., ELISA, Western blot), and functional assays assessed effects on lapatinib sensitivity.
Results
- Semi-quantitative array profiling of MSC lysates after PEAK1 knockdown identified altered expression/secretion of several proteins, most notably INHBA (activin-A), as PEAK1-dependent.
- Functional validation showed that PEAK1-dependent INHBA expression/secretion from MSCs contributed to MSC-mediated protection of HER2+ tumor cells from lapatinib (i.e., reduced drug sensitivity).
- Bioinformatic and histological analyses of patient samples linked high stromal SNAI2/PEAK1/INHBA signatures to poorer clinical outcomes, supporting the clinical relevance of the identified stromal axis.
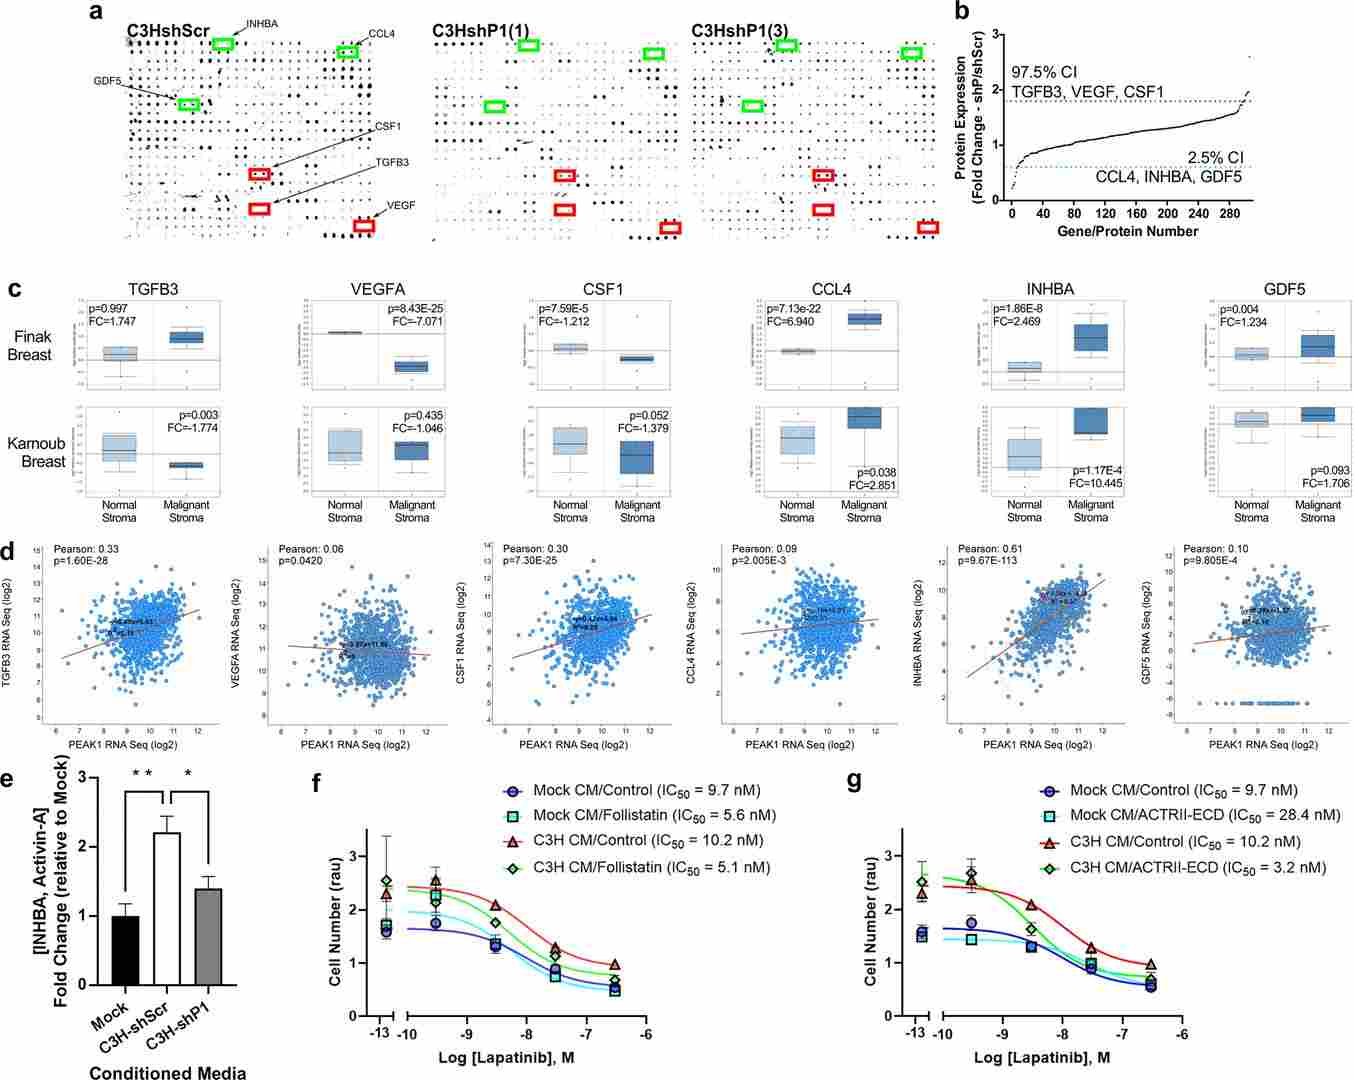
Figure 4. PEAK1-dependent INHBA/activin-A expression/secretion from MSCs mediates MSC-induced lapatinib resistance in HER2-positive breast cancer cells.
Conclusion
The study defines a SNAI2–PEAK1–INHBA stromal axis that supports tumor cell subpopulations with anti-apoptotic and stress-signaling phenotypes and promotes resistance to lapatinib in HER2-positive breast cancer. Targeting components of this stromal signaling axis (or downstream anti-apoptotic/stress pathways) may improve responses to HER2-targeted therapies in stroma-rich tumors.
Related Services
References
- Evans R L, et al. A semi-quantitative approach to nontarget compositional analysis of complex samples. Analytical Chemistry, 2024, 96(46): 18349-18358.
- Wang S, et al. Protein Array‐Based Detection of Proteins in Kidney Tissues from Patients with Membranous Nephropathy. BioMed Research International, 2017, 2017(1): 7843584.
- Hamalian S et al. A SNAI2-PEAK1-INHBA stromal axis drives progression and lapatinib resistance in HER2-positive breast cancer by supporting subpopulations of tumor cells positive for antiapoptotic and stress signaling markers. Oncogene, 2021, 40(33): 5224-5235.