Spatial Phosphoproteomics Service
Are you struggling to understand how protein signaling varies across different regions of tissue or within complex cellular environments? Spatial phosphoproteomics offers a transformative solution, providing high-resolution, location-specific phosphorylation maps that reveal critical signaling pathways and molecular targets that conventional proteomics cannot capture. By integrating laser capture microdissection, advanced mass spectrometry, and cutting-edge bioinformatics, we deliver deep, reproducible, and spatially precise phosphoproteomic data, empowering your research to identify disease mechanisms, potential biomarkers, and therapeutic targets.
- High Sensitivity & Depth: Detect thousands of proteins and phosphorylation sites even from ultra-low input samples.
- Cell-Level Precision: Target specific tissue regions or cell populations using advanced imaging and microdissection.
- Proven Expertise: Years in proteomics and more than 80 successful spatial projects ensure reliable and actionable insights.
Introduction to Phosphoproteomics
Phosphoproteomics is a specialized branch of proteomics focused on identifying and quantifying phosphorylated proteins within biological systems. Phosphorylation — the reversible addition of a phosphate to serine, threonine, or tyrosine amino acids — is a key switch that controls protein activity and cellular signaling. Practically, phosphoproteomics uses mass spectrometry together with simple chemical enrichment steps to pull out phosphorylated peptides, so as to detect and quantify phosphorylation across the proteome. This lets researchers map which kinases act on which substrates, track changes in signaling over time or after treatment, and identify location-specific biomarkers or drug targets in diseases such as cancer and neurodegeneration.
What is Spatial Phosphoproteomics?
Protein phosphorylation is one of the most common and essential protein modifications, regulating nearly all cellular signaling processes. Traditional phosphoproteomics measures overall phosphorylation levels but misses where these changes happen within tissues. Spatial phosphoproteomics solves this by combining protein analysis with imaging, revealing how phosphorylation patterns are organized in specific cells and tissue regions. This approach gives researchers a clearer picture of signaling events, disease mechanisms, and potential drug targets in their natural context.
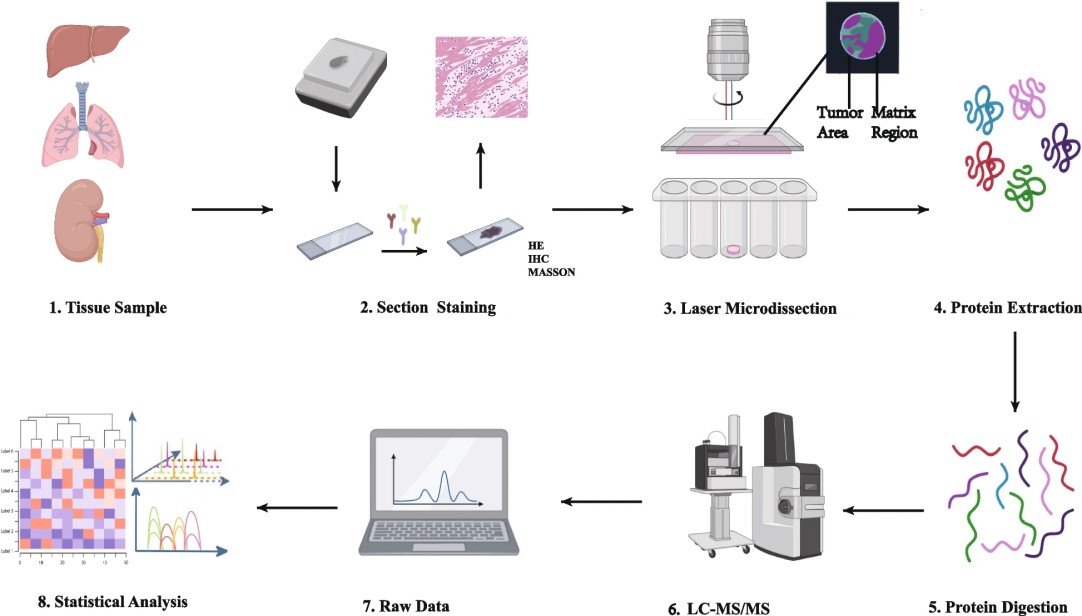
Figure 1. Operational procedure of spatial proteomics mass spectrometry methods (Wu M, et al. 2024).
Why Spatial Context Matters in Phosphoproteomics?
The spatial localization of phosphorylation events is a key determinant of their biological function. Kinase activities, substrate interactions, and signaling cascades occur in highly organized cellular microenvironments. Traditional phosphoproteomics, while comprehensive, averages signals across diverse cell populations, masking critical spatial heterogeneity. Spatial phosphoproteomics overcomes this limitation by analyzing phosphorylated proteins in their native locations within tissues. This allows:
Map signaling gradients within tumors or organs.
Identify phosphorylation hotspots in disease-relevant microenvironments.
Link kinase activity to specific cellular contexts.
Advantages of Creative Proteomics' Spatial Phosphoproteomics Service
- Multi-Sample Compatibility and High Flexibility: Our spatial workflow supports multiple sample formats (FFPE, OCT, frozen) and staining methods (HE, IHC, IF). While spatial phosphoproteomics currently focuses on frozen sections, we ensure compatibility across different experimental designs.
- Ultra-Sensitive and Deep Detection: With advanced mass spectrometry systems and optimized sample preparation, we achieve high detection depth and precision even from nanogram-level protein inputs. Our workflow delivers consistent phosphoproteomic coverage exceeding 5000+ phosphosites per analysis.
- Exceptional Reproducibility and Reliability: Technical replicates exhibit Pearson correlation coefficients above 0.95, ensuring robustness of results across biological and technical repeats.
- Integrated Infrastructure and Expertise: Our facility houses state-of-the-art instruments—including cryostats, LCM, and digital slide scanners—enabling a seamless, one-stop spatial proteomics solution from imaging to MS detection.
Detailed Workflow of Spatial Phosphoproteomics
- Imaging and ROI annotation (HE/IHC/IF): Tissue sections are stained using hematoxylin-eosin (HE), immunohistochemistry (IHC), or immunofluorescence (IF) to visualize structural landmarks or protein markers. ROIs are annotated for targeted phosphoproteomic analysis.
- Laser capture microdissection: ROIs are excised with laser capture microdissection (LCM), enabling precise sampling.
- Digestion and phosphopeptide enrichment: Excised tissue is lysed and digested to peptides. Phosphopeptides are enriched using optimized TiO2 or IMAC protocols, enhancing detection sensitivity for low-abundance phosphorylation events.
- MS acquisition strategies: High-resolution LC-MS/MS platforms, such as timsTOF Pro, acquire the enriched phosphopeptides. DIA or DDA strategies maximize coverage and quantitation accuracy.
- Post-acquisition: Phosphosites are identified, and site localization scores are calculated. Quantitative analysis across spatial regions enables comparison of phosphorylation patterns within tissue architecture.
Deliverables and Reporting Standards
- Raw Data: LC-MS/MS files with complete peptide and phosphosite information.
- Phosphosite Tables: Lists with site localization scores and quantitative values per ROI.
- Normalized Matrices: Abundance data across regions for comparative analysis.
- Pathway & Network Reports: Phosphorylation-driven signaling insights and kinase-substrate mapping.
- Visualizations: Heatmaps, spatial maps, and interactive plots for intuitive exploration.
Integration with Multi-Omics for Deeper Insight
Spatial phosphoproteomics provides highly detailed maps of protein phosphorylation across tissue regions, but its value is greatly amplified when integrated with other omics datasets.
Spatial Phosphoproteomics + Spatial Proteomics: When integrated with spatial proteomics, it becomes possible to link protein abundance and post-translational modifications within precise cellular neighborhoods, uncovering how dynamic protein interactions influence functional outcomes.
- Spatial Phosphoproteomics+Transcriptomics: By combining spatial phosphoproteomic data with transcriptomics, researchers can directly link phosphorylation events to gene expression patterns, revealing how localized signaling changes correlate with transcriptional regulation in specific cell types or tissue niches.
- Spatial Phosphoproteomics+PTMs: Integration with spatial proteomics allows simultaneous comparison of protein abundance and post-translational modifications, uncovering whether signaling changes are due to altered protein levels, dynamic kinase activity, or both.
- Spatial Phosphoproteomics+Metabolomics: Coupling with metabolomics data connects phosphorylation-driven signaling pathways to functional metabolic states, providing insight into how cellular signaling influences energy production, biosynthesis, and stress responses.
Applications of Spatial Phosphoproteomics in Research
- Cancer Biology and Tumor Heterogeneity: Spatial phosphoproteomics reveals differential phosphorylation signatures between tumor cores and surrounding stroma, illuminating tumor heterogeneity, drug resistance mechanisms, and potential therapeutic targets.
- Neuroscience and Signal Transduction Mapping: In brain research, spatial phosphoproteomics identifies region-specific phosphorylation patterns that define neuronal circuitry, synaptic regulation, and neurodegenerative processes.
- Disease Mechanism Discovery and Drug Target Validation: By mapping kinase–substrate interactions within pathological regions, researchers can pinpoint disease-associated signaling pathways, accelerating the validation of new drug targets.
- Precision Medicine and Biomarker Discovery: Spatially resolved phosphoproteomic data uncover location-specific biomarkers that reflect disease stage or therapy response, supporting biomarker-guided drug development.
Sample Requirements
| Sample Type | Requirements | Storage & Shipping |
| Tissue Sections | Fresh-frozen or formalin-fixed paraffin-embedded (FFPE) tissues. Optimal thickness: 5–10 μm. | Ship on dry ice for frozen samples or at ambient temperature for FFPE blocks. Clearly label sample ID and orientation. |
| Cell Pellets | Minimum 1 × 10⁷ cells per sample. | Store at −80°C. Ship on dry ice in leak-proof containers. |
| Tissue Lysates / Protein Extracts | Protein concentration ≥1 mg/mL; volume ≥ 100 μL. | Aliquot and store at −80°C. Ship on dry ice to maintain sample integrity. |
| Slide-mounted Samples | Clean, labeled glass slides with tissue sections no thicker than 10 μm. | Ship at room temperature in slide boxes with padding to prevent breakage. |
Why Choose Creative Proteomics for Spatial Phosphoproteomics Service
- Years of proteomics expertise in academia and industry collaborations.
- Comprehensive instrumentation, integrating imaging, LCM, and MS technologies.
- Proven reproducibility and depth across complex biological systems.
- Expert bioinformatics support, ensuring accurate interpretation and data visualization.
- Customizable service workflows, tailored to each research objective.
FAQ
-
Q1: How does spatial phosphoproteomics integrate with other omics data?
A1: Spatial phosphoproteomics can be combined with:
Transcriptomics: Linking spatial mRNA and phosphorylation profiles.
Spatial proteomics: Mapping protein abundance alongside phosphorylation.
Metabolomics: Correlating phosphorylation with metabolic states.
-
Q2: How are phosphosites quantified and validated?
A2: Quantification is typically performed using label-free DIA-MS or isobaric labeling (TMT/iTRAQ) strategies. Validation can include orthogonal methods such as phospho-specific antibodies or targeted MS (PRM/SRM). Spatial integration ensures quantification is tied to precise tissue regions.
-
Q3: Is spatial phosphoproteomics compatible with archival FFPE samples?
A3: While standard spatial proteomics can be applied to FFPE tissues, phosphorylation states may be partially lost or modified during fixation. Frozen tissues are preferred for phosphoproteomics to preserve labile phosphosites.
-
Q4: What negative and positive controls are recommended for spatial phosphoproteomics?
A4: Include non-phosphorylated peptide standards and phosphopeptide spike-ins to assess enrichment efficiency, plus adjacent tissue regions or mock-dissected blanks as negative controls to detect contamination.
Demo
Demo: Spatially Resolved Phosphoproteomics Reveals Fibroblast Growth Factor Receptor Recycling-Driven Regulation of Autophagy and Survival
This study introduces a Spatially Resolved Phosphoproteomics approach to identify FGFR2b signaling partners at recycling endosomes. The research highlights the role of FGFR2b recycling in regulating autophagy and cell survival, providing insights into receptor-mediated signaling dynamics.
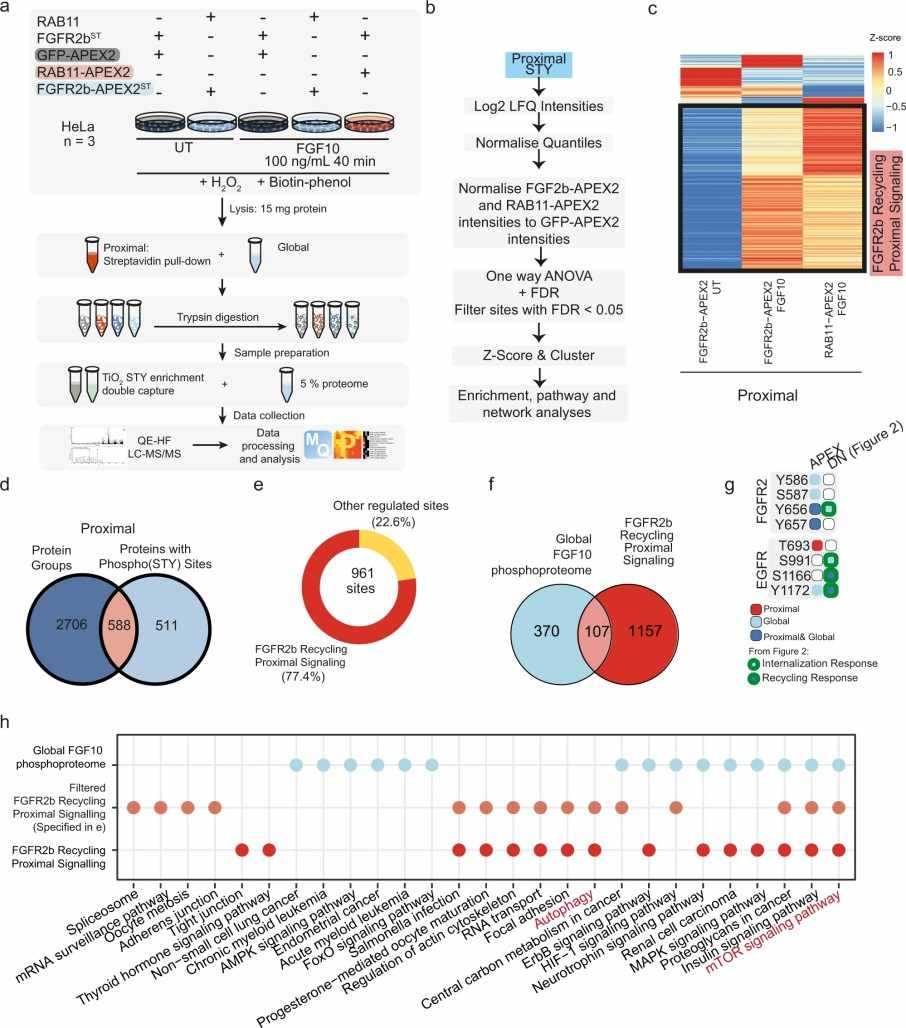
Figure 2. Spatially resolved proteomics and phosphoproteomics reveal FGFR2b-dependent regulation of mTOR signalling and autophagy (Watson J, et al. 2022).
-
Case Study
Case: A spatial vascular transcriptomic, proteomic, and phosphoproteomic atlas unveils an angiocrine Tie–Wnt signaling axis in the liver
Abstract
The study integrates spatial cell sorting with transcriptomics, proteomics, and phosphoproteomics to generate a high-resolution multiomic map of liver endothelial cells (L-ECs). It identifies zonated protein expression and phosphorylation along the portal-to-central vein axis, revealing that receptor tyrosine kinase Tie1 regulates Wnt ligand production, thereby controlling hepatocyte function and liver regeneration. The study highlights a Tie–Wnt angiocrine signaling axis as a critical determinant of vascular zonation and organ-specific liver function.
Methods
- Spatial Sorting: L-ECs were isolated from four liver lobule zones (portal node, peri-portal, peri-central, central vein) based on cKit and CD141 expression using FACS.
- Multiomic Analysis: Bulk RNA-seq, mass spectrometry-based proteomics, and phosphoproteomics were performed on spatially sorted L-EC populations.
- Validation Experiments: Functional studies included Tie1-blocking antibodies, endothelial-specific Tie1 deletion, and partial hepatectomy to assess Wnt regulation and liver regeneration.
- Bioinformatic Analysis: CoM (center-of-mass) scores correlated RNA, protein, and phosphorylation zonation patterns. Phosphorylation motifs and kinase activity were mapped to assess spatial signaling.
Results
- ~25–33% of L-EC transcripts and proteins showed zonated expression.
- Tyrosine phosphorylation was enriched in central vein L-ECs, particularly on RTKs like Tie1/Tie2.
- Tie1 specifically regulated Wnt9b expression via STAT3 and FoxO1, controlling peri-central hepatocyte proliferation.
- Tie1 disruption impaired liver regeneration after partial hepatectomy.
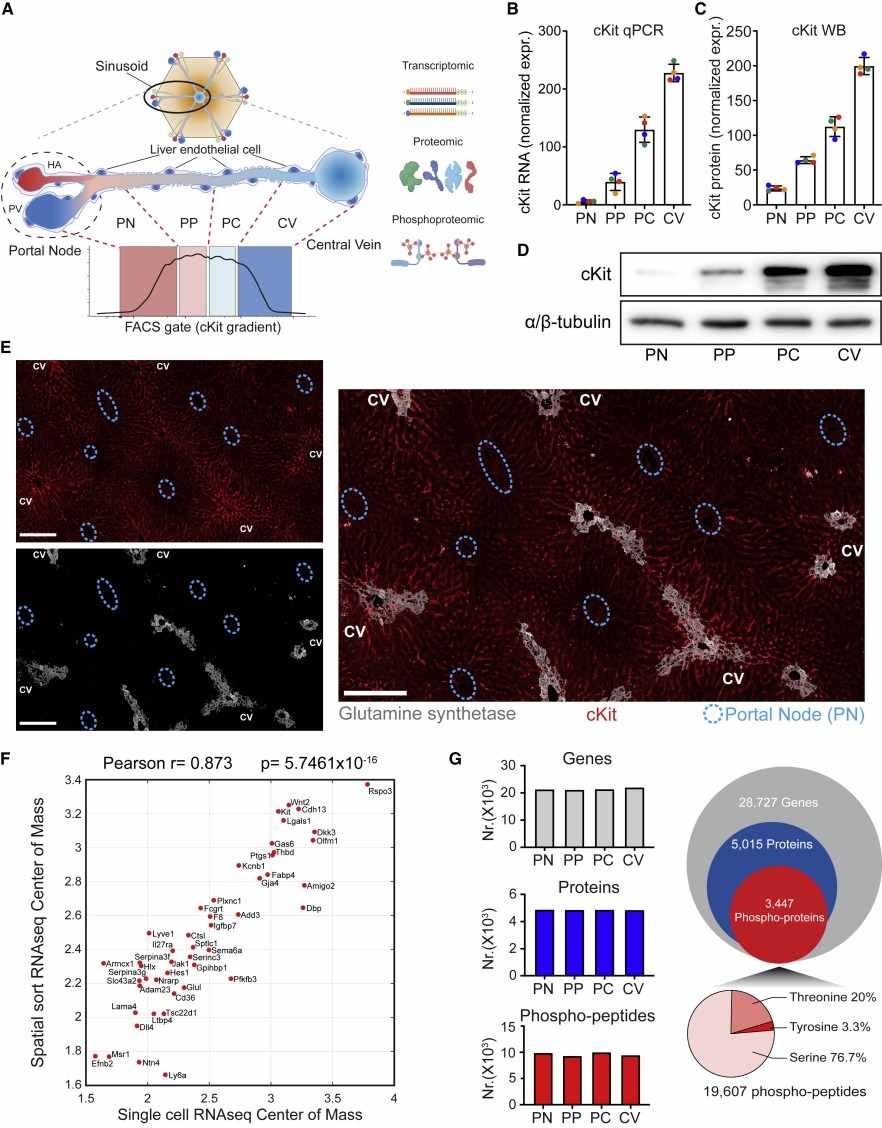
Figure 3. Spatial multiomics of the liver endothelium.
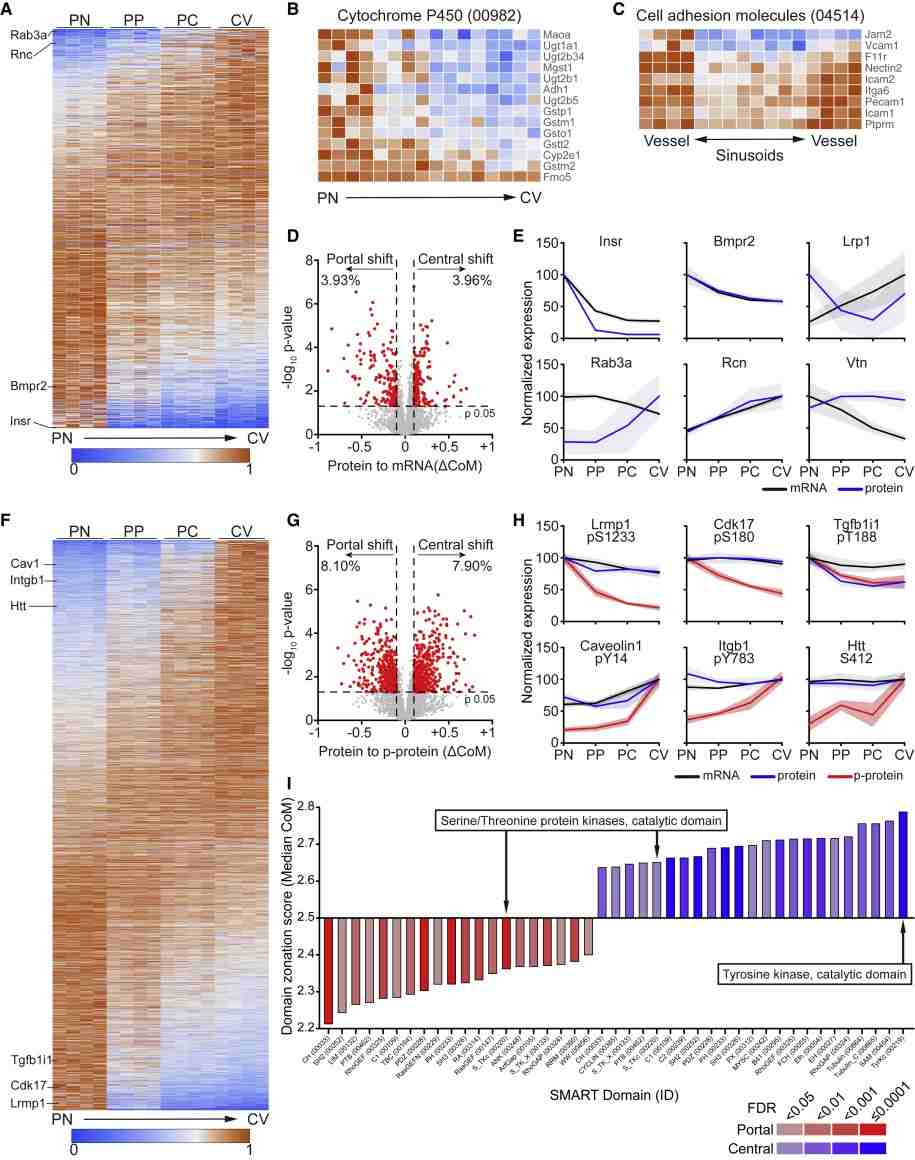
Figure 4. Spatial proteomics reveals a differential phosphorylation along the liver vasculature.
Conclusion
Spatially resolved multiomic analysis uncovers molecular zonation in liver endothelial cells. Tyrosine phosphorylation, especially via Tie1, serves as a central regulator of angiocrine Wnt signaling. The Tie-Wnt axis is essential for liver homeostasis and regeneration, highlighting spatially confined endothelial signaling as a critical determinant of organ function. The workflow provides a generalizable approach for high-resolution, multiomic studies of anatomically defined cell populations.
Related Services
References
- Wu M, et al. Spatial proteomics: unveiling the multidimensional landscape of protein localization in human diseases. Proteome science, 2024, 22(1): 7.
- Watson J, et al. Spatially resolved phosphoproteomics reveals fibroblast growth factor receptor recycling-driven regulation of autophagy and survival. Nature Communications, 2022, 13(1): 6589.
- Inverso D, et al. A spatial vascular transcriptomic, proteomic, and phosphoproteomic atlas unveils an angiocrine Tie–Wnt signaling axis in the liver. Developmental cell, 2021, 56(11): 1677-1693. e10.