- Services
- FAQ
- Case Study
- Related Services
- Support Documents
- Inquiry
What is Far UV Circular Dichroism (CD) Spectroscopy
Circular dichroism (CD) spectroscopy is a fast, simple, and accurate method for studying protein structures in dilute solutions. The structural analysis was performed using the circular dichroism of proteins and the difference in absorption of left and right circularly polarized light by asymmetric molecules.
The CD spectrum of the far ultraviolet region mainly reflects the circular dichroism of peptide bonds. In the regular secondary structure of proteins or peptides, peptide bonds are highly regularly arranged. The orientation of its arrangement determines the splitting of the peptide bond energy level transition. The positions and absorption strengths of the CD bands generated by proteins or peptides with different secondary structures are different. Therefore, the information of the secondary structure of the protein or polypeptide chain can be obtained according to the far UV CD spectrum of the measured protein or polypeptide, thus revealing the secondary structure of the protein or polypeptide.
All new biotechnology or biological products require spectral analysis as proof of conformity. As a reliable partner of biopharmaceutical companies, Creative Proteomics can provide customers with far UV circular dichroism spectroscopy analysis services based on GLP/GMP. The detectable molecules range from small chiral drugs and transition metal complexes to biological macromolecular structures such as proteins, glycoproteins and nucleic acids.
The Principles of Far UV CD Spectroscopy
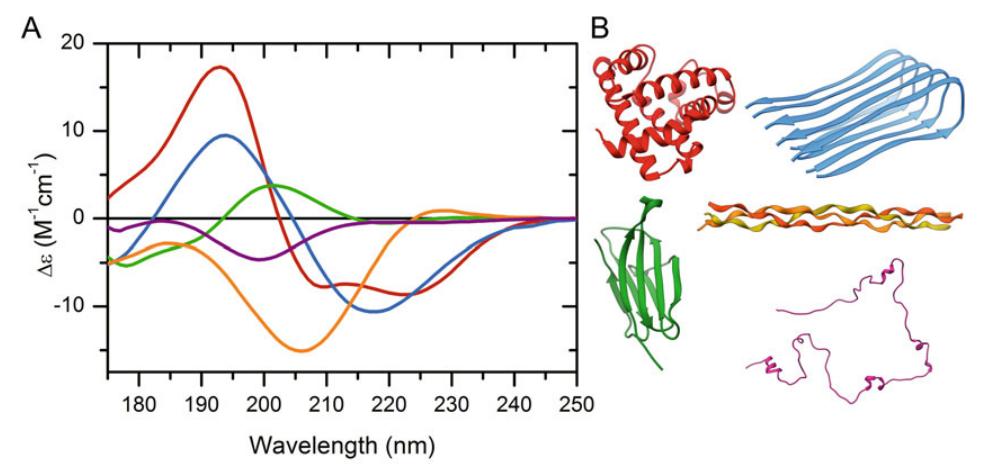
Far UV CD spectroscopy operates on the fundamental principle that peptide bonds within proteins exhibit specific optical properties when exposed to circularly polarized light. The resulting CD spectrum captures variations in the secondary structures such as α-helices, β-sheets, and random coils, based on the distinct orientation of peptide bonds.
In the far UV range, transitions of peptide chromophores dominate the CD signal. Two key electronic transitions, namely the n→π* transition (occurring around 220 nm) and the π→π* transition (at approximately 190 nm), are responsible for the most pronounced spectral features. The intensity and positioning of these CD bands are closely related to the peptide bond arrangements, allowing a highly sensitive detection of the overall secondary structure of the protein. The inherent chirality of the protein or peptide amplifies this signal, providing a structural fingerprint unique to the molecule in solution. Moreover, Far UV CD can detect subtle structural changes caused by environmental factors, such as changes in pH, temperature, or ligand binding, offering a dynamic approach to studying protein stability and interactions.
 Figure 1: Characteristic far UV CD spectra of different protein architectures, including α-helix (red), parallel β-sheet (blue), antiparallel β-sheet (green), polyproline-helix (orange), and disordered chain (purple). (Micsonai A, et al., 2021)
We Can Provide but Not Limited to
At Creative Proteomics, our far UV CD spectroscopy analysis services encompass a wide range of applications, allowing for customized analysis based on specific research or product development needs. We offer the following services, though we can extend to other customized requirements as necessary:
- Protein Conformational Analysis: Determining changes in protein structure under varying environmental conditions, such as pH shifts, temperature variations, and ligand binding.
- Thermal Stability Assessments: Monitoring protein aggregation, denaturation, and refolding events, providing thermodynamic profiles for stability studies.
- Secondary Structure Estimation: Accurate determination of α-helix, β-sheet, and random coil content within proteins.
- Protein Folding Studies: Insights into the folding pathways and the detection of intermediate conformations during folding events.
- Preliminary Protein Screening: Offering fast, preliminary detection of target proteins before further structural analysis, such as X-ray crystallography or NMR.
- Drug Analysis: Providing quantitative analyses of optically active drugs, ensuring consistency and quality in pharmaceutical products.
Far UV CD Spectroscopy Analysis Workflow
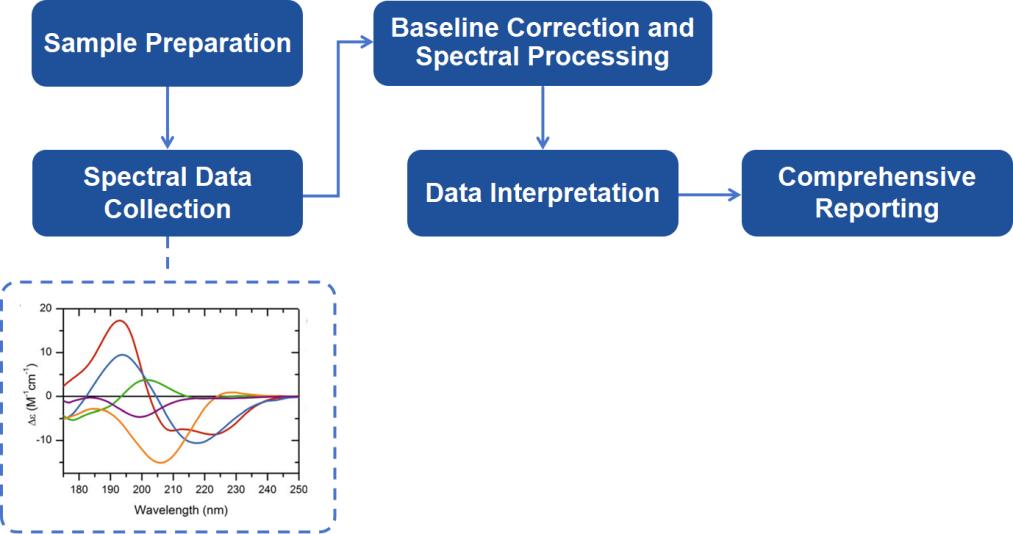
Our Far UV CD spectroscopy analysis workflow is designed to offer maximum efficiency and accuracy, with results available in as little as 5-7 business days. Below is a breakdown of the workflow:
Sample Preparation: Preparing high-purity samples in appropriate buffers. Samples must meet specific criteria to ensure optimal data collection.
Spectral Data Collection: Using state-of-the-art CD spectrometers, we acquire spectra over the far UV region. Our equipment is calibrated to ensure the highest accuracy, and pathlengths are optimized for each sample concentration.
Baseline Correction and Spectral Processing: A baseline spectrum is acquired from the buffer alone, which is subtracted from the sample spectrum to yield a corrected CD signal. Further processing includes converting the signal into molar circular dichroism (Δε) to normalize for sample concentration and pathlength.
Data Interpretation: Our scientists interpret the CD spectra, focusing on the identification and quantification of secondary structural elements. We employ proprietary algorithms to provide detailed and reliable structural insights, including the percentage of α-helices, β-sheets, and irregular structures.
Comprehensive Reporting: After the analysis, we provide a detailed report that includes the CD spectra, a breakdown of secondary structure, and an interpretation of the data.

Sample Requirements
- Purity: Samples must be at least 95% pure, as verified by methods such as HPLC, mass spectrometry, or SDS-PAGE.
- Concentration: A minimum concentration of 0.5 mg/mL is required, with a total sample volume of at least 200 μg. For low-concentration samples, optimized pathlength cells can be used to ensure high-quality spectra.
- Buffer Conditions: Buffers must be free from compounds with high absorbance in the 190-250 nm region. Common buffers such as phosphate (pH ~7) and borate (pH ~8.5) are ideal, while avoiding additives like high concentrations of DTT, histidine, or imidazole that interfere with spectral collection.
FAQ
Q: What types of samples can you analyze using Far UV CD spectroscopy?
A: We can analyze a wide range of biological molecules, including proteins, glycoproteins, peptides, and nucleic acids. Our services extend to small chiral drugs and transition metal complexes as well. It's important that the samples meet our purity and concentration requirements for optimal results.
Q: Can you test the sample concentration below the required minimum?
A: If your sample concentration is below the minimum of 0.5 mg/mL, we can use specially designed pathlength cells to facilitate the analysis. However, please discuss your sample details with us prior to submission, so we can determine the best approach for your needs.
Q: How does Far UV CD spectroscopy help in the drug development process?
A: By analyzing the far UV CD spectra, researchers can assess the secondary structure content, such as α-helices and β-sheets, and monitor any conformational changes that may occur due to mutations, ligand binding, or environmental factors. This information is vital for predicting the functional behavior of proteins and for identifying potential issues early in the development process.
Additionally, Far UV CD spectroscopy enables rapid assessments of structural integrity during formulation development. It allows scientists to evaluate how different excipients or formulation conditions impact protein stability and folding, which is critical for ensuring the shelf-life and efficacy of therapeutic proteins. Quality control measures also benefit from CD spectroscopy, as it can help identify deviations in protein structure that may arise during production, ensuring that only high-quality products are brought to market.
Case Study
Case: Circular Dichroism Spectroscopy as a Tool for Monitoring Aggregation in Monoclonal Antibody Therapeutics
Background
This study investigates the early detection of conformational changes and aggregation in monoclonal antibodies (mAbs) using far-UV circular dichroism (CD) spectroscopy compared to size exclusion chromatography (SEC). Understanding these changes is critical for ensuring the stability and efficacy of mAb formulations, especially under varying pH and temperature conditions.
Methods
- Analysis of mAb samples using far-UV CD and SEC in different buffers (citrate at pH 3 and phosphate at pH 6.5).
- Measurement of ellipticity at 218 nm to assess secondary structure changes over time and temperature.
- Screening of 15 different formulation buffers for thermal stability over 45 days at 4 and 30 °C.
Results
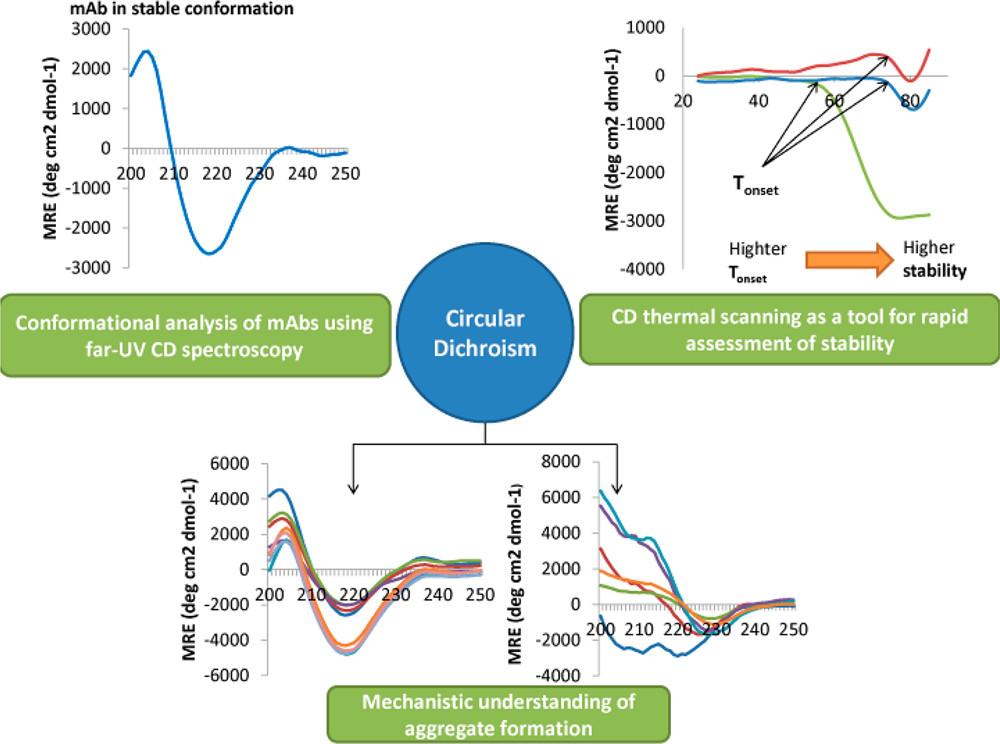
- Far-UV CD Sensitivity: Detected significant secondary structure loss in citrate buffer at pH 3 after 6 hours; SEC indicated aggregates after 24 hours.
- Stability in Phosphate Buffer: No significant changes in SEC after 168 hours; CD showed gradual decrease in MRE values, indicating conformational changes.
- Mechanism of Aggregation: Increased β-sheet content correlated with aggregation; distinct CD spectra in citrate versus acetate buffers elucidated different aggregation mechanisms.
- Thermal Stability Screening: Formulations F1–F3 retained stability; F5–F15 exhibited structural loss. CD provided rapid assessment, allowing efficient formulation development.
 Figure 2. The versatility of CD spectroscopy toward understanding aggregation of mAb therapeutics.
References
- Micsonai A, et al. BeStSel: from secondary structure analysis to protein fold prediction by circular dichroism spectroscopy. Structural genomics: general applications, 2021: 175-189.
- Rogers D M, et al. Electronic circular dichroism spectroscopy of proteins. Chem, 2019, 5(11): 2751-2774.
- Joshi V, et al. Circular dichroism spectroscopy as a tool for monitoring aggregation in monoclonal antibody therapeutics. Analytical chemistry, 2014, 86(23): 11606-11613.
Related Services
Support Documents
KNOWLEDGE CENTER
KNOWLEDGE CENTER


