Due to their asymmetric three-dimensional structures, circular dichroism (CD) arises from the differential absorption of left- and right-circularly polarized light by chiral molecules. This phenomenon transforms transmitted light into elliptically polarized light, which is observable only at specific absorption wavelengths. CD spectra are typically measured in the ultraviolet to visible light range, utilizing the interaction between electromagnetic waves and molecular structures to differentiate and quantify the absorption differences of left- and right-circularly polarized light after passing through a sample. Furthermore, based on CD spectral data, theoretical frameworks such as Chou's rules provide critical insights for deducing conformational changes and relative proportions of chiral molecules.
Elucidating the three-dimensional structure of proteins is fundamental to understanding their function in protein research. Circular dichroism spectroscopy (CD spectroscopy) is a powerful analytical tool capable of rapidly providing structural information on proteins without the need for high-resolution structural determination.
This paper will provide a comprehensive overview of the principles of CD spectroscopy, the operational mechanisms of CD instruments, and their applications in protein structural analysis.
What is Circular Dichroism (CD) Spectroscopy
CD spectroscopy originates from the mineral cordierite, where this optical phenomenon was first observed. CD spectroscopy is an analytical technique to investigate molecular structures, particularly the secondary and tertiary structures of biomacromolecules such as proteins, antibody and nucleic acids.
Principles of CD Spectroscopy
The fundamental principle of CD spectroscopy is based on the differential absorption of left- and right-circularly polarized light by chiral molecules. This unique optical property enables the technique to provide valuable insights into molecular structures, particularly in studying proteins and nucleic acids. The detailed principles of CD spectroscopy are outlined below.
Polarization of Light
Light, as a form of electromagnetic radiation, consists of two mutually perpendicular vector components: the electric field vector (E) and the magnetic field vector (M). In its natural state, light is typically unpolarized.
Characteristics of Chiral Molecules
Optical activity is a unique property of chiral molecules containing a carbon atom bonded to four distinct substituents. Linearly polarized light can be regarded as a superposition of the components of left- and right-circularly polarized light.
When linearly polarized light passes through a chiral molecule, the asymmetric nature of the molecule causes differential absorption of the two circular polarization components, leading to a rotation in the plane of polarization. This rotation is quantified as the specific rotation, which measures the degree to which a substance rotates polarized light at a given wavelength and temperature. Specific rotation is commonly used to assess molecular purity and concentration.
As a result of this differential absorption and phase shift, initially circularly polarized light emerges as elliptically polarized light after interacting with a chiral molecule. By analyzing this rotational effect, CD spectroscopy provides a powerful means to investigate molecular chirality and rapidly obtain structural information on proteins without requiring high-resolution structural determination.
Chromophores and CD Signals
The CD signals of chromophores arise from their electronic transitions, which are influenced by the chiral environment of the molecule. CD spectroscopy measures the differential absorption of left- and right-circularly polarized light by chromophores at various wavelengths, thereby providing detailed insights into the secondary and tertiary structures of proteins.
Generation of CD Spectra
Consider a hypothetical substance, A, to illustrate the working principle of CD spectroscopy. Imagine two incident light beams: left-elliptically polarized light (E) and right-elliptically polarized light (E). The differential interaction of these light beams with substance A results in the characteristic CD spectrum, which reflects the sample's molecular structure and chiral properties.
Before entering substance A, both left-elliptically (E) and right-elliptically (E) polarized light beams maintain identical amplitude, energy, shape, and size. However, as these beams pass through substance A, they interact with the molecules within the material. During this interaction, the right-circularly polarized light is absorbed to a greater extent than the left-circularly polarized light. This imbalance in absorption results in the emergence of a new light state—elliptically polarized light—marking a fundamental principle underlying CD spectroscopy.
The difference in absorption between left- and right-circularly polarized light is denoted as ΔA, calculated as the absorption difference between the two polarization components. ΔA is the fundamental measurement in circular dichroism (CD) spectroscopy and is typically expressed in terms of ellipticity. The unit of ellipticity can be square centimeters per gram (cm²/g) or square centimeters per deciliter (cm²/dL). The magnitude of ellipticity reflects the differential absorption of chiral light by the molecule, providing critical insights into the structural characteristics of substance A.
Notably, these absorption differences are often minimal, typically within the range of 10 millidegrees. Consequently, precise detection of these minute variations is essential. Since CD spectrometers are highly noise-sensitive, maintaining experimental conditions is crucial. Using clean cuvettes and low-absorbance buffer solutions is essential to minimize background interference. To optimize the signal-to-noise ratio, buffers with extremely low salt concentrations are commonly used, reducing noise contamination and improving measurement accuracy.
Working Principle of Circular Dichroism Spectrometers
Modern CD spectrometers have significantly improved the accuracy and scope of CD spectroscopy applications. These instruments utilize xenon or helium-argon lamps to generate unpolarized light, which is converted into linearly polarized light by a monochromator. Subsequently, a photoelastic modulator (PEM) generates alternating right- and left-circularly polarized light, which interacts with the sample. The resulting differential absorption signals are detected and amplified by highly sensitive photomultiplier tubes, converting the optical data into digital readouts for precise protein absorbance measurements.
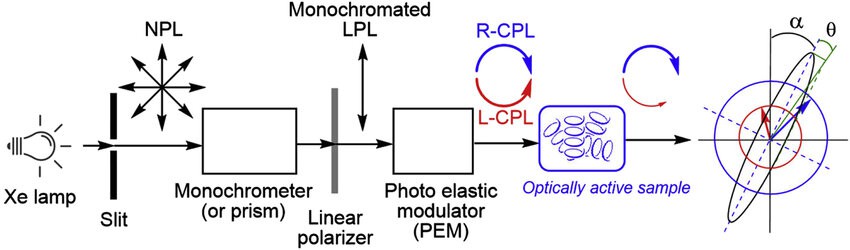 Figure 1. Schematic diagram of a CD spectrometer. (Tamaki Nakano et al., 2020)
You May Be Interested In
Learn More
Sample Requirements
| Sample Type | Requirements |
| Liquid CD | - High sample purity to minimize absorption interference from contaminants. - Concentration: Typically 0.1–1 mg/mL, with optimal concentrations determined experimentally or based on prior literature. - Solvent: A blank control is required to ensure solubility and stability.- Optical Cell: Specialized CD cells, usually quartz or glass. - Temperature: Maintained at 20–25°C.- Documentation: Sample composition and concentration must be noted. Molecular weight and amino acid count should be provided for secondary structure analysis. |
| Solid CD | - Minimum sample quantity: 150–200 mg, preferably powdered. - Sample preparation: Fine grinding with KBr (1:150 ratio) for optimal transparency. - Measurement techniques: Pellet pressing or liquid paraffin suspension. - Special considerations: Hygroscopic KBr should be well-sealed before shipping. If transmission is poor, an integrating sphere mode is recommended. |
Factors Affecting CD Measurements
CD spectra in the far-UV region primarily reflect the arrangement of protein peptide bonds, providing secondary structure composition data (e.g., α-helices, β-sheets, turns, and random coils). In the near-UV region, CD spectra provide information on side-chain chromophores such as tryptophan, phenylalanine, tyrosine, and disulfide bond microenvironments.
The accuracy of CD analysis is influenced by several factors, including:
Instrument sensitivity
Quality of sample preparation
Accuracy of deconvolution software and reference datasets
Thus, CD results are often complemented by other structural biology techniques to comprehensively understand protein conformation. The precise concentration of protein samples is crucial for secondary structure calculations, and samples should be free from absorbing impurities. Buffers must be transparent in the measurement wavelength range, and proteins should be fully dissolved to form homogeneous solutions. Typical sample concentration requirements are 0.2 μg/μL, with purity exceeding 90%. Protective agents and extraneous substances should be avoided. Buffer solutions should be pre-screened for transparency and solubility compatibility.
Experimental Procedure
Step Description
Sample Preparation Dissolve the analyte in an appropriate solvent and control the concentration accordingly. Proteins or nucleic acids should be diluted in a suitable buffer.
Cell Loading : Inject the sample into the CD optical cell, ensuring no bubbles or contaminants.
Baseline Correction : Measure the CD signal of the blank buffer to account for background absorption. Calibration with a known chiral compound ensures instrument accuracy.
Data Acquisition : Operate the CD spectrometer to record differential absorption over a wavelength range of approximately 190–250 nm.
Data Analysis Process CD spectra using specialized software to extract structural information. Background signals are subtracted to obtain net CD spectra.
Applications of CD Spectroscopy
Protein Secondary Structure Analysis
CD spectroscopy is widely employed to determine the secondary structures of proteins, such as α-helices, β-sheets, and random coils. Researchers can gain preliminary structural insights by comparing experimental CD and standard reference spectra before conducting high-resolution analyses like X-ray diffraction or NMR spectroscopy.
The figure below illustrates a typical far-UV CD spectrum (190–250 nm), where different protein secondary structures exhibit characteristic ellipticity (θ) patterns, providing valuable conformational information.
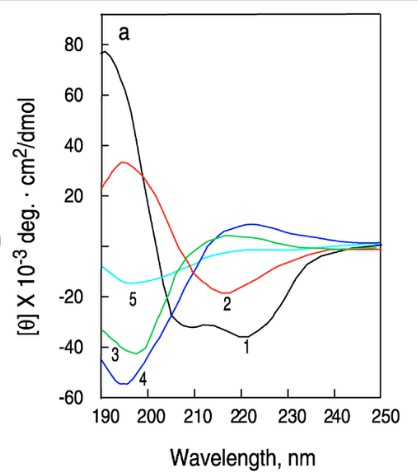 Figure 2. Circular dichroism (CD) spectra of proteins and peptides (Norma J Greenfield 2006)
The CD spectra corresponding to different secondary structures exhibit distinct visual characteristics. Specifically, the α-helix spectrum is represented by a black line, while the spectrum of antiparallel β-sheets is depicted in red. A green line indicates disordered random coils, whereas collagen triple helices and D-type collagen are denoted by blue and light blue lines, respectively. By leveraging these spectral signatures, the CD spectrum of a target protein can be compared to reference spectra of known secondary structures. The degree of similarity between the target spectrum and reference spectra can be quantitatively assessed using mathematical fitting functions.
Through such comparative analyses, it is possible to estimate the relative proportions of different secondary structural elements within a given protein. For instance, one may determine whether a protein consists predominantly of α-helices (80%) and β-sheets (20%) or whether it comprises 70% α-helices, 20% β-sheets, and 10% disordered regions. This estimation provides a preliminary yet reliable understanding of the protein's three-dimensional conformation and can be easily achieved.
Insights into Protein Tertiary Structure
Beyond secondary structure analysis, CD spectroscopy also provides valuable insights into protein tertiary structures. Detailed information regarding the overall protein fold can be obtained by examining both the far-UV (190–260 nm) and near-UV (260–320 nm) regions of the spectrum.
For example, comparative analysis of the CD spectra of wild-type and mutant proteins enables the assessment of structural similarities or deviations. This, in turn, facilitates the investigation of whether loss of function in a mutant protein is associated with subtle alterations in its tertiary structure.
Evaluation of Cofactor Binding Sites
CD spectroscopy can also be employed to evaluate the integrity of cofactor binding sites and assess protein structural stability. When cofactors such as pyridoxal phosphate and heme bind to proteins, significant changes in absorbance are often observed. CD spectroscopy can monitor these alterations, providing critical insights into protein function and stability.
For instance, CD spectroscopy can be used to compare the structural and functional characteristics of two distinct forms of a protein: a prokaryotic variant and a recombinant version, the latter of which may be composed of two fused domains. Despite sequence differences, CD spectral analysis allows for a structural and functional comparison of these proteins. In recombinant protein construction, individual protein fragments are first expressed and purified separately before being assembled into a complete protein. CD spectroscopy can then assess whether the recombinant construct retains the expected structural and functional properties.
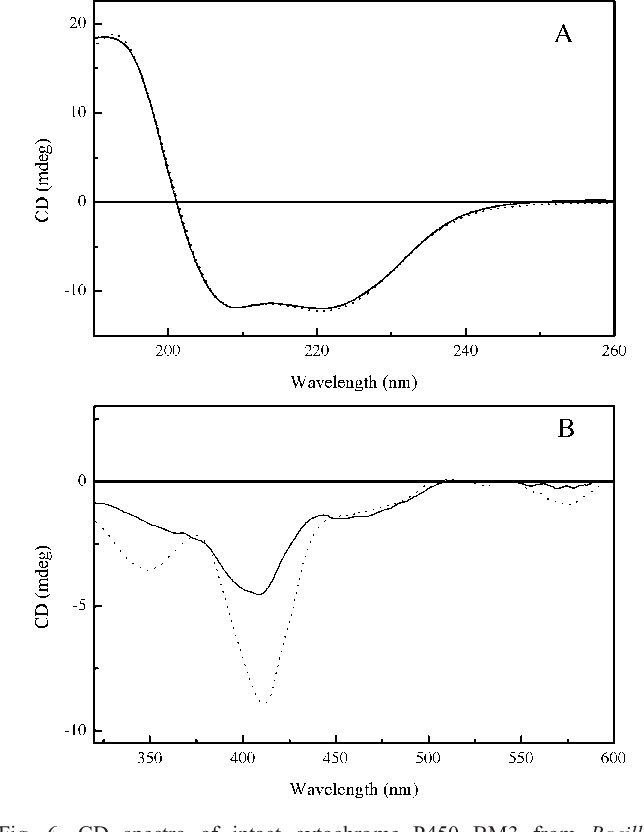 Figure 3. CD spectra of intact cytochrome P450 BM3 from Bacillus megaterium and a mixture of its constituent domains expressed as recombinant proteins in E. coli.( S. Kelly et al., 2005)
CD spectroscopy enables the observation of protein spectral characteristics across different wavelengths. While wild-type and mutant proteins exhibit minimal spectral differences in the far-UV region, a pronounced spectral shift is often observed at longer wavelengths. This shift is typically attributed to differences in cofactor binding.
The distinct absorption features of the mutant protein, compared to the wild-type, provide critical insights into potential disruptions at the cofactor binding site and the consequent effects on protein structural stability.
Monitoring Subtle Conformational Changes in Proteins
CD spectroscopy is also a powerful tool for detecting subtle protein conformational changes. The progressive destabilization of protein structure can be assessed by gradually increasing the temperature and monitoring corresponding spectral variations. In the near-UV spectral region, a decrease in signal intensity is an important indicator of localized conformational changes within specific regions of the protein.
Investigating Protein Folding
CD spectroscopy plays a crucial role in the study of protein folding. By analyzing the folding process of proteins in different states, this technique provides valuable insights into the dynamic mechanisms underlying protein folding, including folding rates and folding constants.
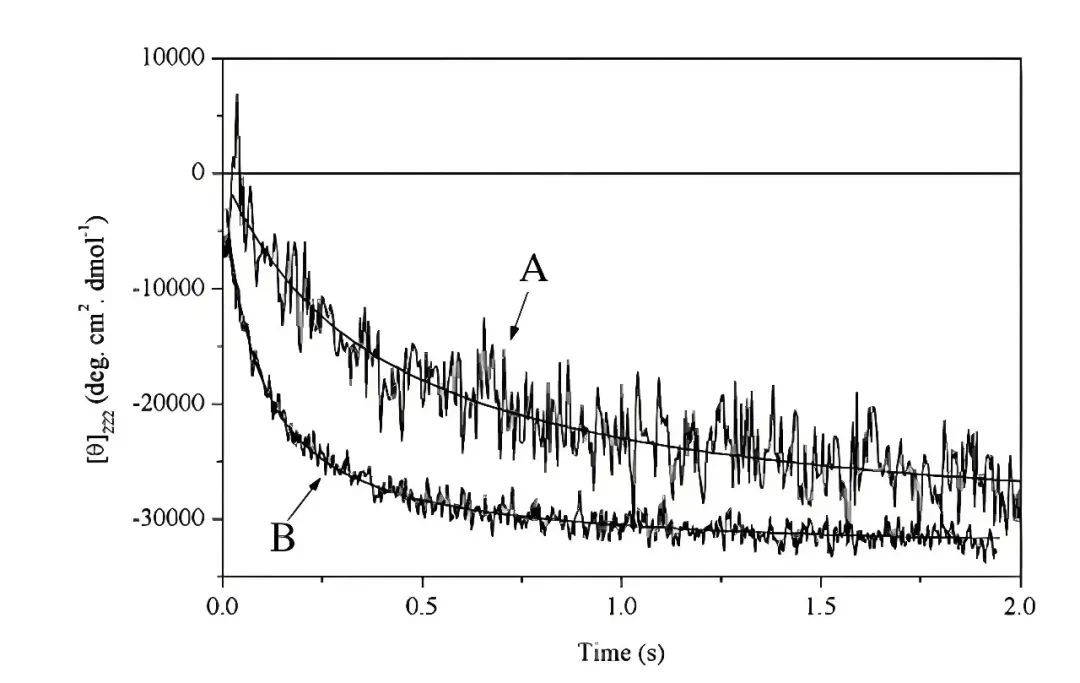 Figure 4. The refolding of a leucine zipper peptide monitored by stopped flow CD at 222 nm. (S. Kelly et al., 2005)
The studies strongly support the 'molten globule state' hypothesis prior to protein folding. However, it is noteworthy that this state of small peptides has not yet been directly validated using circular dichroism (CD) spectroscopy, suggesting that the folding mechanisms of small peptides may differ significantly from those of larger proteins.
Nucleic Acid Conformation:
CD spectroscopy can be employed to study conformational changes in DNA and RNA, such as the twisting and helical structure of double-stranded DNA.
Drug Screening and Development:
CD spectroscopy plays a crucial role in drug development. It enables the analysis of interactions between drugs and proteins or nucleic acids. It is essential for investigating the structure-activity relationships of drugs and their conformational changes.
Learn more:
Food Analysis:
CD spectroscopy can identify chiral molecules, assess food quality, and verify authenticity by measuring the optical rotation properties of food.
Environmental Monitoring:
CD spectroscopy is used to detect and analyze organic pollutants in the environment. Measuring the optical rotation signals of these pollutants provides information about their conformation, molecular structure, and other characteristics.
Furthermore, circular dichroism is a key technology for studying protein secondary structures and conformational changes. By measuring CD spectra under varying conditions such as pH, temperature, or ionic strength, researchers can gain insights into the conformational stability and dynamic changes of protein samples. Specialized software and algorithms, such as SELCON3, CONTIN, or CDPro, allow for the quantitative analysis of secondary structure components (e.g., α-helix, β-sheet, random coil) and dynamic studies based on CD data.
FAQ
Does a blank sample count as one sample when ordering?
No, the blank solvent is only used as a control and is not charged separately.
What is the required sample concentration?
The typical concentration should yield a UV absorbance of 1-2 for UV absorption-based measurements.
Can solid samples be tested?
Only powdered samples can be tested.
How should the appropriate concentration for CD spectroscopy be determined?
If CD has not been measured previously or there is no literature available, it is recommended to use a sample concentration approximately half of the UV concentration, adjusting if necessary.
Does the blank solvent need to be subtracted as a background? Does it count as a sample?
No, the blank solvent is only used for background subtraction and is not considered a sample. No additional fees are charged.
Can CD spectroscopy be conducted with less than 5 mL of solvent?
Under non-strict conditions, 2 mL of sample may suffice.
Should the sample for CD spectroscopy be dissolved in PBS?
Yes, it should be dissolved in PBS. If it has not already been dissolved, please provide the solvent for background subtraction.
Is the CD spectroscopy wavelength range based on UV absorption? What is the concentration requirement?
The wavelength range for UV absorption is used. The optimal concentration for UV absorption is typically when the absorbance is between 1 and 2.
What is CD spectroscopy?
CD spectroscopy is an optical rotation spectroscopy used to infer the configuration and conformation of chiral molecules.
What does CD spectroscopy measure?
Circular dichroism (CD) spectroscopy measures optical rotation at specific wavelengths to assess the chirality of a substance. A single wavelength measurement provides no conclusive information, but a series of data over a wavelength range can identify optical isomers, particularly when Cotton effects are observed.
How should CD spectra be interpreted for natural product chemistry?
For novel compounds, comparing their CD spectra with known compounds with similar structures can help determine the absolute configuration. Cotton effects with opposite signs typically indicate the opposite configurations of two chiral centers. Nuclear magnetic resonance (NMR) coupling constants may also aid in determining relative configurations. For entirely new structures, quantum chemistry simulations can predict CD spectra for various configurations, allowing comparison with experimental results to determine the correct absolute configuration.
Conclusion
Circular dichroism (CD) spectroscopy is an essential technique with broad applications in chemical, biological, and engineering fields. By measuring the optical rotation properties of molecules, CD spectroscopy provides critical insights into molecular structure and function, especially in biopharmaceutical research. CD spectroscopy is capable of high-sensitivity, high-resolution analysis of protein secondary structures. It can be used to study the structural features of macromolecular complexes and their interactions with other molecules. This functionality has contributed significantly to advancing the understanding of protein structure and function and accelerating drug development. As the technology evolves, its applications in drug development, food safety, and environmental protection are expanding. Moreover, combining CD with other techniques, such as mass spectrometry and nuclear magnetic resonance (NMR), further enhances its capabilities, providing more comprehensive and in-depth analytical tools. By analyzing differences in CD spectra of proteins in their free form and bound to other molecules, CD spectroscopy provides valuable insights into molecular interactions and drug design, indicating its promising future in scientific research and practical applications.
References
- Paramita, V.D.; Panyoyai, N.; Kasapis, S. Molecular Functionality of Plant Proteins from Low- to High-Solid Systems with Ligand and Co-Solute. Int. J. Mol. Sci. 2020, 21, 2550. https://doi.org/10.3390/ijms21072550
- Crain AV, Broderick JB. Flavodoxin cofactor binding induces structural changes that are required for protein-protein interactions with NADP(+) oxidoreductase and pyruvate formate-lyase activating enzyme. Biochim Biophys Acta. 2013 Dec;1834(12):2512-9. DOI: 10.1016/j.bbapap.2013.08.014. Epub 2013 Sep 7. PMID: 24016774; PMCID: PMC4012331.
- Shahabadi N, Kashanian S, Darabi F. DNA binding and DNA cleavage studies of a water soluble cobalt(II) complex containing dinitrogen Schiff base ligand: the effect of metal on the mode of binding. Eur J Med Chem. 2010 Sep;45(9):4239-45. DOI: 10.1016/j.ejmech.2010.06.020. Epub 2010 Jun 17. PMID: 20598781.
- Hutterer, K.M., Ip, A., Kuhns, S. et al. Analytical Similarity Assessment of ABP 959 in Comparison with Eculizumab Reference Product. BioDrugs 35, 563–577 (2021). https://doi.org/10.1007/s40259-021-00492-9
- Improved mycobacterial protein production using a Mycobacterium smegmatis groEL1ΔCexpression strain | BMC Biotechnology | Full Text. https://bmcbiotechnol.biomedcentral.com/articles/10.1186/1472-6750-11-27


