Get Your Custom Quote

Online Inquiry

Biomarker Validation by PRM/MRM Service

Multiplexed, quantitative validation of candidate protein biomarkers using targeted LC-MS/MS (PRM/MRM) with stable isotope-labeled internal standards. Our platform bridges the gap between discovery proteomics and clinical validation, delivering reproducible, publication-ready biomarker quantification across biological cohorts — from dozens to thousands of samples — with defined LOD, LOQ, linearity, and inter-batch reproducibility metrics.

Research Use Only (RUO) Notice: All services and data provided are strictly for non-clinical research purposes. Our analytical results are not intended for clinical diagnosis, patient management, or therapeutic decision-making.

Services Technologies Demo Case Study FAQ Related Services

CORE SERVICE

Biomarker Validation by PRM/MRM — Multiplexed Targeted Quantification for Biomarker Verification

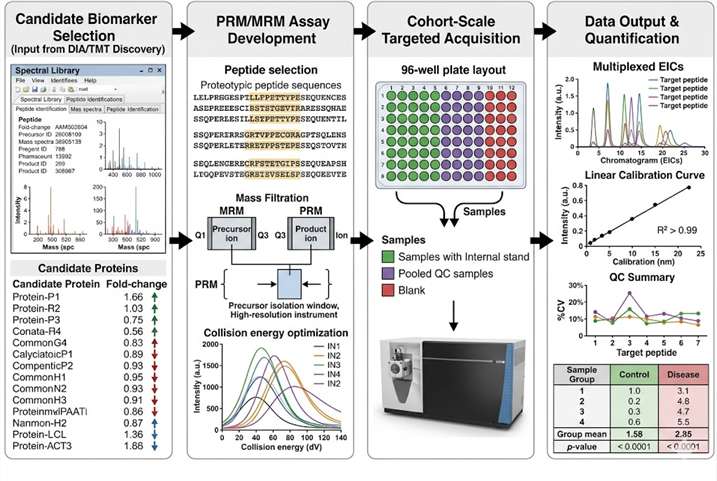
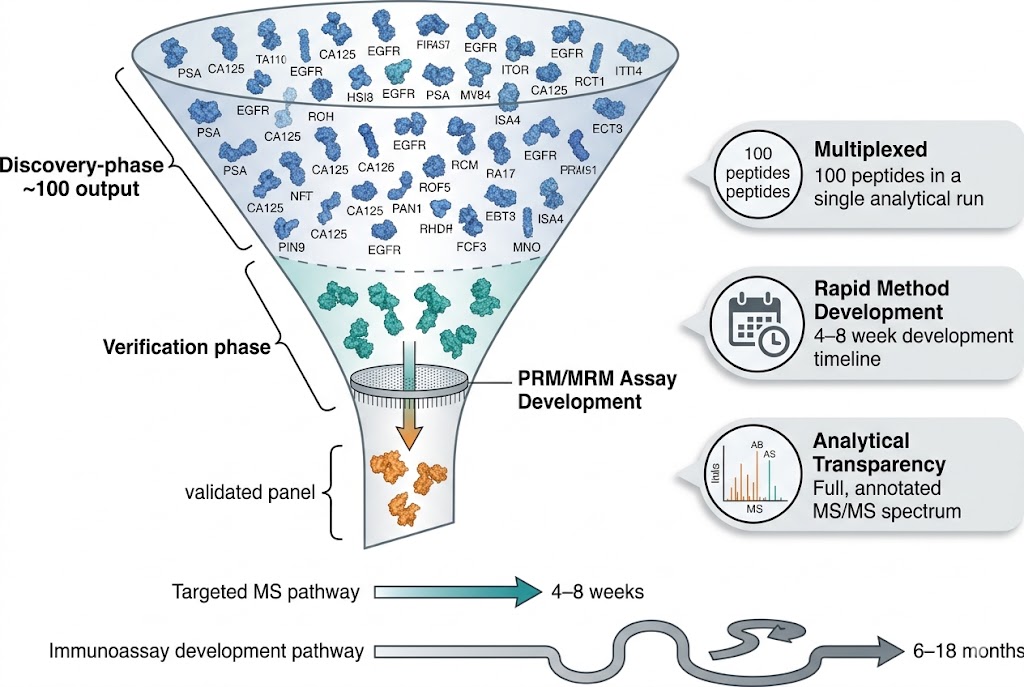
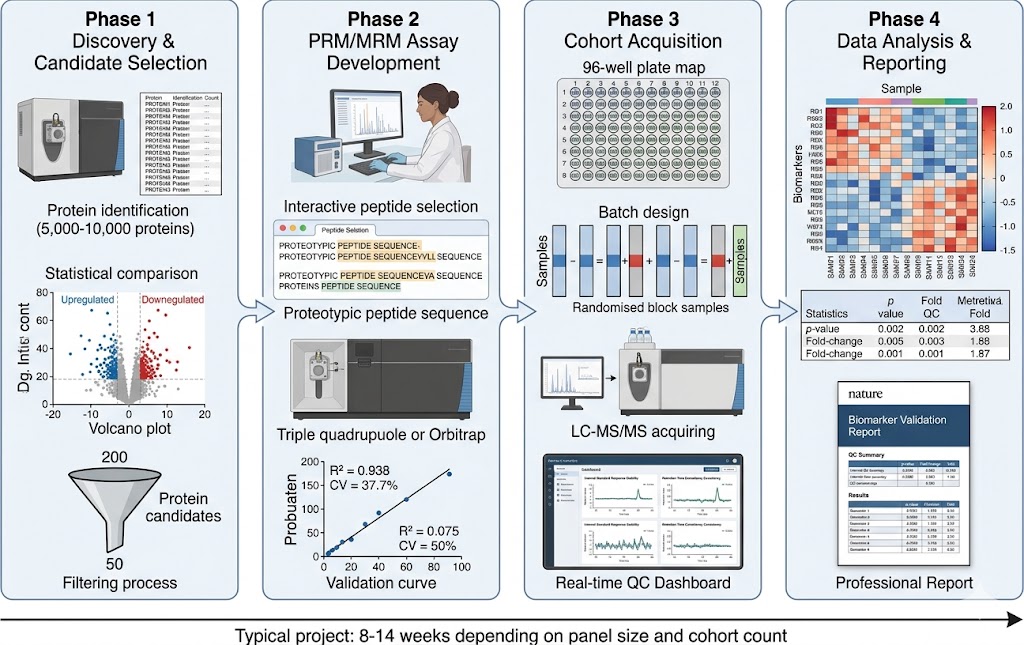
The transition from discovery-phase biomarker identification to robust, analytically validated assays is the most critical bottleneck in the biomarker development pipeline. Discovery proteomics (DIA, TMT, label-free) routinely generates hundreds of candidate biomarkers, but converting these candidates into quantitatively reliable, multiplexed assays suitable for cohort-scale validation requires a fundamentally different analytical approach. Immunoassay-based validation is constrained by antibody availability, cross-reactivity, and limited multiplexing capacity — typically 1–10 targets per assay.

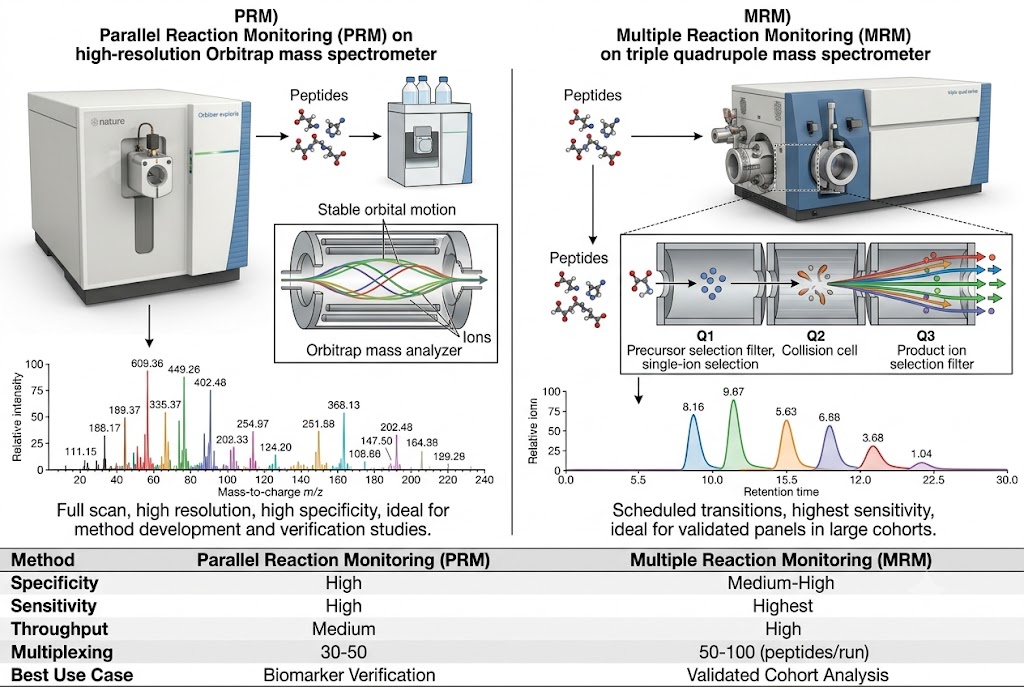
Our Biomarker Validation by PRM/MRM service addresses this gap directly. Using targeted LC-MS/MS acquisition on high-resolution Orbitrap/QqTOF (PRM) and triple quadrupole (MRM) platforms, we develop custom multiplexed assays that quantify 10–100+ candidate biomarkers simultaneously in a single analytical run. Stable isotope-labeled internal standards (AQUA/SIS peptides) provide absolute or relative quantification with documented analytical performance, while batch-randomised study designs and systematic QC frameworks ensure data quality across large cohorts.

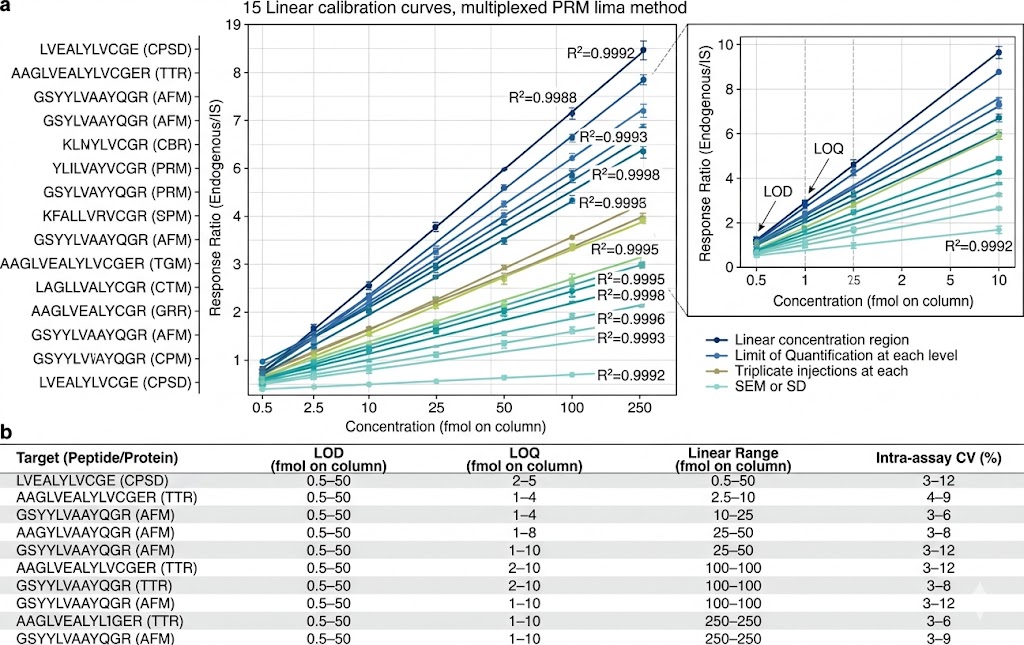
  • Multiplexed Targeted Quantification: 10–100+ candidate biomarkers quantified simultaneously in a single scheduled LC-MS/MS run using PRM or MRM acquisition. Stable isotope-labeled internal standards for each target enable absolute quantification (fmol/µg protein) or standardised relative quantification with defined LOD, LOQ, linear dynamic range, and intra-/inter-assay CV metrics.
  • Discovery-to-Validation Pipeline: Seamless transition from DIA/TMT discovery data to PRM/MRM validation assays. Our team designs targeted methods directly from discovery spectral libraries, selects proteotypic peptides with optimal MS properties, optimises transitions and collision energies, and applies the validated method to full cohort analysis — preserving biological context from discovery through validation.
  • Cohort-Scale Reproducibility: Batch-randomised study designs with pooled QC injections every 5–10 samples, internal standard response monitoring, blank injections, and inter-batch CV assessment. Our reporting package documents all QC metrics, enabling reviewers and collaborators to assess data quality independently.
Biomarker validation workflow diagram showing PRM/MRM targeted LC-MS/MS pipeline from discovery data through cohort-scale quantification

Biomarker validation workflow: from DIA/TMT discovery data through PRM/MRM assay development to cohort-scale quantification with stable isotope internal standards.

The Biomarker Validation Challenge

Biomarker discovery using untargeted proteomics has matured into a robust and accessible technology — DIA, TMT, and label-free workflows routinely quantify 5,000–10,000 proteins across discovery cohorts. However, the verification and validation phases that follow discovery remain the primary bottleneck in the biomarker pipeline. A typical discovery study may nominate 50–200 candidate biomarkers, but validating even a fraction of these candidates across independent, adequately powered cohorts requires analytical methods that are quantitative, reproducible, multiplexed, and cost-effective at scale.

Targeted mass spectrometry addresses this need through three fundamental advantages over immunoassay-based approaches. First, multiplexing capacity — a single PRM or MRM method can quantify 50–100 peptides in a 30–60 minute LC-MS/MS run, covering 30–70 protein biomarkers without the cross-reactivity concerns of multiplexed immunoassays. Second, method development speed — PRM/MRM assays can be developed and validated in 4–8 weeks, compared to 6–18 months for a comparable panel of immunoassays. Third, analytical transparency — each target peptide is measured directly with full mass spectrometric evidence, and all raw data are available for independent review.

The most common workflow begins with discovery using our Deep Proteome Profiling service, where candidate biomarkers are identified across discovery cohorts. Candidates are prioritised based on fold-change, statistical significance, biological relevance, and peptide suitability for targeted assay development. Selected candidates then move into PRM/MRM method development, analytical validation, and cohort-scale quantification. Where absolute concentration data are required, our Precision Protein Quantification platform provides stable isotope-based absolute quantification workflows.

Conceptual funnel diagram illustrating the biomarker validation bottleneck and how PRM/MRM addresses it

The biomarker validation challenge: targeted MS bridges the gap between discovery-phase candidate identification and clinically validated biomarker panels.

Key Application Areas

Our biomarker validation platform supports a broad range of therapeutic areas and sample types, each with specific methodological considerations for PRM/MRM assay design and cohort analysis.

Oncology Biomarker Panels

Serum and plasma protein panels for early detection, diagnosis, prognosis, and treatment response monitoring across cancer types including hepatocellular carcinoma, ovarian cancer, prostate cancer, lung cancer, colorectal cancer, and pancreatic cancer. Multiplexed PRM assays quantify 15–50 candidates in a single run from 10–100 µL plasma, with LODs in the low ng/mL range and sub-ng/mL with immunoaffinity enrichment.

Cardiovascular & Metabolic Disease

Lipoprotein-associated proteins, inflammatory markers (CRP, IL-6, TNF-α), cardiac troponins, and metabolic syndrome biomarkers. MRM-based multiplexed panels support cohort studies spanning 500–5,000+ samples, with scheduled transition monitoring enabling consistent throughput across large batches.

Neurology & CNS Biomarkers

CSF and plasma protein quantification for neurodegeneration markers including tau (total and phosphorylated), amyloid-β isoforms, neurofilament light (NfL), glial fibrillary acidic protein (GFAP), and novel candidates from discovery proteomics. Low pg/mL–ng/mL quantification achieved with immunoaffinity enrichment workflows.

Inflammation & Immunology

Cytokine, chemokine, complement factor, and acute-phase protein panels for autoimmune disease, infectious disease, and vaccine response research. Multiplexed MRM assays enable simultaneous quantification of 20–40 inflammatory mediators from minimal sample volumes.

Kidney & Liver Disease

Fibrosis markers, glomerular filtration rate protein panels, and liver-specific protein quantification supporting non-alcoholic steatohepatitis (NASH), chronic kidney disease, and liver fibrosis research. Assays developed for both plasma and urine matrices with matrix-specific calibration.

Drug-Induced Toxicity Biomarkers

Preclinical safety biomarker panels including kidney injury markers (KIM-1, clusterin, osteopontin), liver injury markers (mGST1, osteoactivin), and muscle toxicity markers. Designed for pharmaceutical development studies supporting preclinical candidate selection.

Targeted Acquisition: PRM and MRM Platforms

Our biomarker validation platform offers two complementary LC-MS/MS acquisition strategies, selected based on project-specific requirements for specificity, sensitivity, throughput, and cohort size.

Parallel Reaction Monitoring (PRM) on high-resolution Orbitrap (Q Exactive HF-X, Orbitrap Fusion Lumos) and QqTOF (ZenoTOF 7600) instruments captures full MS/MS fragment ion spectra for each target peptide, providing maximum specificity through parallel detection of all fragment ions. This full-spectrum acquisition eliminates the need for transition pre-selection and enables retrospective data mining — making PRM the preferred approach for method development, biomarker verification studies, and projects where assay specificity must be documented at the fragment ion level.

Multiple Reaction Monitoring (MRM/SRM) on triple quadrupole platforms (AB Sciex 6500+) uses scheduled precursor-to-product ion transitions to deliver the highest achievable sensitivity and the broadest dynamic range for known peptide targets. MRM is the method of choice for large cohort studies (500–5,000+ samples) where consistent throughput, scheduled acquisition, and maximum quantitative precision are required.

Both platforms are operated under a unified QC framework: stable isotope-labeled internal standards spiked at known concentrations, pooled QC samples injected at regular intervals, randomised batch designs, and pre-defined acceptance criteria for retention time stability, internal standard response, and QC precision.

Side-by-side comparison of PRM on high-resolution Orbitrap and MRM on triple quadrupole for biomarker validation

PRM (full-spectrum high-resolution) vs MRM (scheduled transition) for biomarker validation — platform selection guided by project requirements.

Technologies & Workflow

Parallel Reaction Monitoring (PRM) on High-Resolution MS

Full MS/MS fragment ion acquisition on Orbitrap and QqTOF platforms (Q Exactive HF-X, Orbitrap Fusion Lumos, ZenoTOF 7600) provides high-specificity targeted quantification. Full-scanned fragment spectra enable confident peptide identification, retrospective data re-interrogation, and detailed assay specificity documentation — ideal for method development and biomarker verification studies where analytical confidence is paramount.

Multiple Reaction Monitoring (MRM) on Triple Quadrupole

Scheduled MRM acquisition on triple quadrupole platforms (AB Sciex 6500+) delivers the highest sensitivity for validated biomarker panels. Scheduled transition monitoring maximises dwell time per transition while maintaining consistent cycle time across the gradient, enabling quantification of 50–100 peptides per injection with optimal precision for large cohort studies.

Stable Isotope Internal Standard & QC Framework

Stable isotope-labeled AQUA or SIS peptides are synthesised for each target and spiked at known concentrations before digestion or injection, correcting for sample preparation variation, matrix effects, ionisation suppression, and instrument drift. Standard QC includes pooled QC sample monitoring (%CV, inter-batch normalisation), blank injections (carryover assessment), internal standard response tracking, and system suitability tests.

Workflow Overview

Step 1 — Candidate Review & Assay Design: Our proteomics team reviews your candidate biomarker list, discovery data (DIA/TMT spectral libraries, fold-change, statistical significance), sample matrix, and cohort requirements. Proteotypic peptides are selected, uniqueness verified by BLAST against the human proteome, and assay feasibility assessed for each candidate.

Step 2 — Method Development & Analytical Validation: PRM or MRM methods are developed with optimised retention time scheduling, isolation window or transition assignment, collision energy tuning, and internal standard concentrations. Analytical validation includes linearity assessment (5–8 point calibration curves), LOD/LOQ determination, intra-/inter-assay precision (CV%), and matrix effect evaluation.

Step 3 — Batch Design & QC Framework: Samples are organised into randomised batches with embedded QC samples (pooled QC, blank, internal standard monitoring). Batches are designed to balance biological variables across runs and minimise batch effects. Pre-defined acceptance criteria are established for all QC metrics.

Step 4 — Cohort Acquisition: Samples are acquired according to the batch plan on the selected LC-MS/MS platform. PRM data are collected at 35,000–120,000 resolution (Orbitrap) or with Zeno trap activation (QqTOF); MRM data are collected with scheduled transition monitoring. Real-time QC monitoring allows early detection of acquisition issues.

Step 5 — Data Processing & Reporting: Targeted extraction, peak integration, internal standard normalisation, and quantification using Skyline or equivalent software. Deliverables include processed quantification tables with sample-level values, all QC metrics (CV%, internal standard recovery, retention time stability), assay performance report, chromatogram archives, and a publication-ready methods description.

Sample Requirements & Submission Guidelines

Sample Type Recommended Input Notes
Plasma (EDTA, citrate, heparin) 50–200 µL Centrifuged, aliquoted, stored at −80°C; avoid haemolysed samples
Serum 50–200 µL Standard serum collection; store at −80°C; minimise freeze-thaw cycles
CSF 100–500 µL Low protein concentration; protease inhibitor cocktail recommended
Tissue (fresh frozen) 10–50 mg Homogenisation and protein extraction optimised per tissue type
Tissue (FFPE) 3–10 sections × 10 µm Deparaffinisation and protein extraction included in workflow
Cell lysate 200–1,000 µg protein Adherent, suspension, or primary cells; protease inhibitors recommended
Urine 1–10 mL Centrifuged, filtered, concentrated; normalised to creatinine if needed

Please contact us for feasibility assessment and input optimisation for non-standard or limited sample types. All sample types require documented collection and storage conditions for inclusion in the final report. For low-abundance targets requiring immunoaffinity enrichment prior to LC-MS/MS analysis, our Immunoaffinity-LC-MS/MS Quantification service provides complementary workflows with sub-ng/mL sensitivity.

Representative Data & Workflow Examples

Below are representative examples from our biomarker validation workflows, demonstrating multiplexed assay performance, cohort quantification capability, and the integrated pipeline from discovery data to validated biomarker panel.

Multiplexed PRM calibration curves for 15 biomarker candidates in plasma matrix showing linear response across 3-4 orders of magnitude

Representative multiplexed PRM calibration curves for 15 biomarker candidates in plasma matrix demonstrating linear dynamic range across 3–4 orders of magnitude with R² > 0.99 for all targets (intra-assay CV 3–12%).

Cohort comparison box plots showing relative abundance of 8 validated biomarkers across control, disease, and treatment groups with ROC curve analysis

Cohort comparison data from a 350-sample biomarker validation study showing relative abundance distributions and ROC curve analysis for multi-marker panel performance assessment.

End-to-end biomarker validation pipeline from DIA discovery through PRM method development to cohort quantification and reporting

Integrated biomarker validation pipeline: from DIA/TMT discovery and candidate prioritisation through PRM/MRM assay development, cohort acquisition, and quantitative data reporting with full QC documentation.

CASE STUDY

Proteomics-Driven Noninvasive Screening of Circulating Serum Protein Panels for Early Diagnosis of Hepatocellular Carcinoma

Xing et al. 2023 | Nat Commun | CC BY 4.0

Background & Purpose

Hepatocellular carcinoma (HCC) accounts for the majority of primary liver cancers, and early detection significantly improves patient outcomes. However, the performance of the current standard biomarker — serum alpha-fetoprotein (AFP) — is limited, particularly in distinguishing HCC from liver cirrhosis in high-risk populations. Xing et al. aimed to develop and validate a multi-protein serum biomarker panel using a staged MS-based proteomics approach across 1,002 individuals, combining DIA discovery with PRM validation in independent cohorts.

Methods

The study employed a three-stage design. In the discovery phase, DIA proteomics was performed on a training cohort (n=435) to identify candidate biomarkers. Candidate proteins were prioritised through machine learning feature selection. In the verification phase, a targeted PRM assay was developed for the selected candidates and applied to an independent verification cohort (n=238). The final P4 panel — comprising HABP2 (hyaluronan-binding protein 2), CD163 (scavenger receptor), AFP, and PIVKA-II (des-γ-carboxy prothrombin) — was selected based on combined performance across all stages. PRM assays were developed with stable isotope-labeled peptide internal standards for absolute quantification across all 1,002 plasma samples.

Results Overview

The P4 panel demonstrated outstanding diagnostic performance, achieving an AUC of 0.979 for distinguishing HCC from liver cirrhosis and 0.992 for distinguishing HCC from healthy controls — significantly outperforming AFP alone (AUC 0.764 and 0.819, respectively). In a prospective external validation cohort (n=329), the panel predicted conversion from liver cirrhosis to HCC a median of 11.4 months prior to imaging-based diagnosis, with an AUC of 0.890 for early prediction. Longitudinal monitoring demonstrated that P4 panel scores increased progressively during the transition from liver cirrhosis to HCC, enabling detection at a potentially more treatable disease stage.

Three-stage study design schematic showing DIA discovery, PRM verification, and independent validation cohorts for HCC biomarker development

Study design: three-stage discovery-verification-validation proteomics workflow across 1,002 individuals for HCC biomarker panel development. (CC BY 4.0)

ROC curves for P4 panel (HABP2, CD163, AFP, PIVKA-II) demonstrating AUC 0.979 for HCC vs liver cirrhosis and 0.992 for HCC vs healthy controls

ROC curve analysis for the P4 panel demonstrating significant improvement over AFP alone for distinguishing HCC from liver cirrhosis and healthy controls. (CC BY 4.0)

Longitudinal monitoring data showing P4 panel scores predicting HCC conversion a median of 11.4 months before imaging diagnosis

Prospective external validation: P4 panel scores predicted liver cirrhosis to HCC conversion a median of 11.4 months prior to imaging-based diagnosis (AUC 0.890). (CC BY 4.0)

Conclusion

This study demonstrates the clinical translation potential of a proteomics-driven, PRM-validated multi-protein biomarker panel for HCC early detection. The P4 panel's ability to predict HCC onset months before conventional imaging diagnosis highlights the value of integrating DIA discovery with PRM-based targeted validation in large, well-designed cohorts. The validated PRM assay provides a template for biomarker validation studies across other cancer types and disease areas, demonstrating the throughput, multiplexing capacity, and analytical reproducibility required for cohort-scale biomarker verification.

Frequently Asked Questions

Q1: How many biomarkers can be multiplexed in a single PRM/MRM assay?

A single PRM or MRM method typically accommodates 30–100 peptide targets (corresponding to 20–70 proteins, depending on number of peptides per protein), with scheduled acquisition in a 30–60 minute LC gradient. For larger panels (>100 peptides), we recommend splitting across 2–3 methods or switching to MRM with scheduled transition monitoring for maximum multiplexing capacity. The optimal multiplexing level is determined during the assay design phase based on abundance range, chromatographic behaviour, and required quantitative performance.

Q2: What is the typical LOD and LOQ for plasma protein quantification by PRM/MRM?

Without enrichment, typical LODs range from 1–50 ng/mL in plasma for medium-to-high abundance proteins, depending on peptide ionisation efficiency and matrix complexity. For low-abundance targets (sub-ng/mL), immunoaffinity enrichment (SISCAPA, immunocapture) can be combined with PRM detection to achieve LODs in the 10–100 pg/mL range. LOD and LOQ are determined empirically during method development for each target peptide using matrix-matched calibration curves.

Q3: How do I transition from DIA/TMT discovery data to PRM/MRM validation?

We accept DIA or TMT discovery data (spectral libraries, quantification tables, raw files) as direct input for PRM assay design. Our team extracts candidate peptide sequences, retention times, and fragmentation spectra from your discovery data to design targeted methods. We verify proteotypic peptide uniqueness, assess suitability for PRM/MRM (ionisation properties, modification status, missed cleavage propensity), and recommend optimal acquisition strategy. For a typical 50–100 candidate panel, assay development and analytical validation can be completed in 4–6 weeks.

Q4: What cohort sizes can you support?

We have experience with cohort sizes ranging from 20 to 5,000+ samples. For smaller cohorts (20–200 samples), single-batch acquisition is typical. For larger cohorts (200–5,000+ samples), we implement multi-batch designs with overlapping QC samples for inter-batch normalisation. Our QC framework scales with cohort size — pooled QC injections every 5–10 samples, systematic internal standard monitoring, and batch correction where necessary.

Q5: What QC metrics do you provide in the final report?

Our standard reporting package includes: (1) intra-assay CV and inter-assay CV for each target, (2) LOD and LOQ values determined empirically, (3) linearity assessment with calibration curve (R², linear range), (4) internal standard recovery across all samples, (5) retention time stability across batches, (6) pooled QC precision (CV%) and dilution linearity, (7) blank assessment for carryover, and (8) a summary of all samples passing QC with any flagged outliers.

References

  1. Xing X, Cai L, Ouyang J, Wang F, Li Z, Liu M, Wang Y, Zhou Y, Hu E, Huang C, Wu L, Liu J, Liu X. Proteomics-driven noninvasive screening of circulating serum protein panels for the early diagnosis of hepatocellular carcinoma. Nat Commun. 2023;14:8392.
  2. Kim H, Kim Y, Park J, Hwangbo S, Kim K, Lee C, Song MJ, An HJ. Quantification of putative ovarian cancer serum protein biomarkers using a multiplexed targeted mass spectrometry assay. Clin Proteomics. 2024;20:47.
  3. Gabriele C, Aracri F, Prestagiacomo LE, Rota MA, Alba S, Tradigo G, Guzzi PH, Cuda G, Damiano R, Veltri P, Gaspari M. Development of a predictive model to distinguish prostate cancer from benign prostatic hyperplasia by integrating serum glycoproteomics and clinical variables. Clin Proteomics. 2023;20:52.

GET STARTED

Ready to Validate Your Biomarker Candidates?

Contact our proteomics team to discuss your biomarker validation project. We will design a custom PRM/MRM assay strategy matched to your candidate list, sample matrix, cohort size, and quantitative requirements — delivering publication-ready data with full analytical documentation.

Request a Custom Quote for Your Biomarker Validation Project

Request a Customized Quote