Get Your Custom Quote

Online Inquiry

Plasma & Serum Biomarker Proteomics Service

End-to-end plasma and serum protein biomarker discovery and validation by LC-MS/MS. From deep DIA quantitative profiling identifying hundreds of candidate biomarkers through PRM-targeted verification and machine learning panel optimization to independent cohort validation — a complete biomarker pipeline under one roof. RUO.

Research Use Only (RUO) Notice: All services and data provided are strictly for non-clinical research purposes. Our analytical results are not intended for clinical diagnosis, patient management, or therapeutic decision-making.

Services Technologies Demo Case Study FAQ Related Services

CORE SERVICE

End-to-End Plasma & Serum Biomarker Discovery: From DIA Profiling to PRM-Validated Panels

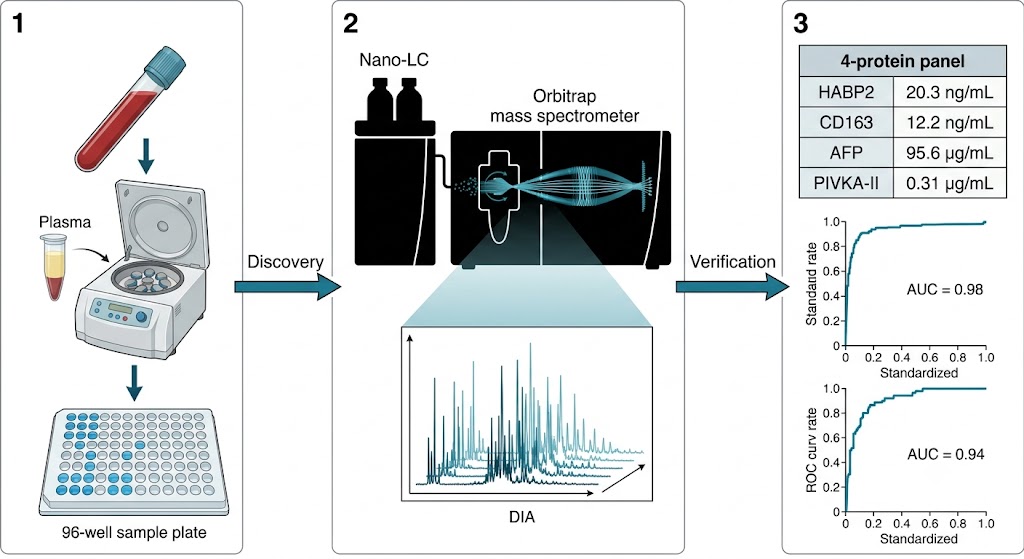
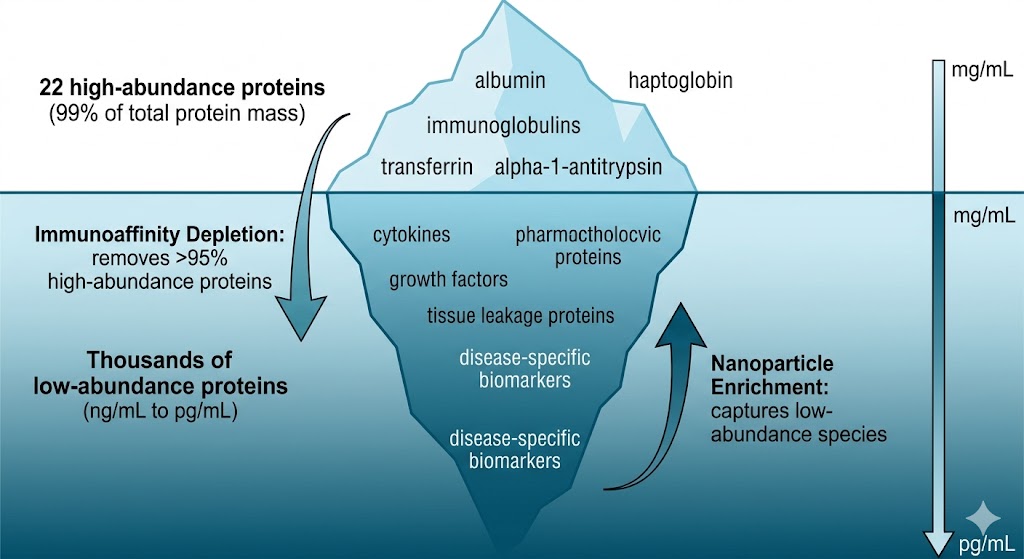
The path from a banked plasma cohort to a validated protein biomarker panel is fragmented across most CROs — discovery goes to one lab, targeted verification to another, and statistical panel optimization falls through the cracks entirely. Plasma and serum are the most accessible and clinically relevant sample types for protein biomarker research, yet they are also the most analytically demanding: 22 high-abundance proteins account for 99% of total protein mass, burying thousands of low-abundance biomarker candidates beneath a dynamic range spanning ten orders of magnitude. Our Plasma & Serum Biomarker Proteomics service closes this fragmentation by delivering the entire pipeline — DIA discovery, PRM/MRM verification, and machine learning-driven panel selection — as a single integrated workflow. Whether your study targets oncology biomarkers in pre-treatment serum, neurodegenerative protein signatures in plasma, or inflammatory markers across a longitudinal cohort, our Biomarker Validation by PRM/MRM platform ensures that candidates identified in discovery move seamlessly into statistically powered verification without the data loss and methodological drift that plague multi-vendor biomarker programs.

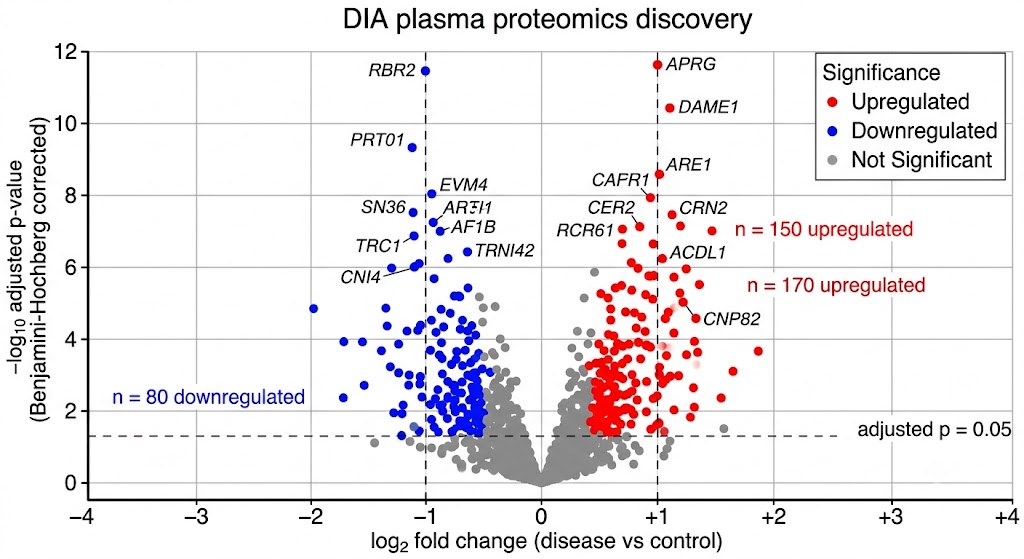
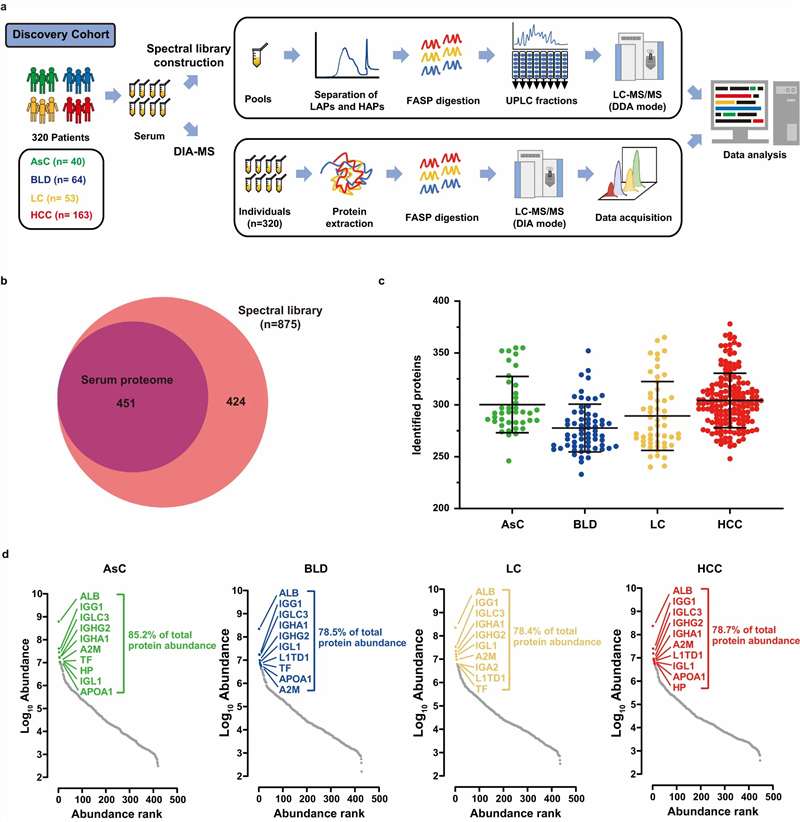
  • Deep DIA Discovery Profiling: Data-independent acquisition on high-resolution Orbitrap and timsTOF platforms identifies and quantifies 800–1,500+ proteins per plasma sample after depletion, with systematic precursor fragmentation that creates a complete digital record free from the stochastic sampling bias of data-dependent acquisition. Every peptide in every sample is recorded — enabling retrospective re-analysis when new biomarker hypotheses emerge.
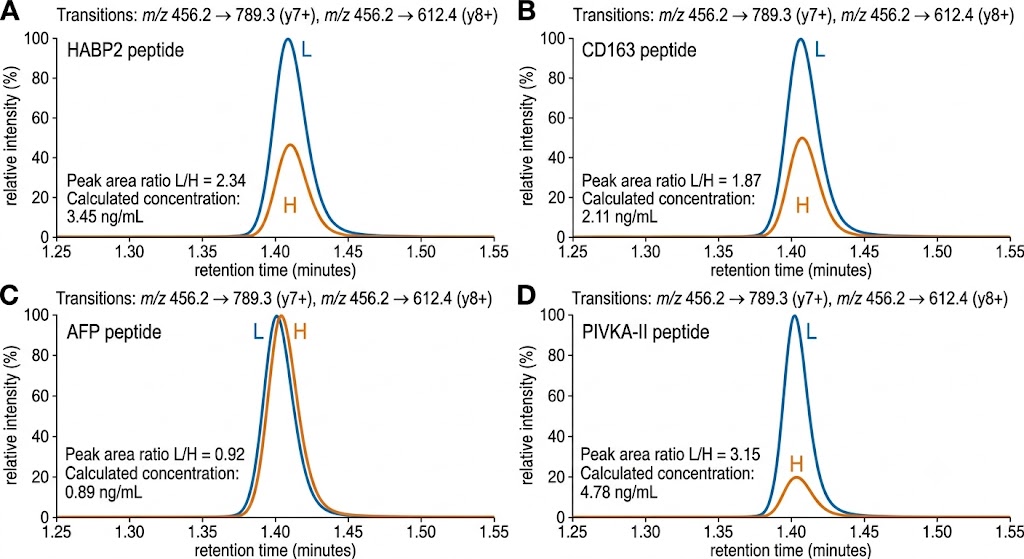
  • PRM/MRM Targeted Verification: Custom assay development for 10–50 prioritized biomarker candidates, selecting 2–3 proteotypic peptides per protein with heavy isotope-labeled internal standards. Scheduled retention time windows and optimized collision energies deliver CVs below 15% across analytical replicates, with LODs reaching low ng/mL in depleted plasma — the quantitative rigor needed to separate true biomarker signal from cohort noise.
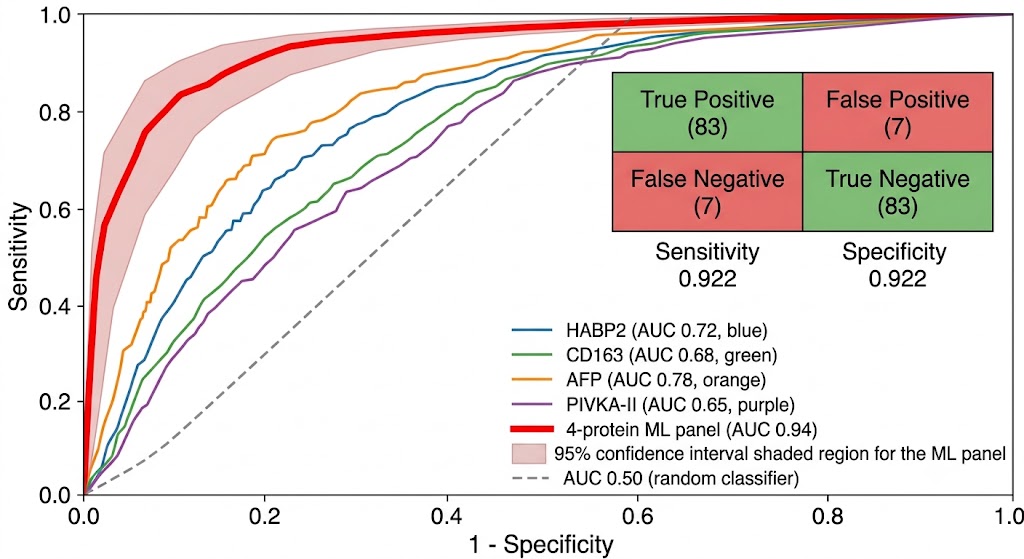
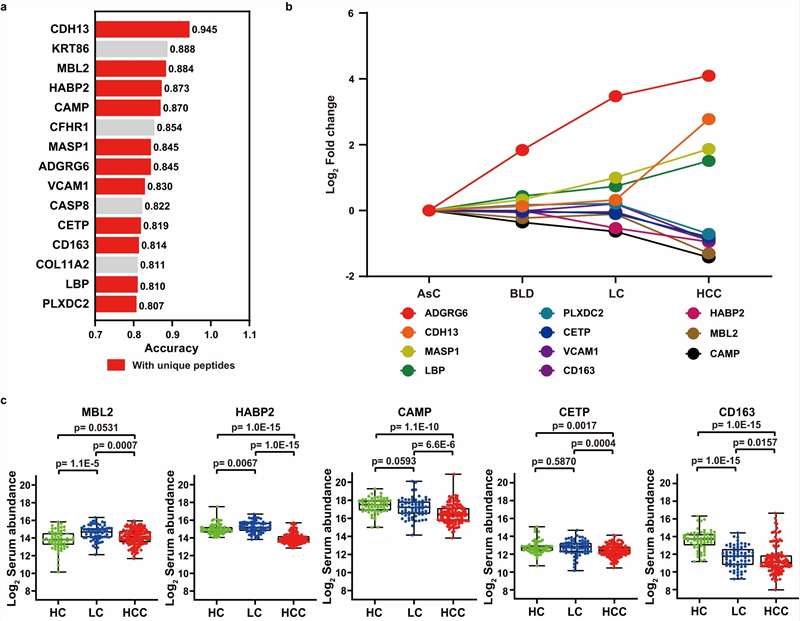
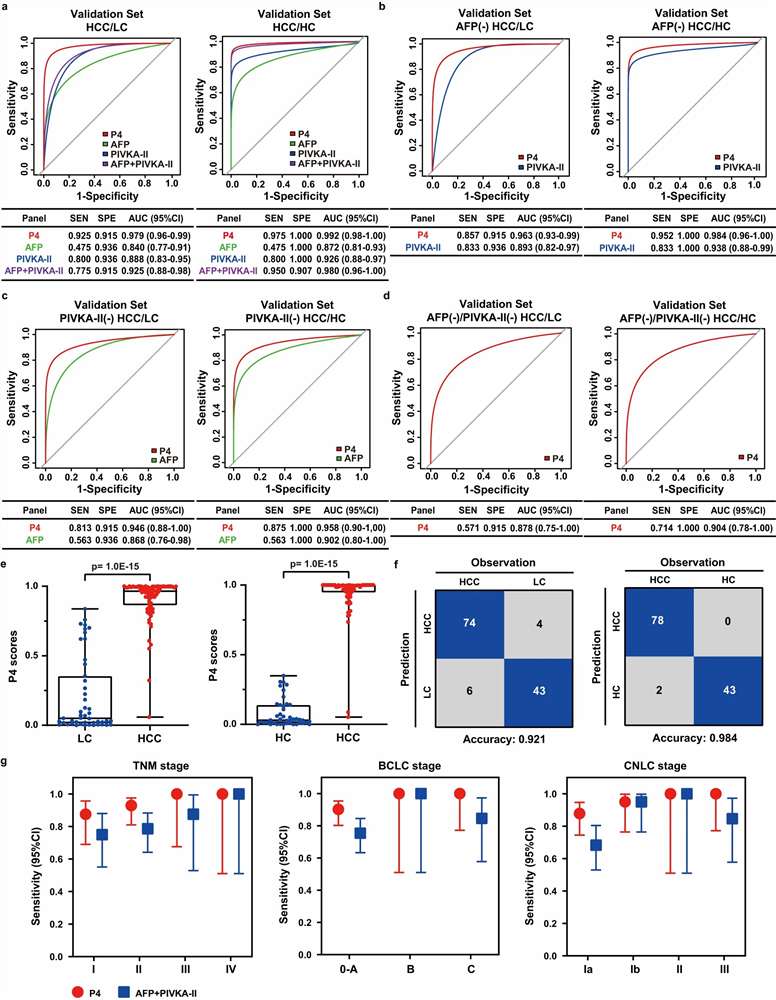
  • Machine Learning Panel Optimization: Beyond simple fold-change ranking, we apply LASSO regression, random forest feature selection, and logistic regression modeling to identify the minimal protein panel that maximizes classification performance. Cross-validation and bootstrapping prevent overfitting, and the final panel is evaluated on held-out validation cohorts with ROC analysis, sensitivity/specificity metrics, and calibration curves.
End-to-end plasma biomarker pipeline illustration: plasma tube to depletion, DIA mass spectrometry, PRM targeted verification, and machine learning panel selection for cohort validation

Overview of the plasma and serum biomarker proteomics pipeline: from cohort sample collection and high-abundance protein depletion through DIA discovery profiling, PRM-targeted verification, and machine learning panel optimization to independent cohort validation.

Conquering the Plasma Proteome: Depletion, Depth, and Dynamic Range

The plasma proteome's extreme dynamic range is not a theoretical concern — it is the single greatest barrier between a biomarker researcher and actionable data. Albumin alone constitutes approximately 55% of total plasma protein; when combined with immunoglobulins, transferrin, haptoglobin, and α-1-antitrypsin, the top 22 proteins consume 99% of the mass spectrometer's dynamic range. Without intervention, low-abundance proteins at ng/mL concentrations — precisely where most disease-specific biomarkers reside — are simply invisible. Our Blood Proteomics platform addresses this through a rigorous depletion and enrichment strategy validated across thousands of plasma and serum samples. We deploy immunoaffinity depletion columns targeting the top 14 or top 20 high-abundance proteins, removing >95% of total protein mass while preserving >90% of low-abundance species. For studies requiring deeper penetration into the sub-ng/mL range, we offer combinatorial peptide ligand library (CPLL) enrichment and nanoparticle protein corona-based enrichment, which can extend identifications beyond 2,000 proteins per sample.

The choice between plasma and serum matters at the pre-analytical stage. Plasma (collected with anticoagulant) preserves clotting factors and platelet-derived proteins but introduces anticoagulant-related variability; serum avoids anticoagulant interference but activates the coagulation cascade, releasing platelet proteins and generating proteolytic fragments. We work with both matrices and provide collection tube recommendations and pre-analytical variable documentation during study design. For longitudinal or multi-site cohort studies where sample collection protocols may vary, we include pooled QC samples at regular intervals to distinguish biological variation from pre-analytical artifact. Every reported protein includes its coefficient of variation across QC replicates, and proteins with CVs exceeding 30% are flagged and excluded from downstream biomarker panel selection unless they show exceptional biological signal.

Plasma proteome dynamic range iceberg diagram: 22 high-abundance proteins accounting for 99% protein mass above waterline, thousands of low-abundance biomarkers below, with depletion and enrichment arrows

Technology & Workflow: DIA Discovery, PRM Verification, and ML-Driven Panel Selection

DIA Discovery Profiling

Data-independent acquisition systematically fragments all peptide precursors within defined isolation windows — typically 25–50 Da — generating a complete digital record of every detectable peptide in the sample. Our DIA Quantitative Proteomics platform deploys SWATH-MS on Sciex TripleTOF systems and dia-PASEF on Bruker timsTOF instruments, the latter using trapped ion mobility to add a gas-phase separation dimension that increases peptide identification rates by 30–50% compared to conventional DIA. After depletion, a typical plasma or serum sample yields 800–1,500 quantified protein groups with label-free quantification. Data are processed using Spectronaut or DIA-NN with a spectral library built from fractionated plasma samples.

PRM/MRM Targeted Verification

Discovery generates candidates; verification separates signal from noise. Our PRM Targeted Proteomics platform develops custom assays for each prioritized biomarker candidate. For each target protein, 2–3 proteotypic peptides are selected based on uniqueness, detectability, and absence of known modifications. Heavy isotope-labeled (13C/15N) AQUA peptide internal standards are synthesized, scheduled retention time windows are empirically determined from pooled sample runs, and calibration curves enable quantification with defined LOD and LOQ for each target peptide.

Machine Learning Panel Selection

Statistical filtering narrows candidates from hundreds to tens. Machine learning refines the panel further. We apply LASSO regression for feature selection, random forest analysis for protein importance ranking, and logistic regression modeling with 10-fold cross-validation and bootstrapped confidence intervals for AUC. The final model is evaluated on an independent held-out validation cohort with ROC curves, sensitivity/specificity at optimal decision thresholds, and calibration plots.

Plasma & Serum Biomarker Proteomics Workflow

Step 1 — Study Design & Cohort Planning: Define biological question, select plasma or serum matrix, determine cohort size and composition (discovery/verification/validation), design sample collection protocol, and specify statistical analysis plan.

Step 2 — Sample Preparation & Depletion: Receive frozen plasma/serum aliquots, perform immunoaffinity depletion of high-abundance proteins, optional CPLL or nanoparticle enrichment for deep coverage, protein quantification, reduction/alkylation, trypsin digestion, and C18 desalting.

Step 3 — DIA Discovery Acquisition: LC-MS/MS acquisition on Orbitrap Exploris 480 or timsTOF HT, DIA with 25–50 Da isolation windows, pooled QC injections every 8–10 samples, system suitability injections at batch start and end.

Step 4 — DIA Data Processing & Candidate Selection: Spectronaut or DIA-NN database search against UniProt human proteome, label-free quantification, statistical testing (LIMMA, empirical Bayes), volcano plot generation, candidate ranking by fold change, adjusted p-value, and CV.

Step 5 — PRM Assay Development & Verification: Custom PRM assay design (2–3 peptides per candidate, heavy AQUA standards), scheduled acquisition method development, PRM data acquisition on verification cohort, Skyline-based peak integration, calibration curve quantification, and statistical confirmation.

Step 6 — ML Panel Optimization & Validation Reporting: Feature selection (LASSO, random forest), logistic regression modeling, cross-validation, independent cohort validation, final panel performance metrics, comprehensive biomarker study report with all raw and processed data.

Sample Requirements for Plasma & Serum Biomarker Studies

Sample Type Volume / Input Key Notes
Plasma (EDTA, heparin, or citrate) 50–200 µL per sample EDTA plasma preferred for proteomics (minimal protein degradation); avoid heparin if possible; collect using standardized protocol across all subjects
Serum 50–200 µL per sample Allow clotting 30–60 min at room temperature before centrifugation; avoid hemolysis (hemoglobin masks low-abundance signals); record collection-to-processing time
Depleted plasma/serum ≥20 µL post-depletion For discovery cohorts, we perform depletion in-house; for verification cohorts, provide minimum volume for PRM analysis with heavy standards
Pooled QC sample ≥50 µL additional (pooled from all study samples) Strongly recommended for cohorts >20 samples; enables batch effect monitoring and CV calculation

For multi-site or longitudinal studies, we recommend providing collection SOP documentation alongside samples. Pre-analytical variables — time from collection to centrifugation, storage temperature, freeze-thaw cycles, and collection tube type — are documented in the final report. Our Body Fluid Proteomics platform provides complementary analysis for CSF, urine, saliva, and other biofluid matrices.

Plasma Biomarker Proteomics in Practice

Our plasma and serum biomarker pipeline produces publication-grade data across every phase of the workflow — from discovery volcano plots through PRM quantitative traces to final ML panel performance metrics. The representative examples below illustrate the data quality and analytical depth that support each stage of a biomarker program.

Volcano plot from DIA plasma proteomics discovery: log2 fold change vs -log10 p-value with significantly up/down-regulated proteins highlighted

Volcano plot from DIA plasma proteomics discovery: each point represents a quantified protein group comparing disease versus control. Red (upregulated) and blue (downregulated) points meet dual significance thresholds (|log2FC| > 1, adjusted p < 0.05). Key biomarker candidates labeled with gene names.

PRM extracted ion chromatograms: overlaid traces of endogenous and heavy peptide standards for 4 biomarker candidates with peak area ratios annotated

PRM extracted ion chromatograms for 4 verified biomarker candidates: overlaid traces of endogenous (light) peptides and heavy isotope-labeled AQUA standards (dark), with peak area ratios (L/H) and calculated concentrations annotated. Co-eluting peak profiles and matching fragment ion ratios (dot-product > 0.9) confirm identity.

ROC curve comparison: individual biomarkers vs multi-protein ML panel, with AUC values and confusion matrix inset

ROC curves comparing individual biomarker performance against the 4-protein ML panel: the LASSO-selected panel achieves AUC 0.94 (95% CI: 0.90–0.98), outperforming the best single biomarker (AUC 0.78). Confusion matrix inset shows classification at the optimal Youden index threshold.

CASE STUDY

Serum Biomarker Discovery to PRM Validation: A HCC Early Diagnosis Case Study

Xing X, Cai L, Ouyang J, et al. Nature Communications. 2023;14:8392. DOI: 10.1038/s41467-023-44255-2

Background & Purpose

Early diagnosis of hepatocellular carcinoma (HCC) — the most common form of primary liver cancer — remains a major clinical challenge, with existing single-biomarker tests (AFP alone) showing inadequate sensitivity and specificity. Xing and colleagues addressed this gap by deploying a staged mass spectrometry-based proteomics workflow — discovery, verification, and validation — across 1,002 individuals to identify and validate a multi-protein serum biomarker panel for HCC early diagnosis. The study exemplifies the discovery-to-validation paradigm that our Plasma & Serum Biomarker Proteomics service operationalizes: unbiased DIA discovery identifies candidates, PRM-targeted proteomics verifies the top performers in an independent cohort, and machine learning constructs the minimal, maximally informative biomarker panel.

Methods

The study enrolled 1,002 individuals across four cohorts: a discovery cohort (30 HCC, 30 liver cirrhosis [LC], 30 healthy controls [HC]), a verification cohort (60 HCC, 60 LC, 60 HC), an independent validation cohort (90 HCC, 92 LC, 96 HC), and a prospective external validation cohort (244 participants). Serum samples were depleted of high-abundance proteins, digested with trypsin, and analyzed by DIA mass spectrometry on a timsTOF Pro instrument. DIA data were processed using Spectronaut, and differentially abundant proteins were identified by LIMMA analysis with Benjamini-Hochberg correction. Candidate biomarkers were prioritized by fold change, p-value, and biological relevance, then verified using PRM with heavy isotope-labeled peptide standards. The optimal multi-biomarker panel was selected using LASSO regression and logistic regression modeling, and the final P4 panel was evaluated in both the independent validation cohort and the prospective cohort.

Results Overview

DIA-based serum proteomic analysis identified and quantified 1,876 protein groups across the discovery cohort. Differential abundance analysis between HCC and non-HCC groups identified 243 significantly altered proteins. From these, 22 candidates were selected for PRM-targeted verification; 17 of 22 were confirmed as significantly differentially abundant in the independent verification cohort. Machine learning feature selection using LASSO regression on the 17 verified candidates identified a 4-protein panel — HABP2, CD163, AFP, and PIVKA-II — as the optimal minimal combination. In the independent validation cohort (n=278), the P4 panel achieved an AUC of 0.979 for distinguishing HCC from liver cirrhosis (sensitivity 0.925, specificity 0.915) and an AUC of 0.992 for distinguishing HCC from healthy controls (sensitivity 0.975, specificity 1.000). Critically, in the prospective external validation cohort, the P4 panel predicted HCC conversion in cirrhotic patients at a median of 11.4 months before imaging-based diagnosis (AUC 0.890, sensitivity 0.909, specificity 0.877).

Case study: DIA-based serum proteomic analysis of discovery cohort — protein identification and quantification results (Fig. 2 from Xing et al. 2023)

Fig. 2 from Xing et al. 2023: MS-based serum proteomic analysis of the discovery cohort — DIA profiling results showing protein identification, quantification, and differential abundance between HCC, liver cirrhosis, and healthy control groups.

Case study: PRM-targeted proteomics screening and validation of serum candidate biomarkers (Fig. 5 from Xing et al. 2023)

Fig. 5 from Xing et al. 2023: PRM-targeted proteomics screening and validation of 22 serum candidate biomarkers across the verification cohort, showing confirmed differential abundance for 17 of 22 candidates with heavy peptide internal standard quantification.

Case study: P4 model diagnostic performance in independent validation cohort — ROC curves and performance metrics (Fig. 6 from Xing et al. 2023)

Fig. 6 from Xing et al. 2023: P4 model (HABP2, CD163, AFP, PIVKA-II) diagnostic performance in the independent validation cohort, with ROC curves showing AUC 0.979 for HCC vs LC and AUC 0.992 for HCC vs HC.

Conclusion

Xing et al. demonstrated that a staged proteomics workflow — DIA discovery to PRM verification to ML panel optimization to independent cohort validation — can produce a clinically useful multi-protein serum biomarker panel with performance metrics substantially exceeding AFP alone. The P4 panel's ability to predict HCC conversion nearly one year before imaging detection highlights the power of combining quantitative proteomics depth with ML-driven panel selection and rigorous independent validation. Creative Proteomics has built our Plasma & Serum Biomarker Proteomics service on this same staged discovery-to-validation paradigm, deploying the latest DIA strategies, custom PRM assay development, and statistical modeling to help clients navigate their own biomarker programs — from the first discovery experiment through publication-ready validated panels.

Frequently Asked Questions

Q1: Plasma or serum — which is better for my biomarker study?

The choice depends on your biological question and logistical constraints. Plasma preserves the in vivo protein milieu more faithfully because anticoagulants prevent clotting, meaning clotting factors and platelet-derived proteins remain present. It is generally preferred for discovery proteomics where proteome coverage breadth matters. Serum eliminates anticoagulant interference but activates the coagulation cascade during clot formation, releasing platelet proteins and generating thrombin-cleaved fragments. For studies where platelet-derived factors are part of the biology of interest, plasma is recommended; for studies where clotting-related proteins are not relevant and simpler collection logistics are preferred, serum is acceptable. We work with both matrices and can advise during study design.

Q2: How many proteins can you identify and quantify in a typical plasma or serum sample?

With immunoaffinity depletion of the top 14 high-abundance proteins followed by DIA acquisition on a timsTOF or Orbitrap platform, we routinely identify and quantify 800–1,500 protein groups per sample. Adding moderate peptide-level fractionation (high-pH reversed-phase into 6–12 fractions) can extend this to 1,500–2,500 protein groups. With nanoparticle protein corona-based enrichment, coverage can exceed 2,000 protein groups without fractionation. The actual number depends on the depletion/enrichment strategy, instrument platform, sample volume available, and desired throughput. We discuss coverage expectations during study design based on your specific experimental goals.

Q3: What cohort size do I need for a statistically powered biomarker discovery study?

For discovery proteomics (DIA), a minimum of 20–30 samples per group is recommended to achieve reasonable power for detecting fold changes of 1.5 or greater at FDR 5%. For PRM verification, 30–60 samples per group is typical to confirm candidates with greater statistical confidence. For final validation, 80–150 or more samples per group is recommended to robustly estimate sensitivity, specificity, and AUC with narrow confidence intervals. These are guidelines, not rigid requirements — optimal sample size depends on expected effect size. We provide statistical power analysis as part of study design to help determine appropriate cohort sizes for your specific biological system.

Q4: How does your LC-MS approach compare to affinity-based platforms like Olink or SomaScan?

LC-MS-based proteomics and affinity-based platforms are complementary rather than competitive. Affinity platforms offer high sensitivity for pre-defined protein panels with minimal sample volume (1–4 µL) and high throughput. However, they are limited to proteins for which binding reagents exist and cannot discover novel biomarkers outside their panel. LC-MS-based DIA is unbiased — it detects any peptide within its mass and concentration range, meaning it can discover proteins not represented on any affinity panel. MS also provides peptide-level resolution, distinguishing proteoforms, isoforms, and PTMs that affinity reagents cannot discriminate. Many biomarker programs use both: affinity platforms for broad screening, LC-MS for deep discovery and independent verification. Our service focuses on the MS-based arm of this complementary approach.

Q5: What data deliverables and bioinformatics support do you provide?

Every project includes: (1) raw MS data files; (2) processed quantification matrices (protein groups by samples); (3) statistical analysis results (differential abundance tables with fold changes, p-values, adjusted p-values); (4) PRM assay characterization reports (peptide selection rationale, calibration curves, LOD/LOQ, CV); (5) machine learning model outputs (feature importance rankings, model coefficients, cross-validation metrics, ROC curves); (6) a comprehensive study report describing all methods, QC metrics, and interpretation guidance. All data are provided in formats compatible with R, Python, or Perseus. We also offer optional bioinformatics support for pathway enrichment analysis, protein-protein interaction network construction, and manuscript figure preparation.

References

  1. Xing X, Cai L, Ouyang J, et al. Proteomics-driven noninvasive screening of circulating serum protein panels for the early diagnosis of hepatocellular carcinoma. Nat Commun. 2023;14:8392.
  2. Nakayasu ES, Gritsenko M, Piehowski PD, et al. Tutorial: best practices and considerations for mass-spectrometry-based protein biomarker discovery and validation. Nat Protoc. 2021;16:3737-3760.
  3. Babaei M, Kashanian S, Lee HT, Harding F. Proteomics techniques in protein biomarker discovery. Quant Biol. 2024;12:53-69.

GET STARTED

Advance Your Plasma Biomarker Program with an Integrated Discovery-to-Validation Pipeline

From deep DIA profiling of your discovery cohort through PRM-targeted verification and machine learning panel optimization to independent cohort validation — our plasma and serum biomarker proteomics service delivers every phase under one roof, eliminating the data fragmentation and methodological drift of multi-vendor biomarker programs.

Ready to discuss your biomarker study?

Request a Customized Quote