Get Your Custom Quote

Online Inquiry

Host Cell Protein Quantification Service

LC-MS/MS-based host cell protein (HCP) identification, quantification, and clearance tracking for CHO-derived biologics process development. Our antibody-independent SWATH/DIA and targeted PRM workflows provide comprehensive HCP coverage — from ppm-level individual protein quantification through purification-step clearance profiling — delivering the orthogonal analytical depth that ELISA alone cannot achieve. RUO.

Research Use Only (RUO) Notice: All services and data provided are strictly for non-clinical research purposes. Our analytical results are not intended for clinical diagnosis, patient management, or therapeutic decision-making.

Services Technologies Demo Case Study FAQ Related Services

CORE SERVICE

Comprehensive HCP Quantification: Beyond ELISA for Biologics Process Development

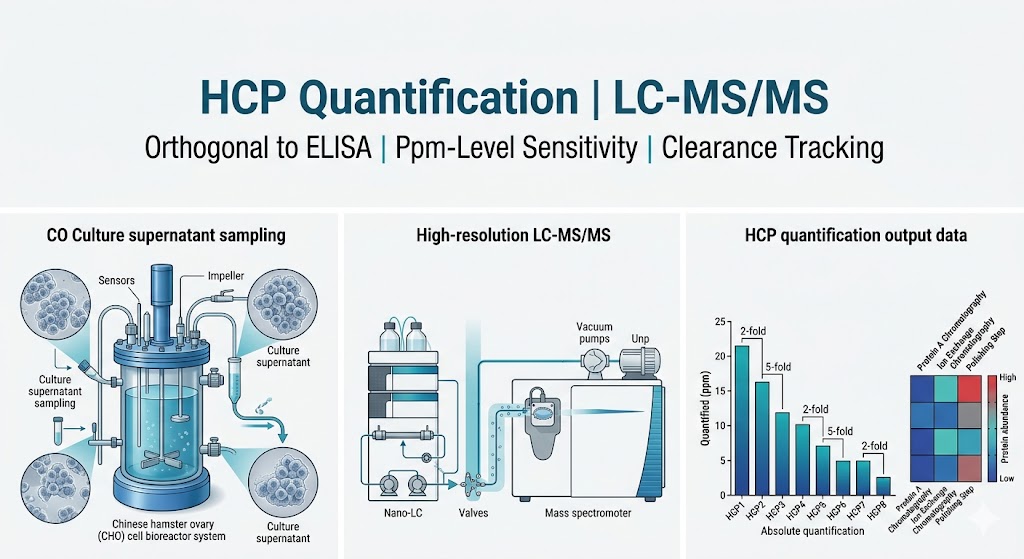
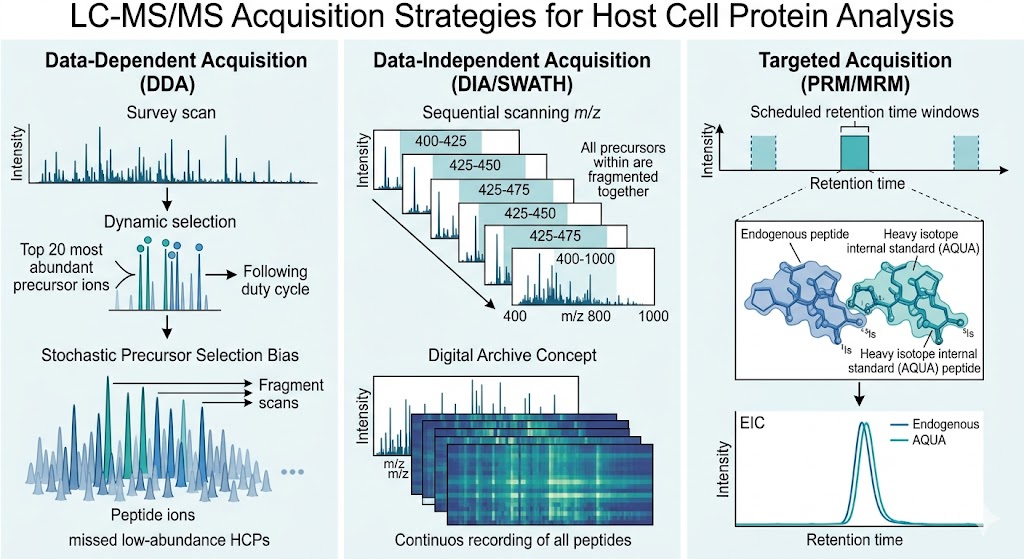
The transition from broad proteome discovery to precisely measured, reproducible impurity quantification requires dedicated mass spectrometry approaches optimized for sensitivity, selectivity, and throughput in complex biologics matrices. Host cell proteins — secreted or released from CHO cells during upstream culture — co-purify with the therapeutic product across downstream processing steps, and even residual levels measured in parts-per-million can compromise drug product stability, efficacy, or immunogenicity. Our Biologics Protein Quantification portfolio brings together the full spectrum of LC-MS/MS-based HCP identification and quantification capabilities — from SWATH/DIA discovery profiling through targeted PRM/MRM absolute quantification — providing end-to-end support from analytical method design through sample cohort analysis and comprehensive data reporting.

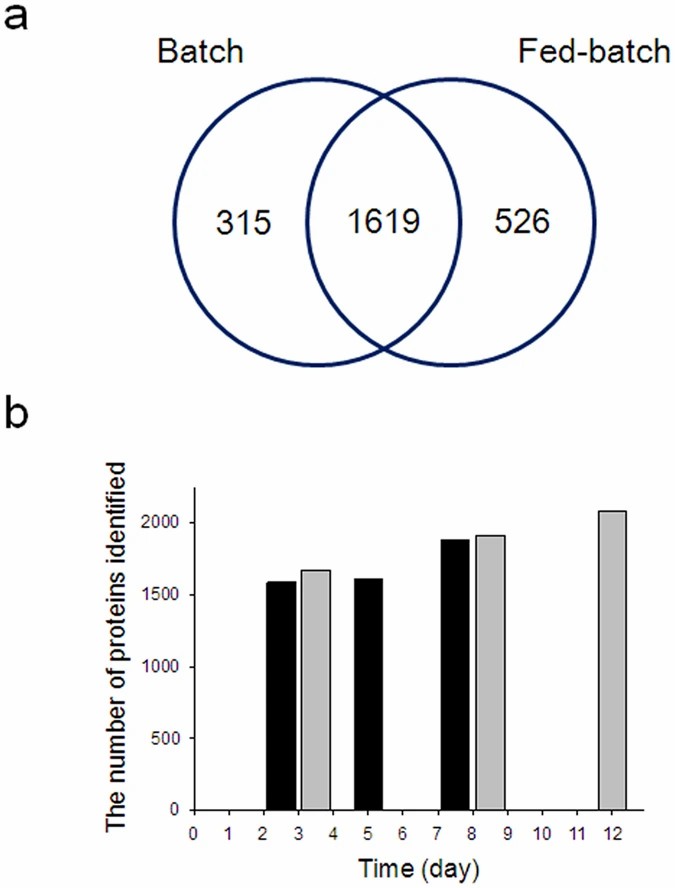
  • SWATH/DIA Discovery Profiling: Data-independent acquisition enabling comprehensive HCP identification and label-free quantification across hundreds to thousands of CHO proteins per sample, with systematic acquisition free from the stochastic sampling bias of DDA. Includes CHO spectral library coverage for enhanced peptide identification confidence.
  • Targeted PRM/MRM Absolute Quantification: Custom assay development for individual high-risk HCPs using heavy isotope-labeled AQUA peptide internal standards, delivering absolute concentrations in ng/mg drug substance or ppm with defined LOD, LOQ, linear range, and inter-assay precision metrics.
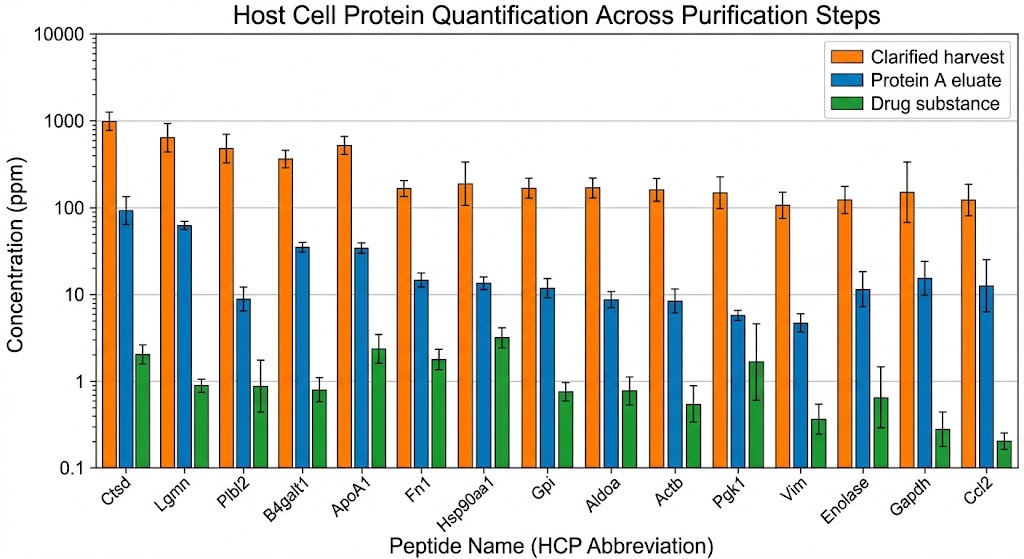
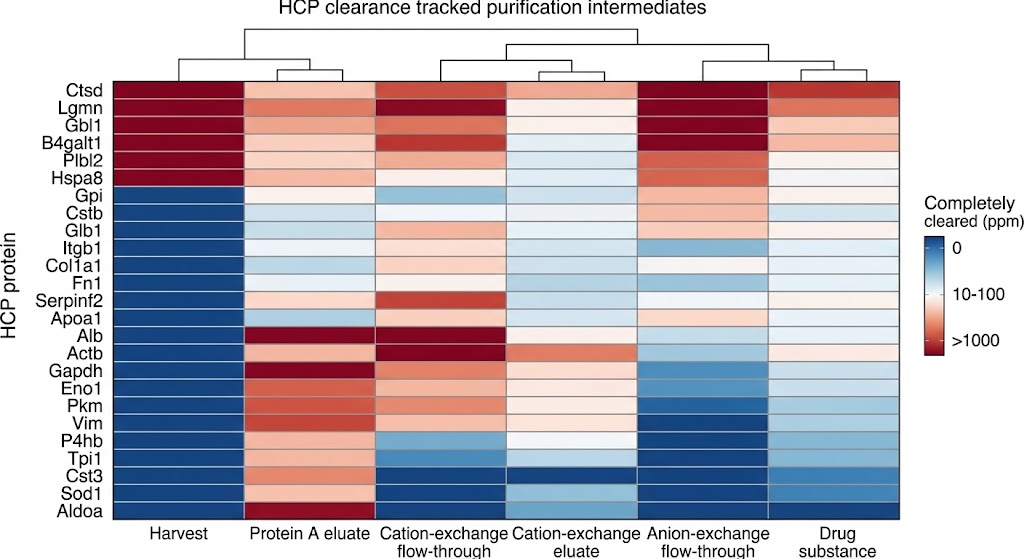
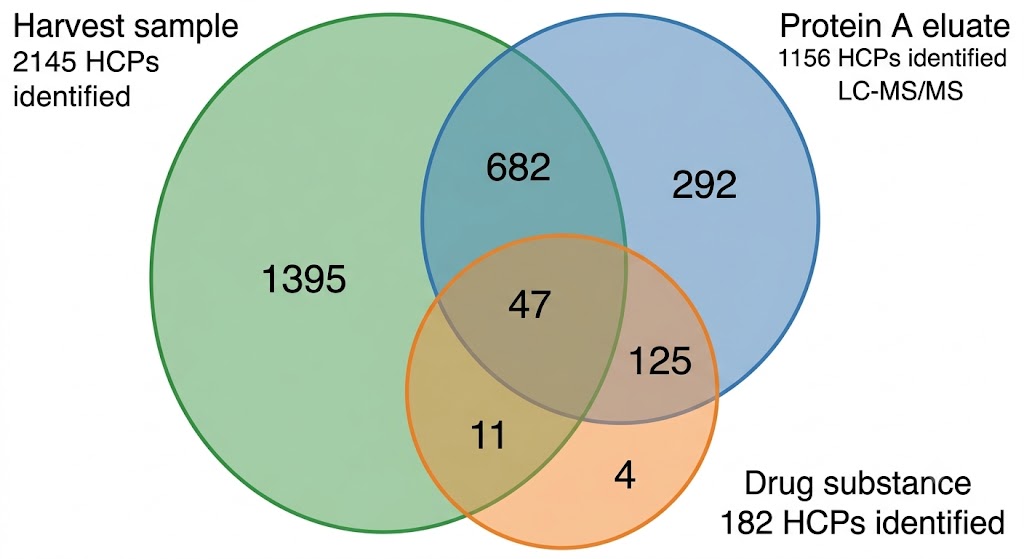
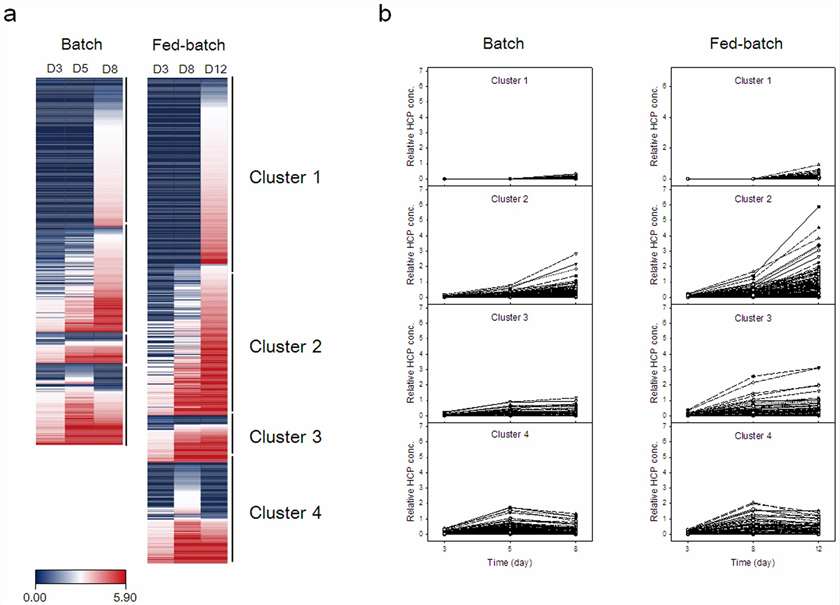
  • Clearance Tracking Across Purification Steps: Quantitative HCP inventory at each unit operation — clarified harvest, Protein A eluate, ion-exchange fractions, and final drug substance — with step-to-step clearance ratios and heatmap visualizations that reveal where each problematic protein is removed or persists.
HCP quantification workflow: CHO cell culture harvest through mAb purification to LC-MS/MS HCP identification and quantification

Overview of the HCP quantification platform: from CHO cell culture sampling to LC-MS/MS-based HCP identification, relative quantification by SWATH/DIA, and targeted PRM absolute quantification with heavy peptide internal standards for clearance tracking.

Why LC-MS/MS for HCP Analysis: Moving Beyond Aggregate ELISA Measurements

Multi-attribute HCP quantification has been transformed by the adoption of high-resolution mass spectrometry. Traditional ELISA-based total HCP measurement — while operationally convenient — provides only a single aggregate concentration value that masks the identity, abundance, and potential risk of individual host cell proteins co-purifying with the therapeutic product. This limitation matters: two products with identical ELISA HCP readings may carry dramatically different HCP risk profiles depending on whether the residual proteins include proteases, lipases, or immunogenic species. LC-MS/MS changes this equation entirely by delivering protein-level resolution — identifying each HCP present, quantifying its absolute abundance in ppm, and tracking its clearance across individual purification unit operations.

The transition from broad discovery to regulated quantification in HCP analysis mirrors the evolution of mass spectrometry acquisition strategies themselves. Data-dependent acquisition (DDA) provided the first glimpse into CHO proteome complexity but suffers from stochastic precursor sampling — HCP Coverage Analysis reveals that DDA typically identifies only 20–40% of detectable peptides in a given run, creating run-to-run irreproducibility. Data-independent acquisition (SWATH/DIA) solves this by systematically fragmenting all peptides within defined mass windows, creating a complete digital record of every detectable HCP peptide. For critical HCPs requiring absolute quantification with regulatory-grade rigor, targeted PRM/MRM with heavy isotope-labeled internal standards provides sub-ppm sensitivity and defined accuracy/precision metrics — complementing the discovery depth of DIA with the quantitative certainty required for process validation.

Comparison of three LC-MS/MS acquisition strategies for HCP analysis: DDA (stochastic precursor sampling), SWATH/DIA (systematic peptide recording), and targeted PRM/MRM (absolute quantification with heavy standards)

LC-MS/MS-Based HCP Analysis: SWATH/DIA and Targeted Quantification Strategies

SWATH/DIA Discovery Profiling

Data-independent acquisition systematically fragments all peptide precursors within defined mass windows, generating a complete digital record free from DDA's stochastic sampling bias. We deploy SWATH-MS on both Sciex TripleTOF and Bruker timsTOF platforms for comprehensive HCP identification and label-free quantification. Our dedicated CHO spectral library covering over 10,000 proteins ensures each HCP is identified against experimentally verified fragmentation patterns. mAb Quantification by LC-MS/MS provides complementary product-specific analysis alongside HCP profiling.

Targeted PRM/MRM Absolute Quantification

Once critical HCPs have been identified, targeted quantification provides analytical rigor for process validation and regulatory documentation. We develop custom PRM assays for individual HCPs, selecting 2–3 proteotypic peptides per target and optimizing scheduled retention time windows and collision energies. Heavy isotope-labeled AQUA peptide internal standards are synthesized for absolute quantification. Calibration curves constructed from heavy peptide dilution series enable HCP reporting in ng/mg drug substance or ppm. Our PRM Targeted Proteomics platform delivers routine sub-10 ppm mass accuracy for sensitive HCP detection.

Clearance Tracking & Risk Assessment

Quantifying individual HCPs across purification steps builds a step-by-step clearance profile that reveals where each problematic protein is removed and where it persists. We provide quantitative HCP inventories with step-to-step clearance ratios and heatmap visualizations. Process development teams use these data to identify HCPs surviving specific unit operations, compare clearance between resin candidates, and prioritize individual HCPs for targeted assay development. Our Target Validation Proteomics approach transforms HCP data from a compliance checkbox into actionable process knowledge.

Host Cell Protein Quantification Workflow

Step 1 — Study Design & Sample Collection: Define the process development question, select sample collection points (harvest, Protein A eluate, polishing fractions, drug substance), and specify quantification strategy (label-free profiling vs targeted absolute quantification with heavy standards).

Step 2 — Sample Preparation & Protein Digestion: Clarify samples by centrifugation, reduce and alkylate proteins, and digest with trypsin or alternative enzymes. For high-mAb matrices, optional mAb depletion or peptide-level clean-up may be applied to enhance HCP peptide detection.

Step 3 — LC-MS/MS Acquisition: SWATH/DIA acquisition for discovery profiling (comprehensive peptide recording); targeted PRM/MRM acquisition for absolute quantification of pre-selected HCP peptides with scheduled retention time windows and heavy isotope internal standards.

Step 4 — Data Analysis & Quantification: SWATH/DIA data processed against CHO spectral library for HCP identification and label-free quantification; PRM data processed by Skyline for peak integration and absolute concentration calculation using heavy peptide calibration curves.

Step 5 — Reporting & Clearance Profiling: Quantitative HCP inventory tables ranked by concentration, step-to-step clearance ratios, heatmap visualizations of HCP persistence, and per-HCP risk assessment with known quality impact annotations.

Sample Requirements for CHO HCP Analysis

Sample Type Recommended Input Key Notes
Clarified cell culture harvest (HCCF) 100–500 µL Contains highest HCP load; may require mAb depletion for deep HCP coverage; clarification by centrifugation recommended before shipment
Protein A eluate / affinity capture eluate 50–200 µL (≥50 µg total protein) Most common sample for HCP profiling; mAb is the dominant protein; HCPs typically present at 100–10,000 ppm range
Ion-exchange fractions (flow-through, wash, eluate) 50–200 µL per fraction Multiple fractions per unit operation recommended to track HCP partitioning; provide conductivity and pH data if available
Hydrophobic interaction / mixed-mode fractions 50–200 µL per fraction High-salt fractions require buffer exchange before digestion; indicate buffer composition to optimize sample preparation
Final drug substance / purified product 100–500 µL (≥100 µg total protein) Lowest HCP levels (typically <100 ppm); higher protein input recommended for maximum HCP detection sensitivity

HCP Quantification in Practice

Our HCP quantification platform delivers robust, reproducible data across diverse CHO biologics process scenarios. The representative examples below illustrate the depth and quality of HCP quantification data produced by our SWATH/DIA and targeted PRM workflows — from individual HCP concentration bar charts through clearance heatmaps to coverage Venn diagrams.

HCP quantification results: individual HCP concentrations in ppm across harvest, Protein A eluate, and drug substance

Individual HCP concentrations reported in ppm: bar chart showing 15 high-risk HCPs quantified across cell culture harvest, Protein A eluate, and drug substance samples, with clearance ratios annotated per purification step.

HCP clearance heatmap across purification steps showing progressive removal with persistence color coding

HCP clearance heatmap: normalized HCP abundance across 6 purification intermediates, color-coded from blue (cleared) to red (persistent), highlighting problematic HCPs that survive into polishing steps.

Venn diagram of HCPs identified across CHO harvest, Protein A eluate, and drug substance showing overlap

HCP inventory overlap: Venn diagram comparing HCPs identified in harvest, Protein A eluate, and drug substance samples, illustrating stage-specific HCP populations and the subset that persists through purification.

CASE STUDY

Mapping HCP Dynamics Across CHO mAb Production

Park JH, Jin JH, Lim MS, An HJ, Kim JW, Lee GM. Scientific Reports. 2017;7:44246. DOI: 10.1038/srep44246

Background & Purpose

A fundamental challenge in biologics process development is understanding which specific host cell proteins persist in the culture supernatant, how their concentrations change over time, and whether their presence correlates with measurable changes in drug product quality. While ELISA-based total HCP measurement provides a single aggregate value, it cannot distinguish between hundreds of individual HCP species — some benign, others potentially compromising product stability or safety. Park and colleagues at KAIST addressed this gap by deploying nanoflow LC-MS/MS to systematically identify and quantify HCPs in the culture supernatants of a mAb-producing recombinant CHO (rCHO) cell line, comparing batch and fed-batch culture modes and linking individual HCP concentration trajectories to mAb quality attributes.

Methods

The study used an rCHO DG44 cell line producing a humanized IgG1 monoclonal antibody. Cells were cultured in both batch mode (7 days) and fed-batch mode (12 days), with culture supernatant samples collected at multiple time points throughout each run. HCPs were isolated from the culture supernatant, digested with trypsin, and analyzed by nanoflow LC-MS/MS on an LTQ Orbitrap Velos instrument. Protein identification was performed by searching MS/MS spectra against the Chinese hamster proteome database, with label-free quantification based on spectral counting and extracted ion chromatogram peak areas. In parallel, the purified mAb from each time point was characterized for aggregation (size-exclusion HPLC), charge variant distribution (cation-exchange HPLC), and N-glycan profiles (hydrophilic interaction LC with fluorescence detection).

Results Overview

The depth of HCP coverage achieved was substantial: 1,934 proteins were identified and 1,486 quantified in batch culture, while fed-batch culture — with its higher peak cell density and extended duration — yielded 2,145 identified and 1,673 quantified HCPs. Gene ontology analysis of the identified HCPs revealed enrichment in extracellular region, cytoplasmic, and organelle lumen proteins, reflecting the combined contributions of active secretion and cell lysis to the HCP pool. Fig. 6 from the study showed that the top 30 most abundant HCPs accounted for the majority of total HCP mass, with the single most abundant protein representing nearly 20% of the total in early culture phases. Fig. 8 presented a clustering heatmap that grouped quantified HCPs into four distinct temporal clusters — proteins that accumulated progressively throughout culture, those that peaked at mid-culture and declined, those that remained relatively constant, and those that appeared only in late-stage fed-batch samples.

The critical finding linking HCP profiles to product quality came from correlating individual HCP abundance trajectories with mAb quality attributes over culture duration. Four specific HCPs showed concentration profiles that aligned with changes in product quality: legumain (Lgmn) and cathepsin D (Ctsd) — both proteases — correlated with increased mAb aggregation; β-galactosidase (Gbl1) abundance tracked with shifts in N-glycan profiles; and β-1,4-galactosyltransferase (B4galt1) correlated with charge variant distribution changes. These correlations were observed in fed-batch cultures where proteolytic HCPs accumulated to higher concentrations over the extended culture duration.

Case study: HCP identification counts across culture time points comparing batch and fed-batch CHO cultures (Fig. 4 from Park et al. 2017)

Fig. 4 from Park et al. 2017: Number of HCPs identified and quantified across culture time points in batch and fed-batch CHO cultures, with Venn diagram showing overlap between the two culture modes.

Case study: Top 30 most abundant HCPs percentage of total HCP mass (Fig. 6 from Park et al. 2017)

Fig. 6 from Park et al. 2017: The top 30 most abundant HCPs as percentage of total HCP mass, showing temporal changes in relative abundance across early, mid, and late culture phases in fed-batch culture.

Case study: HCP concentration heatmap and clustering analysis (Fig. 8 from Park et al. 2017)

Fig. 8 from Park et al. 2017: Heatmap of quantified HCP concentrations with 4 temporal clusters. HCPs in Cluster 1 (proteases Lgmn, Ctsd) correlated with mAb aggregation; Cluster 2 HCPs tracked with N-glycan changes.

Conclusion

This study provided one of the first comprehensive, quantitative maps of HCP dynamics across CHO mAb production, demonstrating that LC-MS/MS-based proteomics can simultaneously identify over 2,000 individual HCPs, quantify their abundance trajectories, and link specific proteins to measurable changes in drug product quality. The work established the analytical framework that underlies modern HCP risk assessment: identify all HCPs present, quantify the most abundant, and flag those with known or suspected quality impact for targeted monitoring. Creative Proteomics has built our HCP quantification service on these same principles, deploying more advanced SWATH/DIA and PRM acquisition strategies on contemporary high-resolution Orbitrap and timsTOF platforms to deliver the identification depth, quantification reproducibility, and process insight that biologics development teams require.

Frequently Asked Questions

Q1: How does LC-MS/MS HCP analysis compare to ELISA — should I replace our existing ELISA assay?

LC-MS/MS is not a replacement for ELISA but an orthogonal complement. ELISA provides rapid, high-throughput total HCP quantification that is well established in regulatory filings. LC-MS/MS adds protein-level resolution: it identifies *which specific* HCPs are present and quantifies them individually. The two methods together provide the most complete HCP picture — ELISA for total HCP trending and lot-release consistency, LC-MS/MS for process characterization, critical HCP identification, and purification optimization. Most of our clients run both methods in parallel, using LC-MS/MS data to inform ELISA coverage assessment and to track specific high-risk HCPs that ELISA may not detect.

Q2: What level of HCP can you detect — can you quantify down to single-digit ppm?

Yes. For SWATH/DIA label-free profiling, our typical limit of detection is 1–10 ppm depending on the HCP's ionization efficiency, peptide detectability, and matrix background. For targeted PRM/MRM assays with heavy peptide internal standards and optimized scheduling, we can achieve LODs of 0.5–2 ppm for well-characterized target peptides. The actual achievable sensitivity depends on the specific HCP, the drug substance matrix, the total protein loaded for digestion, and whether additional sample preparation (depletion, enrichment, fractionation) is applied. We perform a feasibility assessment for each project during study design to establish realistic sensitivity expectations.

Q3: Can you analyze HCPs from non-CHO expression systems (HEK293, NS0, yeast, E. coli)?

Yes. While CHO is the most common expression system for our HCP clients, our proteomics workflows are host-agnostic. The key requirement is an appropriate protein sequence database for the host organism — we maintain reference proteome databases for CHO (Chinese hamster), HEK293 (human), NS0/Sp2/0 (mouse), S. cerevisiae, P. pastoris, and E. coli. For less common hosts, we can build custom databases from publicly available genome sequences. Contact our team with your specific expression system; we will confirm database availability and any special method development requirements during project scoping.

Q4: What information do you need to start an HCP quantification project?

For project initiation, we ask for: (1) the host cell line and expression system; (2) the therapeutic molecule type (mAb, bispecific, fusion protein, ADC, etc.) and approximate molecular weight; (3) a list of process intermediate samples with approximate protein concentrations; (4) the specific process questions you are trying to answer (e.g., compare two resin candidates, identify problematic HCPs in final product, track clearance across unit operations); and (5) whether you require relative quantification (SWATH/DIA profiling) or absolute quantification of specific HCPs (PRM/MRM with heavy peptide standards). We use this information to design the analytical plan, estimate sample requirements, and provide a project proposal with timeline and deliverables.

Q5: How do you ensure data quality and reproducibility in HCP quantification?

Quality control is embedded at every stage. For SWATH/DIA quantification, we include pooled QC samples at regular intervals throughout the analytical batch, monitoring retention time stability, mass accuracy, and peptide identification consistency. Each reported HCP concentration includes the number of quantifying peptides and the coefficient of variation across technical replicates. For targeted PRM/MRM assays, we construct calibration curves with heavy peptide standards, report LOD/LOQ and linear range, and include system suitability injections at the beginning and end of each batch. All raw data, processed results, and QC metrics are provided in the final report — nothing is hidden behind a summary table. We also retain all sample digests for a defined period after project completion, enabling re-analysis if additional questions arise.

References

  1. Park JH, Jin JH, Lim MS, An HJ, Kim JW, Lee GM. Proteomic Analysis of Host Cell Protein Dynamics in the Culture Supernatants of Antibody-Producing CHO Cells. Sci Rep. 2017;7:44246.
  2. Bracewell DG, Francis R, Smales CM. The future of host cell protein (HCP) identification during process development and manufacturing linked to a risk-based management for their control. Biotechnol Bioeng. 2015;112:1727-1737.
  3. Pilely K, Johansen MR, Lund RR, Kofoed T, Jørgensen TK, Skriver L, Mørtz E. Monitoring process-related impurities in biologics — host cell protein analysis. Anal Bioanal Chem. 2022;414:747-758.

GET STARTED

Advance Your HCP Characterization with Antibody-Independent Quantification

From SWATH/DIA profiling across thousands of CHO proteins to targeted PRM absolute quantification of critical HCPs at single-digit ppm — our LC-MS/MS platform provides the analytical depth your process development demands. Every project is supported by comprehensive HCP inventories, clearance tracking, and process insight reporting.

Ready to discuss your HCP quantification requirements?

Request a Customized Quote