- Service Details
- Case Study
- FAQ
Glycomics is the study of the structure and function of carbohydrates (glycans) in biological systems, and it plays a crucial role in understanding various biological processes, including cell-cell recognition, signaling, and immune responses. Glycomics data analysis refers to the process of extracting meaningful information and insights from data generated through glycomics experiments.
Glycomics data analysis involves the complete study and interpretation of a cell or organism's glycome—the entire complement of sugars, whether free or present in more complex molecules. Glycomics data analysis enables researchers to:
- Characterize Glycan Structures: By analyzing mass spectrometry data, researchers can identify and characterize glycan structures, including their composition, linkage, and branching patterns.
- Identify Glycosylation Sites: Mapping glycosylation sites on proteins provides insights into protein function and regulation.
- Uncover Disease Biomarkers: Differential glycosylation patterns can serve as biomarkers for disease diagnosis, prognosis, and therapeutic targets.
- Study Glycan-Protein Interactions: Analyzing glycan-protein interactions elucidates molecular recognition events crucial for cellular processes.
At Creative Proteomics, we offer comprehensive glycomics service levels as well as glycomics data analysis. Our dynamic and iterative workflow builds on years of expertise and innovation to ensure accurate, reliable and potentially actionable glycomics data analysis.
Technical Platform for Glycomics Data Analysis Services
Data Preprocessing:
- Raw data generated from glycomics experiments often require preprocessing to clean and prepare it for analysis. This step may involve removing noise, correcting errors, normalizing data, and handling missing values.
- Data preprocessing also includes data transformation techniques such as scaling, log-transformations, or normalization to ensure that the data meet the assumptions of the analysis techniques to be applied later.
Data Mining:
- Data mining techniques are used to explore large datasets and discover patterns, trends, and associations within the glycomics data.
- Clustering algorithms, such as hierarchical clustering or k-means clustering, can group similar glycan structures together based on their structural features or abundance profiles.
- Principal Component Analysis (PCA) and other dimensionality reduction techniques can be employed to visualize high-dimensional glycomics data and identify underlying patterns or relationships.
Statistical Analysis:
- Statistical analysis methods are applied to glycomics data to identify significant differences between experimental groups or conditions.
- Parametric tests like t-tests or analysis of variance (ANOVA) are used when the data meet the assumptions of normality and homogeneity of variance. Non-parametric tests like the Mann-Whitney U test or Kruskal-Wallis test are used when these assumptions are violated.
- Multiple testing correction methods, such as Bonferroni correction or False Discovery Rate (FDR) adjustment, are employed to account for the inflation of Type I error rates when conducting multiple statistical tests.
Interpretation:
- Interpretation of glycomics data involves understanding the biological implications of the findings and relating them to the underlying biological processes.
- Identified glycan structures or glycan profiles may be compared to existing databases or literature to elucidate their roles in specific biological functions or diseases.
- Integration with other omics data, such as genomics, proteomics, or metabolomics, can provide a comprehensive understanding of biological pathways and networks involving glycans.
Results Presentation
- First and foremost, a complete summary of the statistical analysis conducted, along with the methodologies employed and the significant findings, is clearly elucidated.
- Univariate and multivariate statistical analysis results portraying differential glycan profiles, correlations and trends, are depicted in multiple formats like bar plots, box plots, scatter plots, PCA plots, and hierarchically clustered heatmaps.
- The results of the functional analysis, the map of the predicted involvement in biological processes and pathways of the differentially expressed glycans, are presented in easily comprehensible pathway diagrams.
- A repository of identified glycan structures and their quantitative information is incorporated into the report, complemented by comprehensive annotation information, including their predicted functions and related references.
Case. Quantitative Analysis of Free and Conjugated Sialic Acids in Throat Cancers Using LC-MS/MS
Background:
Throat cancers exhibit elevated levels of free 2-keto-3-deoxy-D-glycero-D-galacto-nononic acid (KDN), a sialic acid, which may serve as a potential biomarker for early cancer detection and prognosis assessment. However, the molecular mechanisms underlying this elevation remain unclear.
Samples:
The study analyzed 59 throat cancer samples and a subset of 10 matched regional lymph nodes obtained from patients undergoing surgery for head and neck cancers of the throat. These samples were stored at -80°C until analysis.
Technical Method:
1. Sample Collection: Tumor tissue samples and matched regional lymph nodes were obtained from patients with head and neck cancers of the throat. Samples were collected during surgery from the Department of Otorhinolaryngology, China Medical University, following approval by the Human Subjects Review Committee and patient consent.
2. LC–MS/MS Glycomic Method:
- Instrumentation: An Agilent 1100 LC system coupled with a triple quadrupole 3200 QTRAP mass spectrometer.
- Chromatographic Separation: A ZORBAX Eclipse Plus C18 column (4.6 × 250 mm, 5 µm particle size) with a guard column. Mobile phase A consisted of 0.01% ammonium acetate in water, and mobile phase B consisted of acetonitrile.
- Gradient Program: Initial gradient of 100% A, followed by a linear gradient to 10% B over 0.5 min, then held at 10% B for 2.5 min, and returned to 100% A by 4 min.
- Injection Volume: 20 µL for all samples.
- Mass Spectrometry Parameters: Negative ion multiple reaction monitoring (MRM) mode, with optimized settings for declustering potential, entrance potential, collision entrance potential, collision energy, and collision cell exit potential (detailed in Table VIII).
- Ion Source Conditions: Ion spray voltage of -4.5 kV, source temperature of 550°C, curtain gas (N2) at 25 psi, collision gas (N2) set to medium, and ion source gases 1 and 2 at 60 psi.
3. Sample Preparation:
- Tumor tissue samples (20–60 mg wet weight) were homogenized in Tris-buffered saline (TBS) and centrifuged to obtain a pellet (P-1). The supernatant was treated with ethanol to precipitate sialylated conjugates, yielding another pellet (P-2).
- P-1 and P-2 fractions were subjected to mild acid hydrolysis using trifluoroacetic acid (TFA) to release Sia glycans.
- Ethanol-soluble supernatant fractions were concentrated and analyzed for free KDN, Neu5Ac, and Neu5Gc concentrations by LC–MS/MS.
4. Quantitative Analysis:
- Calibration curves were prepared for KDN, Neu5Ac, and Neu5Gc to determine LC–MS/MS parameters.
- Limits of detection were <0.01 µmol/L for all Sias, with correlation coefficients (r2) >0.992.
- Sia concentrations were determined in tumor and lymph node tissues, expressed as µg/g (or ng/g) wet weight or mg/protein.
5. Statistical Analysis:
- Data were expressed as mean ± standard error of mean.
- One-way ANOVA and Student's t-test were used to compare Sia levels between tumor sites, differentiation status, and pathological N- and T-factors.
- Pearson's correlation and F test were employed to analyze correlations and compare regression lines, respectively.
Results:
The study revealed significantly elevated levels of free KDN in throat cancers compared to other sialic acids, particularly in poorly to moderately differentiated tumors. This elevation was consistent across different anatomical sites within the throat. The LC-MS/MS method demonstrated high sensitivity and specificity in quantifying free and conjugated forms of sialic acids in cancer tissues and lymph nodes. Moreover, the correlation between free KDN levels and differentiation status suggests its potential as a biomarker for early cancer detection and prognosis assessment.
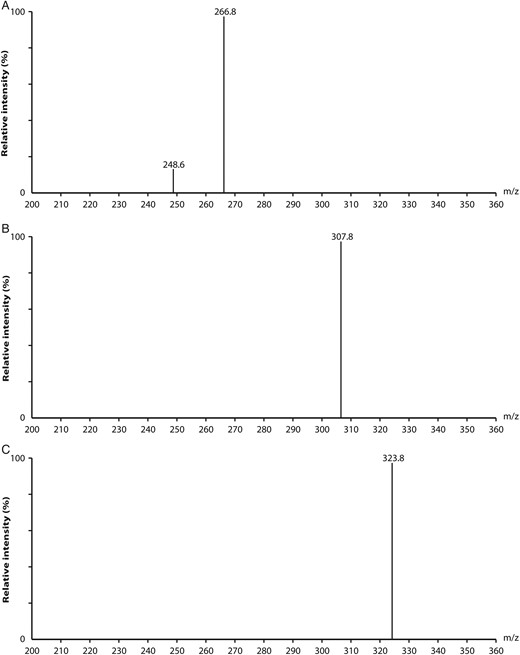
 Electrospray ionization mass spectra of the negatively single-charged ions [M−H]− parent ions for KDN (m/z 266.8; A); Neu5Ac (m/z 307.8; B) and Neu5Gc (m/z 323.8; C).
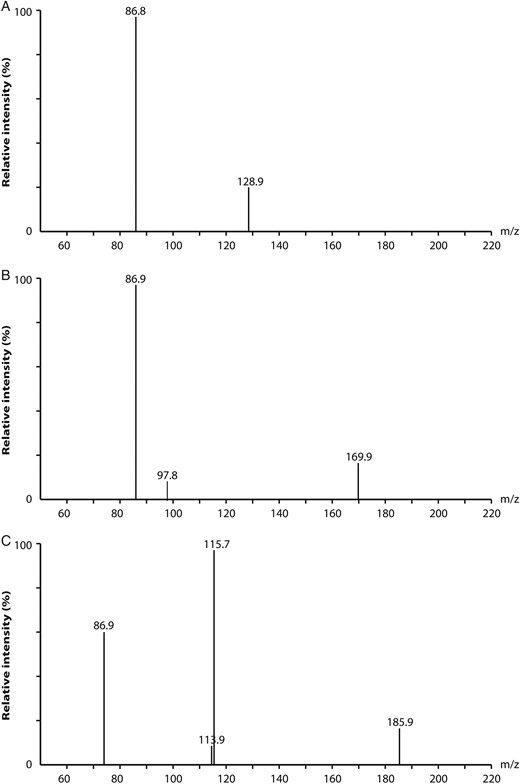
 Electrospray ionization mass spectra of the daughter scan of KDN at (m/z 86.8, with m/z 266.8 as the parent ion; A); Neu5Ac at m/z 86.9 with m/z 307.8 as the parent ion; B) and Neu5Gc at m/z 115.7 with m/z 323.8 as the parent ion; C).
Reference
- Wang, Fang, et al. "LC–MS/MS glycomic analyses of free and conjugated forms of the sialic acids, Neu5Ac, Neu5Gc and KDN in human throat cancers." Glycobiology 25.12 (2015): 1362-1374.
What types of data are analyzed in glycomics?
Glycomics data can include various types of information, such as mass spectrometry data, chromatography profiles, glycan structures, glycosylation patterns, and associated biological or clinical metadata.
What software tools are commonly used for glycomics data analysis?
Popular software tools for glycomics data analysis include GlycoWorkbench, GlycoBase, GlycoMod Tool, GlycReSoft, SimGlycan, GlycomeDB, and various scripting languages like Python with specialized libraries such as GlyPy or Glycoworkflows.
What statistical methods are applied to glycomics sample data?
Statistical methods such as multivariate analysis, clustering, classification, and regression are used for pattern recognition, biomarker discovery, and comparing glycosylation profiles across different samples or conditions.


