- Service Details
- Case Study
Quantitative glycomics aims to systematically analyze the abundance, composition, and structural diversity of glycans in biological systems. This field plays a crucial role in understanding the roles of glycans in various physiological and pathological processes, such as cell signaling, immune response, and disease development. By quantitatively measuring the levels of individual glycans or classes of glycans, researchers can uncover biomarkers for disease diagnosis and prognosis, elucidate glycan-mediated biological pathways, and identify potential targets for therapeutic intervention. Glycan quantification encompasses a range of analytical techniques, including mass spectrometry, chromatography, and electrophoresis, coupled with advanced data analysis tools to provide comprehensive insights into the glycome of biological samples. At Creative Proteomics, we provide high-end quantitative glycomics analysis, catering specifically to the needs of individual researchers.
Technical Platform for Quantitative Glycomics
Sample Preparation:
- Glycan extraction: Biological samples, such as blood serum, cell lysates, or tissues, undergo glycan extraction to isolate glycans from proteins and other biomolecules.
- Derivatization: Depending on the analytical method, glycans may undergo derivatization to enhance detection sensitivity and/or chromatographic separation. Common derivatization methods include reductive amination, permethylation, and stable isotopic labeling.
Separation Techniques:
a. Capillary Electrophoresis (CE):
- CE coupled with laser-induced fluorescence (LIF) or mass spectrometry (MS) enables high-resolution separation and detection of glycans based on their charge-to-size ratio.
- CE-LIF provides sensitive detection of fluorescently labeled glycans, while CE-MS offers structural characterization and quantification.
b. Liquid Chromatography (LC):
- Hydrophilic interaction liquid chromatography (HILIC) and porous graphitized carbon (PGC) columns are commonly used for glycan separation in LC.
- HILIC separates glycans based on their hydrophilicity, while PGC columns offer efficient separation of isomeric glycans.
Mass Spectrometry (MS):
- MS is a central component of quantitative glycomics analysis, providing accurate mass measurements and structural information of glycans.
- Various MS platforms, including MALDI-MS, ESI-MS, and tandem MS (MS/MS), are employed for glycan analysis.
- MALDI-MS offers high-throughput glycan profiling, while ESI-MS provides detailed structural characterization and quantification.
- Tandem MS techniques enable fragmentation of glycans for structural elucidation and confirmation of glycan identities.
Data Analysis and Computational Tools:
- Software tools play a crucial role in processing and analyzing glycomics data, including peak detection, glycan annotation, quantification, and statistical analysis.
- Tools like Cartoonist, GlycoWorkBench, and GlycReSoft assist in glycan annotation from MS spectra.
- MultiGlycan is a versatile tool for quantitative glycomics analysis, offering features such as deconvolution of isotopic envelopes and integration with LC/MS data processing algorithms.
Quality Control and Standardization:
- To ensure accuracy and reproducibility, quality control measures such as using internal standards, calibrants, and QC samples are essential.
- Standardization of experimental protocols, instrument settings, and data analysis workflows helps minimize variability and ensures comparability of results across different studies.
Metabolic Labeling and Isotopic Tracing:
- Metabolic labeling techniques, such as stable isotopic labeling and metabolic incorporation of unnatural monosaccharides, offer dynamic information on glycan biosynthesis and turnover rates.
- Isotopic tracing experiments provide insights into glycan biosynthesis pathways and can be used for quantitative comparisons under different biological conditions.
Quantitative Glycomics Solutions at Creative Proteomics
We offer comprehensive quantitative glycomics analysis services, including but not limited:
Total Sugar Quantitative Analysis: We quantify the total sugar content, including monosaccharides and oligosaccharides, with detailed composition analysis of neutral and amino sugars. Our methods provide accurate measurements of sugar concentrations, allowing for the precise characterization of glycan profiles in biological samples.
Single Glycan Quantitative Analysis: We specialize in the quantification of individual glycans, providing detailed information on their abundance and distribution in complex biological matrices. Our advanced analytical techniques enable precise quantitation of specific glycan structures, facilitating the identification of disease-related glycan biomarkers and therapeutic targets.
Sample Requirements for Quantitative Glycomics
| Sample Type | Sample Volume |
|---|---|
| Serum | 50-100 µL |
| Plasma | 50-100 µL |
| Tissue Lysates | 10-20 mg |
| Cell Culture Supernatants | 50-100 µL |
| Purified Glycoproteins | 10-50 µg |
Advantages of Quantitative Glycomics
Accurate Quantification: Quantitative glycomics enables precise measurement of glycan abundance, with detection limits reaching picomolar concentrations, ensuring accurate quantification of subtle changes.
High-throughput Analysis: Advanced analytical platforms allow for high-throughput analysis of glycan samples, processing hundreds to thousands of samples per day, enhancing research efficiency.
Reproducibility: Demonstrates high reproducibility across different experiments and laboratories, ensuring consistent and reliable results.
Biomarker Discovery: Quantitative glycomics facilitates the identification of glycan biomarkers associated with diseases, with studies demonstrating up to 90% accuracy in distinguishing disease states from controls.
Functional Insights: Correlates changes in glycan abundance with specific physiological or pathological conditions, shedding light on glycan function and its role in various biological processes.
Integration with Omics Data: Enables integration with other omics data (e.g., genomics, proteomics) to provide a comprehensive understanding of biological systems and pathways.
Case. Comparative Analysis of Serum Glycomes in Humans and Mice and Identification of Liver Disease Biomarker Candidates
Background:
Comparative studies on serum glycomes between humans and mice using consistent analytical techniques are limited. Understanding the glycomic profiles in both species and identifying potential biomarkers for liver diseases could provide valuable insights into disease mechanisms and aid in clinical diagnosis and treatment.
Samples:
Serum samples from both human and mouse subjects were analyzed. For the human group, six samples were analyzed, while for the mouse group, samples from three different disease stages (simple steatosis, nonalcoholic steatohepatitis, and cirrhosis) were studied, with five samples per stage.
Technical Method:
Extraction of Glycans: Serum samples were subjected to delipidation and various extraction methods to obtain intact glycans from different glycoconjugates, including N-glycans, fOSs, GAGs, O-glycans, and GSL-glycans.
Glycoblotting: Glycans extracted from different glycoconjugates were subjected to glycoblotting for further analysis.
β-elimination in the presence of pyrazolone analogues (BEP): Serum glycoproteins were treated with BEP for O-glycan analysis.
Quantitative Analysis by MALDI-TOF-MS: Purified glycans were mixed with 2,5-dihydrobenzoic acid solution and analyzed using MALDI-TOF-MS. External calibration was performed for high mass measurement accuracy.
HPLC Analysis: GAG disaccharides were analyzed by HPLC after labeling with 2AB.
Results:
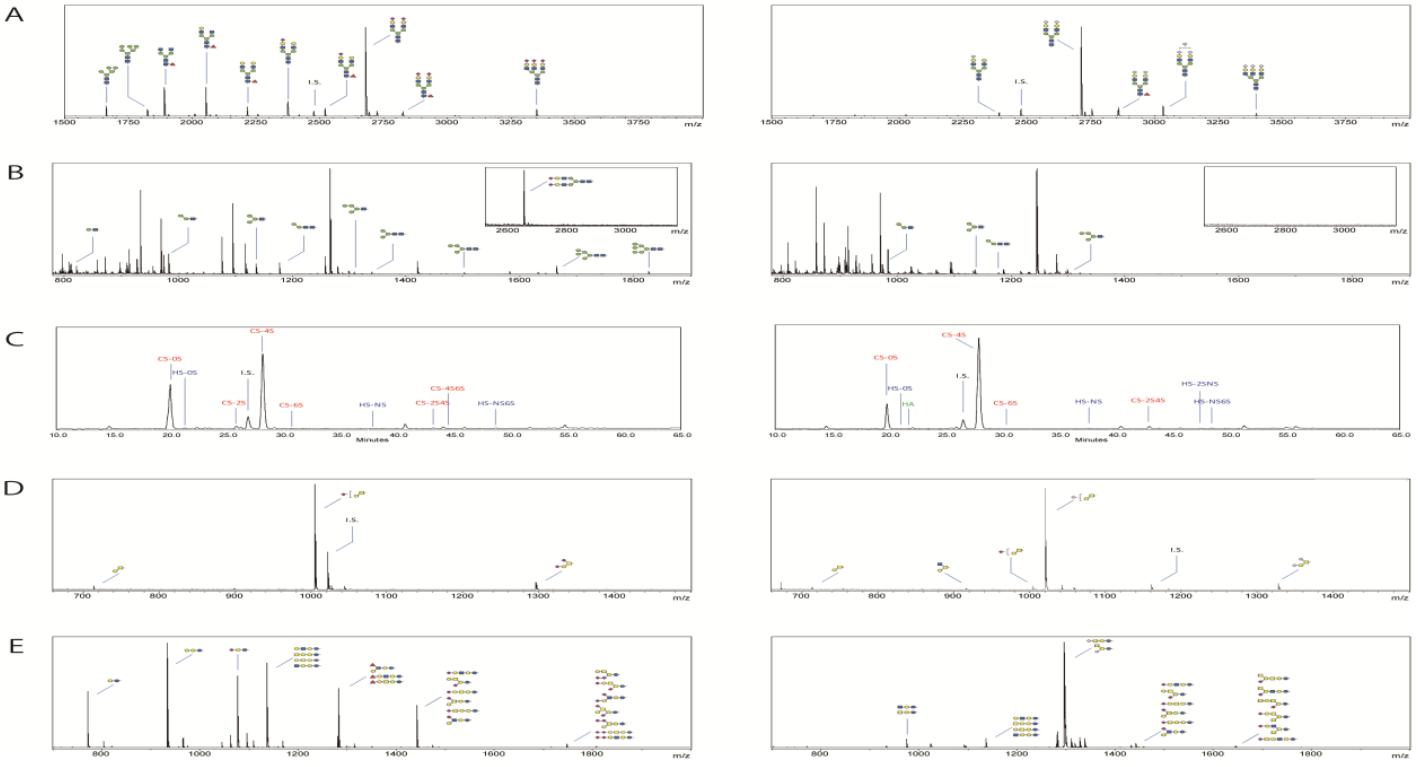
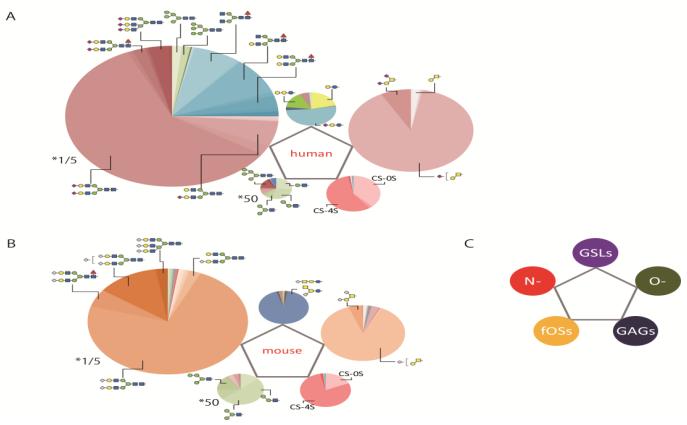
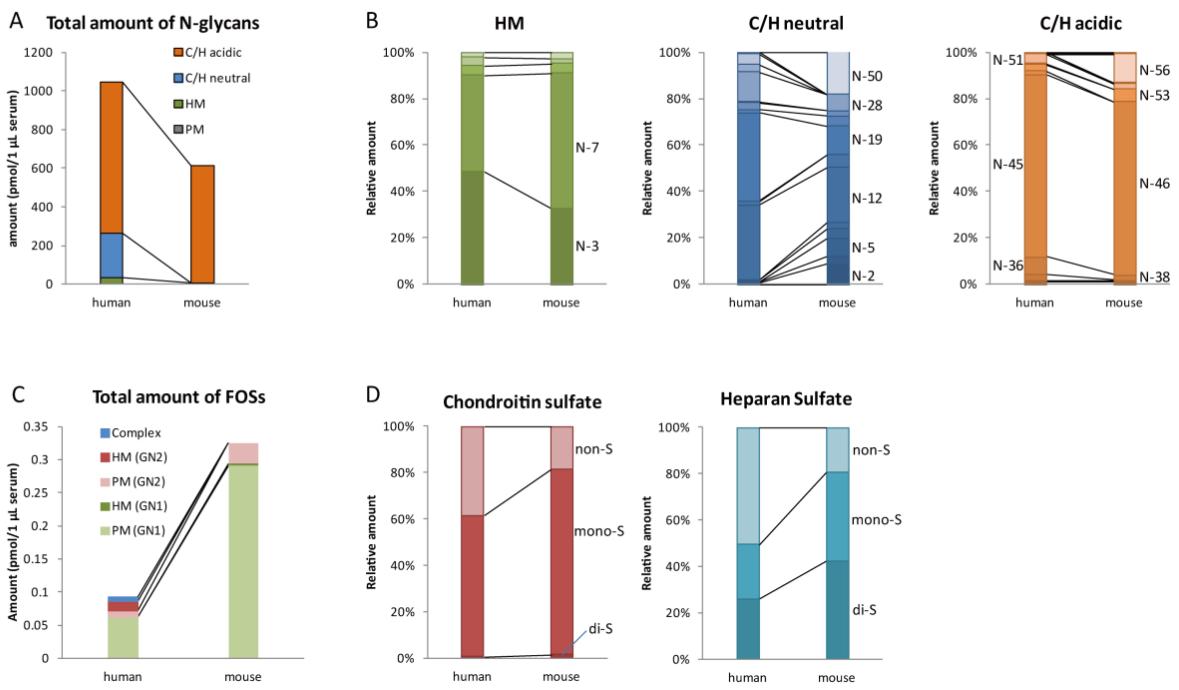
N-Glycans: Major differences in N-glycan structures and sialic acid composition were observed between human and mouse sera.
fOSs: Both complex- and HM/PM-type fOSs were detected in human serum, with PM-type fOSs being predominant in mouse serum.
GAGs: The major GAG disaccharides were similar in both human and mouse sera, with variations in sulfation patterns.
O-Glycans: Mucin-type O-glycans were identified, with differences in sialic acid composition between human and mouse sera.
GSL-Glycans: Substantial differences were observed between human and mouse sera, with GM2 being the predominant GSL-glycan in mouse serum.
 Representative MALDI-TOF-MS spectra and HPLC chromatograms showing the glycomic profiles obtained for human (left panels) and mouse (right panels) sera.
 Comprehensive glycomic profiles of human (A) and mouse (B) sera.
 Structural classification of the quantified glycans
Reference
- Yoshida, Yasunobu, et al. "Quantitative analysis of total serum glycome in human and mouse." Proteomics 16.21 (2016): 2747-2758.


