Metabolic Data Analysis Services
Large and complex data sets can be time-consuming to capture and difficult to manage. Creative Proteomics has been developing metabonomics detection methods and data analysis methods for many years. We continue to expand our services and develop new analytical methods. Based on a world-leading compound library and integrated bioinformatics tools, we have established an automatic analysis workflow for metabolic data. Our services include standard analysis, personalized analysis, helping our clients get the most out of their metabolic data.
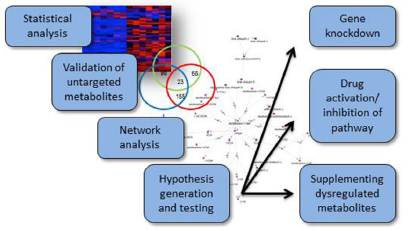
 Fig1. Statistical analysis, pathway analysis, and validation strategies for metabolomics workflows. (Manchester, M., & Anand, A., 2017)
Metabolic statistical analysis
Multivariate statistical methods are required to analyze both targeted and untargeted metabolomics data. Initial visualization methods can determine whether outliers exist and whether data derived from groups of samples cluster together. These methods include partial-least-squares discriminant analysis (PLS-DA), orthogonal partial least-squares discrimination analysis (OPLS-DA), and principal component analysis (PCA). The fold-change difference and T-test are then used to show the results of individual metabolites compared to control groups. At the same time, multiple testing correction methods are adopted to minimize false positives. Generally, once the analyte has been validated, subsequent analysis of the particular analyte of interest can be conducted.
Metabolic pathway analysis
Based on a subset of identified dysregulated metabolites, the pathways of interest can be defined and visualized using pathway analysis. There are a variety of available pathway analysis tools, such as Metscape, Metaboanalyst, Cytoscape. Common metabolome datasets include HMDB, KEGG, Reactome, BioCyc, MetaCyc, and other databases.
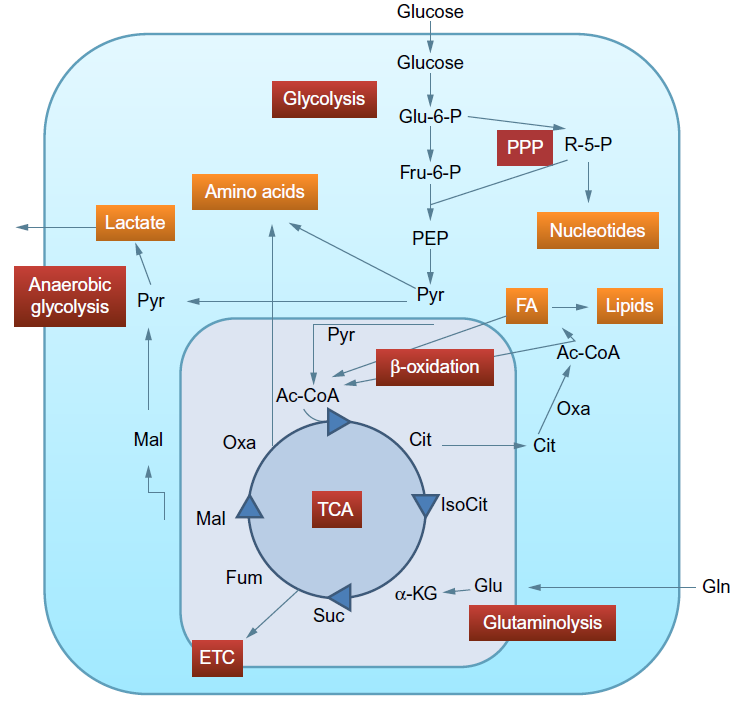
 Fig2. Metabolic pathways commonly influenced by virus infections. (Manchester, M., & Anand, A., 2017)
Services offering in Creative Proteomics
Standard metabolic analysis services
Principal component analysis (PCA)
Represent the overall metabolic difference between samples as well as the variation degree between samples within the group.
Partial-least-squares discriminant analysis (PLS-DA)
The random errors irrelevant to the purpose of the study are cleared, to find the differences between groups and their differential compounds.
Correlation analysis
The consistency of trends between pairs of metabolites.
Hierarchical cluster analysis
Metabolites with a similar metabolic pattern are grouped together, to predict the function of metabolites.
Enrichment analysis
To analyze whether a group of metabolites appeared at a certain functional node.
Pathway analysis
Output the importance of the path in the overall network.
Personalized metabolic analysis services
Stage specific metabolite analysis
Weighted gene co-expression network analysis, WGCNA
Correlation analysis of metabolism and transcription
Analysis of the interaction between differential metabolites and differential genes
Available services
- Targeted metabolomics data analysis
- Untargeted metabolomics data analysis
Creative Proteomics has expertise in metabolomics data processing and statistical analysis. We offer varous metabolic data analysis services, but not limited to them. We are committed to helping our clients get the most out of their metabolic data. For more information on how we can help you, please feel free to contact us. Customers have direct access to our staff and get timely feedback.
Reference
- Manchester, M., & Anand, A. (2017). "Metabolomics: strategies to define the role of metabolism in virus infection and pathogenesis." Advances in virus research, 98, 57-81.
* For research use only.

 Fig1. Statistical analysis, pathway analysis, and validation strategies for metabolomics workflows. (Manchester, M., & Anand, A., 2017)
  Fig2. Metabolic pathways commonly influenced by virus infections. (Manchester, M., & Anand, A., 2017)