Activity-Based HDAC and HAT Assays for Epigenetic Drug Discovery and Acetylome Research
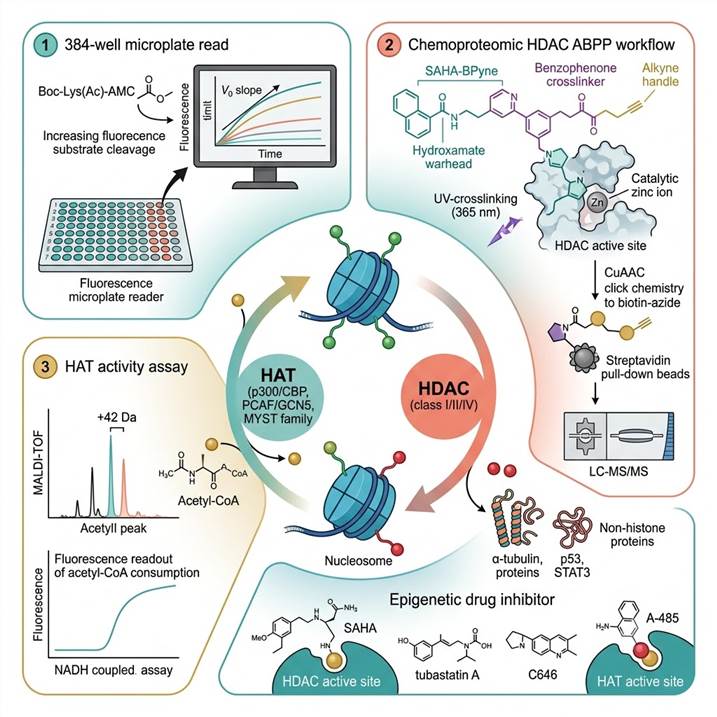
The acetylation-deacetylation cycle — comprising histone acetyltransferases (HATs/KATs) that transfer acetyl groups from acetyl-CoA to lysine residues on histones and non-histone proteins, and histone deacetylases (HDACs) that remove these acetyl groups — is a central regulatory mechanism in eukaryotic gene expression, chromatin dynamics, and cellular signaling. Dysregulation of this cycle is implicated in a broad spectrum of diseases: HDAC overexpression or aberrant activity drives cancer cell proliferation (HDAC1/2/3 in hematological malignancies, HDAC6 in solid tumors), HAT mutations or translocations cause developmental disorders (p300/CBP mutations in Rubinstein-Taybi syndrome, MOZ/MORF translocations in acute myeloid leukemia), and altered acetyltransferase/deacetylase function contributes to neurodegenerative diseases (HDAC6 in Alzheimer's, SIRT1 in Parkinson's), inflammatory conditions (HDAC3 in macrophage activation), and metabolic disorders (SIRT1 in insulin resistance). The clinical success of HDAC inhibitors — including vorinostat (SAHA) for cutaneous T-cell lymphoma, romidepsin for peripheral T-cell lymphoma, panobinostat for multiple myeloma, and chidamide for peripheral T-cell lymphoma — has established HDACs as validated therapeutic targets and created an urgent demand for robust, predictive activity assays to support the discovery of next-generation HDAC inhibitors with improved isoform selectivity, expanded therapeutic indices, and activity against emerging HDAC targets including HDAC6 (the immunomodulatory target), HDAC8 (the pediatric cancer target), and HDAC11 (the immune checkpoint regulator). HAT inhibitors, while still in earlier stages of clinical development, represent an emerging therapeutic frontier with demonstrated anti-proliferative activity for p300/CBP inhibitors in prostate cancer and AML, and CBP catalytic inhibitors entering early-phase clinical trials.
Activity-based HDAC and HAT assays differ fundamentally from abundance-based methods (western blot, immunofluorescence) in that they measure the functional catalytic activity of the enzyme — not its presence or quantity. This distinction is critical because HDACs are frequently regulated through post-translational modifications, protein-protein interactions (complex formation with CoREST, NuRD, Sin3, NCoR/SMRT co-repressor complexes), and subcellular localization that modulate activity independently of protein abundance. Chemoproteomic activity-based probes (ABPs) — photoreactive hydroxamate probes that incorporate a zinc-chelating warhead for HDAC active-site binding, a benzophenone or diazirine photo-crosslinker for covalent capture, and an alkyne or biotin handle for enrichment — capture the functional state of HDAC complexes in native cellular environments, providing a direct readout of catalytic activity and complex composition that is orthogonal to and more mechanistically informative than abundance-based measurements. Our service integrates these activity-based approaches with complementary fluorogenic, MS-based, and antibody-based platforms to deliver a complete picture of HDAC and HAT enzyme function in any biological context. For comprehensive acetylation proteomics, our Acetylomics Analysis service provides global acetylated peptide identification and quantification by LC-MS/MS.
Find Your Solution: Research Goal → HDAC/HAT Activity Assay Strategy
| Your Research Goal |
Recommended Approach |
Key Techniques |
| Biochemical IC₅₀ determination and isoform selectivity profiling for an HDAC inhibitor lead series across class I, II, and IV HDACs |
Fluorogenic HDAC activity assay panel using acetyl-lysine substrates with kinetic microplate readout |
Recombinant HDAC enzymes (class I: HDAC1/2/3/8, class IIb: HDAC6/10, class IV: HDAC11), Boc-Lys(Ac)-AMC or trifluoroacetyl-lysine substrate (50–200 μM), trypsin/developer solution, kinetic fluorescence readout (λex 360/λem 460 nm) in 384-well format, IC₅₀ determination by 10-point titration, Z′-factor assessment, selectivity ratios across HDAC isoforms |
| Target engagement and native complex selectivity profiling of an HDAC inhibitor in cellular lysates or live cells |
Chemoproteomic HDAC ABPP using photoreactive activity-based probes (SAHA-BPyne) with quantitative LC-MS/MS |
Cell lysate or live cell treatment with SAHA-BPyne photoaffinity probe (1–10 μM, 365 nm UV crosslinking, 30 min on ice), CuAAC click chemistry with biotin-azide or TMT-azide, streptavidin pull-down, on-bead trypsin digestion, quantitative LC-MS/MS (Orbitrap), HDAC complex identification (HDACs + co-repressor proteins), competition ABPP with inhibitor for target occupancy and selectivity quantification |
| Biochemical HAT activity assay and inhibitor screening for p300/CBP or MYST family acetyltransferases |
Fluorescence-based or MS-based HAT activity assay using acetyl-CoA substrate and histone peptide acceptor |
Recombinant HAT enzyme (p300/CBP catalytic domain, PCAF/GCN5, MYST family), acetyl-CoA substrate (1–50 μM), histone H3 or H4 peptide (1–10 μM, 15–25 aa), fluorescence readout (acetyl-CoA consumption by coupled enzyme assay with NADH detection, λex 340/λem 460 nm, or ELISA-based acetylated peptide detection with anti-acetyl-Lys antibody), or MALDI-TOF MS detection of acetylated peptide mass shift (+42 Da), IC₅₀ determination for HAT inhibitor compounds |
| Global histone acetylation quantification as a pharmacodynamic biomarker for HDAC or HAT modulator efficacy in cellular or in vivo samples |
Targeted LC-MS/MS quantification of site-specific histone acetylation marks with stable isotope internal standards |
Acid extraction of histones from cells or tissue, derivatization (propionylation or chemical derivatization for N-terminal and internal Lys protection), trypsin digestion, LC-MS/MS in PRM or MRM mode, quantification of 30+ acetylation marks (H3K9ac, H3K14ac, H3K27ac, H3K36ac, H3K56ac, H4K5ac, H4K8ac, H4K12ac, H4K16ac, H3K4ac, H2AK5ac, H2BK5ac, H2BK12ac, H2BK20ac) with stable isotope-labeled acetylated histone peptide internal standards (¹³C₂D₃-acetyl), normalization to total histone or unmodified peptides, dose-response acetylation changes |
| HDAC or HAT complex interactome characterization to identify co-repressor or co-activator complex composition changes upon drug treatment |
Affinity purification-mass spectrometry (AP-MS) of HDAC or HAT complexes using antibody-based or probe-based capture |
Anti-HDAC or anti-HAT antibody pull-down, or activity-based probe pull-down (SAHA-BPyne for HDAC complexes), on-bead trypsin digestion, label-free or TMT-LC-MS/MS quantification, identification of co-repressor/co-activator subunits (CoREST, NuRD, Sin3, NCoR, SMRT for HDACs; p300/CBP-associated factors, STAGA/TFTC for HATs), differential complex composition analysis |
| Acetylome-wide profiling to identify non-histone acetylation substrates and pathways affected by HDAC or HAT modulation |
Acetylated peptide immunoaffinity enrichment (pan-anti-acetyl-Lys antibody) with quantitative LC-MS/MS |
Cell/tissue lysate, trypsin digestion, anti-acetyl-Lys antibody (PTMScan or equivalent) immunoaffinity enrichment, TMT labeling, nanoLC-MS/MS (Orbitrap Fusion Lumos), MaxQuant/Proteome Discoverer with acetylation site localization, differential acetylation analysis, pathway enrichment (KEGG, Reactome), non-histone substrate identification in key signaling pathways |
Integrated Assay Platforms for HDAC and HAT Activity Profiling
Our HDAC/HAT activity assay service portfolio encompasses four complementary platforms — fluorogenic biochemical assays, chemoproteomic activity-based protein profiling, HAT activity assays with multiple readout formats, and global histone acetylation LC-MS/MS quantification — each optimized for specific stages of the epigenetic drug discovery pipeline from target identification through hit validation, lead optimization, and preclinical pharmacodynamic assessment.
Fluorogenic HDAC Activity Assays with Isoform-Selective Substrates for Biochemical Profiling and HTS
For direct, quantitative measurement of HDAC catalytic activity in purified enzyme systems, we offer a comprehensive panel of fluorogenic HDAC activity assays using acetyl-lysine substrates optimized for each HDAC isoform class. The Boc-Lys(Ac)-AMC (N-Boc-ε-acetyl-L-lysine-7-amino-4-methylcoumarin) substrate is the most widely used fluorogenic HDAC substrate: HDAC-mediated deacetylation of the ε-acetyl-lysine generates a free lysine amine, which is then cleaved by trypsin (included in the developer solution) to release the AMC fluorophore, producing fluorescence at 460 nm (excitation 360 nm) that is proportional to HDAC activity. This two-step assay format provides a continuous, real-time readout compatible with high-throughput screening (384-well and 1536-well plate formats, Z′ > 0.7 for optimized assays). For isoform-specific activity profiling, we employ modified substrates with enhanced selectivity: the trifluoroacetyl-lysine substrate (Boc-Lys(Tfa)-AMC) shows improved selectivity for HDAC6 over class I HDACs, while longer peptide-based substrates (Ac-Leu-Lys(Ac)-AMC, Ac-Leu-Gly-Lys(Ac)-AMC) better recapitulate the native sequence context of class I HDAC substrates. Our standard HDAC activity panel includes: class I (HDAC1, HDAC2, HDAC3/NCoR2 co-complex, HDAC8), class IIb (HDAC6, HDAC10), and class IV (HDAC11), with class IIa HDACs (HDAC4/5/7/9) requiring alternative trifluoroacetyl-lysine substrates due to their weak activity against standard acetyl-lysine substrates. All assays include positive controls (trichostatin A, 1 μM; suberoylanilide hydroxamic acid/SAHA, 1 μM), negative controls (DMSO vehicle), and zinc-dependent activity confirmation (EDTA inhibition control) for assay validation.
Chemoproteomic HDAC Activity-Based Protein Profiling for Cellular Target Engagement and Complex Selectivity
For assessing HDAC inhibitor target engagement in physiologically relevant cellular environments — where HDACs exist as components of multi-protein co-repressor complexes (CoREST, NuRD, Sin3, NCoR/SMRT) that modulate their catalytic activity, substrate specificity, and drug accessibility — we offer chemoproteomic HDAC activity-based protein profiling (ABPP) using photoreactive activity-based probes. Our primary probe, SAHA-BPyne (a derivative of suberoylanilide hydroxamic acid containing a benzophenone photo-crosslinker and a terminal alkyne handle), binds to the active site of HDACs through its hydroxamate zinc-chelating warhead, and upon UV irradiation (365 nm, 30 minutes on ice), the benzophenone group forms covalent bonds with proximal amino acids within the HDAC active site and associated co-repressor proteins. Following UV crosslinking, the alkyne handle is conjugated to biotin-azide or TMT-azide via copper-catalyzed azide-alkyne cycloaddition (CuAAC click chemistry), enabling streptavidin pull-down of HDAC complexes and quantitative LC-MS/MS analysis of HDAC isoforms and co-repressor subunits. Competition ABPP — where cells or lysates are pre-treated with an HDAC inhibitor before probe addition — quantifies target occupancy (inhibitor-bound HDACs are blocked from probe labeling and therefore not enriched) and provides a proteome-wide selectivity profile across all expressed HDAC complexes, addressing the critical drug discovery question of which HDAC complexes are engaged by an inhibitor at pharmacologically relevant concentrations. For comprehensive proteomic analysis of PTM enzyme targets, our PTM Enzyme Activity & Inhibitor Screening service provides additional chemoproteomic profiling capabilities across kinase, DUB, and other PTM enzyme classes.
HAT/KAT Activity Assays — Fluorescence and Mass Spectrometry-Based Detection Platforms
For measuring histone acetyltransferase activity — a critical requirement for HAT inhibitor discovery and acetyltransferase mechanistic studies — we offer a panel of biochemical HAT activity assays with multiple readout formats optimized for the major acetyltransferase families. The fluorescence-based HAT assay format uses a coupled enzyme detection system: acetyl-CoA consumption by the HAT enzyme is coupled to the production of CoA-SH, which is detected by a thiol-sensitive fluorophore (7-diethylamino-3-(4′-maleimidylphenyl)-4-methylcoumarin, CPM) or by a coupled enzyme reaction (pyruvate dehydrogenase/NADH detection, λex 340/λem 460 nm), enabling real-time kinetic measurement of HAT activity in a microplate format. For higher sensitivity and direct product detection, we offer a MALDI-TOF MS-based HAT activity assay: the HAT enzyme is incubated with acetyl-CoA and a defined histone H3 or H4 peptide substrate (15–25 amino acids covering known acetylation sites), and the reaction is quenched and spotted on a MALDI target with α-cyano-4-hydroxycinnamic acid (CHCA) matrix for mass spectrometry analysis. Acetylation of the peptide is detected as a +42 Da mass shift corresponding to the addition of an acetyl group, and the percentage of acetylated peptide is quantified from the relative peak intensities of acetylated and unacetylated peptide species. This label-free MS format eliminates the need for radioactive reagents (³H-acetyl-CoA) or antibody-based detection and provides unambiguous structural confirmation of the acetylation site on the peptide substrate. Our HAT activity panel covers the major acetyltransferase families: p300/CBP (EP300 and CREBBP catalytic domains), PCAF/GCN5 (KAT2A/KAT2B), MYST family (Tip60/KAT5, MOZ/KAT6A, MORF/KAT6B, HBO1/KAT7), and HAT1/KAT1, with IC₅₀ determination for HAT inhibitors including C646 (p300/CBP-specific) and anacardic acid (broad-spectrum).
Global Histone Acetylation LC-MS/MS Quantification for Pharmacodynamic Biomarker Assessment
For comprehensive, site-specific quantification of histone acetylation marks — providing a direct readout of the downstream consequences of HDAC or HAT modulation that serves as a pharmacodynamic biomarker in drug development studies — we offer targeted LC-MS/MS quantification of histone acetylation marks using stable isotope-labeled internal standards. Histones are acid-extracted (0.4 N H₂SO₄) from cells or tissues, chemically derivatized by propionylation (to block free amines on unmodified lysines and the N-terminus, enabling distinction between unmodified and acetylated lysines after trypsin digestion), and digested with trypsin to generate peptides of 3–10 amino acids suitable for LC-MS/MS quantification. Analysis is performed by liquid chromatography-parallel reaction monitoring (LC-PRM) on an Orbitrap Q Exactive HF-X or triple quadrupole MRM using scheduled acquisition windows for each acetylated histone peptide. Quantification is achieved by reference to ¹³C₂D₃-acetylated histone peptide internal standards spiked at known concentrations, providing absolute quantification of 30+ acetylation marks per sample with detection limits as low as 0.1% acetylation occupancy. Key acetylation marks quantified include: H3K9ac, H3K14ac, H3K18ac, H3K23ac, H3K27ac (the active enhancer mark), H3K36ac, H3K56ac, H4K5ac, H4K8ac, H4K12ac, H4K16ac, H2AK5ac, H2BK5ac, H2BK12ac, H2BK20ac, and non-histone acetylation from parallel acetylome profiling. Data are reported as percent acetylation at each site, enabling direct comparison across samples without normalization to total histone levels. This platform provides pharmacodynamic biomarker data essential for assessing target engagement and acetylation pathway modulation in preclinical HDAC/HAT inhibitor studies, dose-response and time-course experiments, and translational biomarker measurement in clinical samples.
Why Choose Our HDAC/HAT Activity Assay Service
Integrated HDAC-HAT-Acetylome Platform Under a Single Service Relationship
We offer the only fully integrated HDAC and HAT activity platform that combines biochemical fluorogenic HDAC assays, chemoproteomic HDAC ABPP with quantitative LC-MS/MS, HAT activity assays (fluorescence, MALDI-TOF, and LC-MS), and global histone acetylation LC-MS/MS quantification within a single service provider — eliminating the fragmentation inherent in coordinating biochemical activity measurements with chemoproteomic profiling and acetylation analysis across separate laboratories and ensuring that all data are generated from matched biological samples with consistent experimental conditions.
Comprehensive HDAC Isoform and Complex Coverage
Our HDAC activity platform covers class I (HDAC1/2/3/8), class IIa (HDAC4/5/7/9), class IIb (HDAC6/10), and class IV (HDAC11) using substrate-optimized biochemical assays for each isoform, together with chemoproteomic ABPP that captures HDACs in their native co-repressor complex context (CoREST, NuRD, Sin3, NCoR/SMRT) — providing two orthogonal but complementary selectivity readouts: biochemical isoform selectivity (purified enzyme) and cellular complex selectivity (native HDAC complexes in lysates or live cells).
Orthogonal Readout Formats Across Biochemical, Chemoproteomic, and Proteomic Platforms
Every HDAC or HAT activity measurement is validated through orthogonal readout formats: biochemical fluorogenic results can be cross-validated with chemoproteomic ABPP pull-down LC-MS/MS, HAT activity data from fluorescence-based acetyl-CoA consumption assays are confirmed by MALDI-TOF direct peptide acetylation detection, and global histone acetylation LC-MS/MS data provide the downstream pharmacodynamic context that validates both HDAC and HAT activity measurements at the substrate level — ensuring that activity data are robust, reproducible, and biologically interpretable.
Epigenetic Drug Discovery Expertise with Industry-Standard Tool Compound Validation
Our assay platforms are validated against industry-standard HDAC and HAT tool compounds with known activity and selectivity profiles: HDAC assays are benchmarked against SAHA/vorinostat (pan-HDACi), romidepsin (class I-selective), tubastatin A (HDAC6-selective), PCI-34051 (HDAC8-selective), and entinostat (class I-selective), while HAT assays are validated against C646 (p300/CBP-selective), A-485 (p300/CBP catalytic inhibitor), and anacardic acid (broad-spectrum HATi) — providing a well-characterized reference framework for interpreting customer compound activity and selectivity data.
Workflow: From Research Question to HDAC/HAT Activity-Based Insights
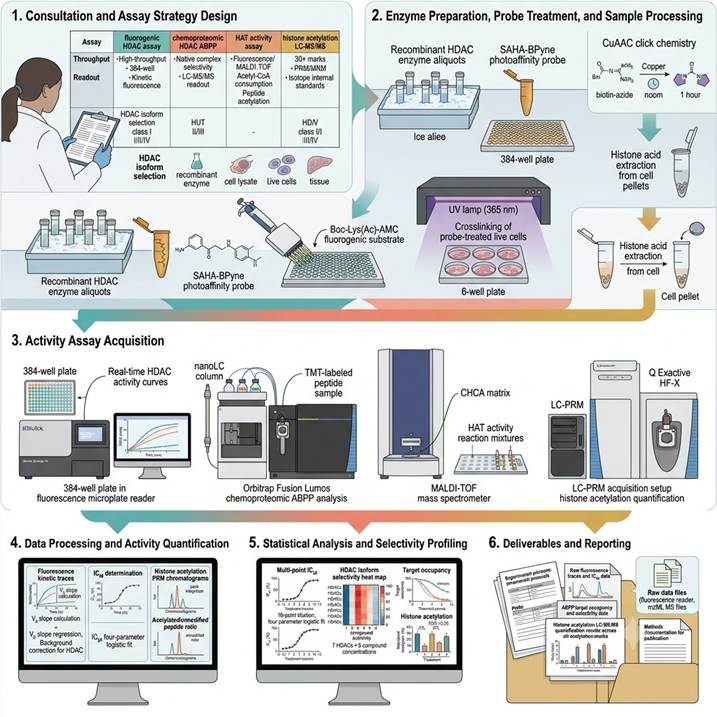
Step 1: Consultation and Assay Strategy Design
We consult with you to define the HDAC/HAT activity assay strategy based on research objective (inhibitor IC₅₀ determination, cellular target engagement, HAT inhibitor screening, pharmacodynamic biomarker assessment), enzyme targets (specific HDAC isoforms, HAT families, or full panel), sample type (recombinant enzyme, cell lysate, live cells, tissue), throughput requirements, and desired readout format (biochemical fluorogenic, chemoproteomic MS, histone acetylation LC-MS/MS). We provide a detailed project proposal with assay design specifications, control strategies, and data analysis plan.
Step 2: Enzyme Preparation, Probe Treatment, and Sample Processing
For biochemical HDAC assays: recombinant HDAC enzymes (full-length or catalytic domain) are prepared and quality-controlled for activity. Fluorogenic substrates (Boc-Lys(Ac)-AMC, trifluoroacetyl-lysine substrates) are prepared at optimized concentrations. For chemoproteomic ABPP: cells or lysates are treated with SAHA-BPyne probe (1–10 μM, ± inhibitor pre-treatment), UV-irradiated (365 nm, 30 min on ice), lysed, and probe-labeled proteins are conjugated to biotin-azide via CuAAC click chemistry. For HAT assays: recombinant HAT enzymes are prepared with acetyl-CoA and histone peptide substrates. For histone acetylation LC-MS/MS: histones are acid-extracted and derivatized.
Step 3: Activity Assay Acquisition
For fluorogenic HDAC assays: kinetic fluorescence readout at 1–5 minute intervals for 30–120 minutes at 37°C in 384-well format (BioTek Synergy H1, Tecan Spark). For chemoproteomic ABPP: biotinylated proteins are captured by streptavidin pull-down, on-bead digested, and analyzed by nanoLC-MS/MS (Orbitrap Fusion Lumos, 120-minute gradient). For HAT assays: fluorescence readout of acetyl-CoA consumption or MALDI-TOF detection of peptide acetylation (+42 Da mass shift). For histone acetylation LC-MS/MS: derivatized histone peptides are analyzed by LC-PRM/MRM with scheduled acquisition of 30+ acetylation marks.
Step 4: Data Processing and Activity Quantification
For fluorogenic assays: initial velocity (V₀) is calculated from the linear phase of fluorescence increase, background-corrected, and expressed as relative activity (% of control) or specific activity. IC₅₀ values are calculated by nonlinear regression (four-parameter logistic fit). For chemoproteomic ABPP: HDACs and co-repressor proteins are identified from MS/MS spectra, and TMT reporter ion intensities or label-free quantification values are used to calculate target occupancy (inhibitor-treated/control ratios). For histone acetylation: extracted ion chromatograms are integrated and acetylated/unmodified peptide ratios are calculated.
Step 5: Statistical Analysis and Selectivity Profiling
For HDAC inhibitor screening: IC₅₀ values with 95% confidence intervals, Z′-factor quality metrics, and selectivity ratios across the HDAC panel (IC₅₀ off-target / IC₅₀ primary target). For chemoproteomic ABPP: target occupancy curves across compound concentrations, proteome-wide HDAC selectivity heat maps showing compound engagement of each HDAC isoform and co-repressor complex. For histone acetylation: dose-response acetylation changes with statistical testing (Moderated t-test, ANOVA with FDR correction) and pathway enrichment for non-histone acetylome data.
Step 6: Deliverables and Reporting
Comprehensive HDAC/HAT activity assay report including: complete experimental protocols with enzyme preparations, substrate specifications, and assay conditions; raw fluorescence traces or MS chromatograms with quality control metrics; quantified activity data with IC₅₀ values, dose-response curves, target occupancy percentages, and HDAC isoform selectivity heat maps; histone acetylation LC-MS/MS quantification with percent acetylation at each site across all samples; and raw data files, analysis parameters, and methods documentation formatted for publication and regulatory reference.
Applications in HDAC/HAT Activity Assay Research
Activity-based HDAC and HAT assays have become indispensable tools in epigenetic drug discovery and basic chromatin biology, providing functional readouts of acetyltransferase and deacetylase activity that inform target identification, hit validation, lead optimization, and pharmacodynamic biomarker assessment across oncology, neurodegeneration, inflammation, and metabolic disease research programs.
HDAC Inhibitor Discovery and Selectivity Profiling for Oncology Drug Development
HDAC inhibitors represent one of the most clinically advanced classes of epigenetic therapies, with four FDA-approved agents (vorinostat/SAHA, romidepsin, panobinostat, belinostat) for hematological malignancies and dozens of clinical-stage compounds targeting solid tumors, neurodegenerative diseases, and inflammatory conditions. However, the therapeutic utility of first-generation pan-HDAC inhibitors is limited by dose-limiting toxicities (thrombocytopenia, fatigue, QTc prolongation) attributed to broad HDAC isoform inhibition. Next-generation HDAC inhibitor development focuses on achieving isoform selectivity — particularly HDAC6-selective inhibitors (to exploit the non-redundant roles of HDAC6 in aggresome processing, immune modulation, and tau deacetylation without the toxicity of class I HDAC inhibition), HDAC8-selective inhibitors (for pediatric cancers including neuroblastoma and AML with HDAC8 mutations), and HDAC11-selective inhibitors (as immune checkpoint regulators). Our integrated HDAC activity platform — combining biochemical isoform panel screening (class I/II/IV, Z′ > 0.7, IC₅₀ determination with 10-point titration) with chemoproteomic ABPP cellular target engagement profiling (proteome-wide selectivity across native HDAC complexes) — provides the orthogonal selectivity data needed to advance isoform-selective HDAC inhibitor programs from hit identification through lead optimization to preclinical candidate selection.
HDAC Activity in Neurodegeneration: Alzheimer's and Parkinson's Disease
HDAC6 has emerged as a promising therapeutic target for neurodegenerative diseases due to its unique domain structure (tandem catalytic domains plus a ubiquitin-binding BUZ domain) and its roles in: α-synuclein aggresome processing and clearance (relevant to Parkinson's disease), tau deacetylation at Lys174 (promoting tau aggregation and neurofibrillary tangle formation in Alzheimer's disease), transport of autophagic vesicles and mitochondria along microtubules (HDAC6 deacetylates cortactin and regulates the cortical actin network), and stress granule dynamics. Our HDAC6-selective activity assays — using the trifluoroacetyl-lysine substrate (Boc-Lys(Tfa)-AMC) that shows >10-fold selectivity for HDAC6 over class I HDACs, and chemoproteomic ABPP with HDAC6-specific probe engagement readout — enable researchers to: (1) screen for HDAC6-selective inhibitors with biochemical IC₅₀ determination; (2) assess HDAC6 target occupancy in neuronal cell models and brain tissue; (3) quantify the effect of HDAC6 inhibition on α-synuclein aggregation and clearance; and (4) measure HDAC6-dependent tau acetylation at Lys174 by targeted LC-MS/MS, providing a direct pharmacodynamic readout of HDAC6 activity in the brain.
HAT Inhibitor Discovery and Mechanistic Characterization for Cancer and Development
Histone acetyltransferases — particularly p300/CBP, PCAF/GCN5, and the MYST family — are dysregulated by mutation, translocation, and altered expression in multiple cancer types. p300/CBP mutations are found in relapsed AML (acquired mutations in the HAT domain conferring resistance to chemotherapy), MOZ/MORF translocations (KAT6A/KAT6B fusions) drive AML through aberrant chromatin acetylation, and p300/CBP overexpression is associated with castration-resistant prostate cancer (where p300 acetylates the androgen receptor to drive ligand-independent activation) and multiple myeloma (where CBP/EP300 are synthetic lethal targets). Our HAT activity assay platform supports the emerging HAT inhibitor discovery field with: (1) biochemical p300/CBP HAT activity assays using acetyl-CoA and histone H3/H4 peptide substrates with fluorescence (coupled enzyme assay) or MALDI-TOF MS readout, validated against reference p300 inhibitors C646 (IC₅₀ ~1 μM) and A-485 (IC₅₀ ~60 nM); (2) selectivity profiling across HAT families (p300/CBP vs. PCAF/GCN5 vs. MYST) to identify family-selective and pan-HAT inhibitors; (3) cellular acetylation target engagement assays measuring H3K18ac and H3K27ac (the direct p300/CBP product marks) by LC-MS/MS after compound treatment; and (4) genome-wide H3K27ac ChIP-seq readout integration for assessing the chromatin-level effects of HAT inhibition on enhancer and super-enhancer landscapes.
Pharmacodynamic Biomarker Assessment of HDAC and HAT Modulators in Preclinical and Translational Studies
Quantification of histone acetylation marks by LC-MS/MS provides a direct, quantitative, and site-specific pharmacodynamic (PD) readout of HDAC and HAT inhibition in cellular and in vivo samples — essential for establishing dose-response relationships, determining the duration of target engagement, and guiding dose selection for efficacy studies. Our targeted histone acetylation LC-MS/MS platform (LC-PRM/MRM with stable isotope internal standards, quantifying 30+ acetylation marks) supports PD biomarker measurement in: (1) time-course studies (acetylation changes at 2, 6, 12, and 24 hours post-dose to establish onset, peak, and duration of pharmacodynamic effect); (2) dose-response studies in tumor xenografts or target tissues (correlating histone acetylation changes with compound exposure and tumor growth inhibition); (3) combination studies (assessing synergistic acetylation changes when HDAC inhibitors are combined with other epigenetic therapies or conventional chemotherapeutics); and (4) clinical sample analysis (quantifying histone acetylation in pre- and post-treatment tumor biopsies, PBMCs, and hair follicles as PD biomarkers in early-phase clinical trials). The site specificity of LC-MS/MS-based acetylation quantification — distinguishing individual marks such as H3K27ac (the direct p300/CBP product), H3K9ac (partially HDAC3-dependent), H4K16ac (the MOF/KAT8 product and HDAC10 substrate), and H3K56ac (the HDAC1/2 substrate linked to DNA damage repair) — provides mechanistic insight beyond what can be achieved by western blot or antibody-based methods, enabling researchers to attribute pharmacodynamic effects to specific HDAC or HAT targets.
Non-Histone Acetylome Profiling: Mapping HDAC and HAT Substrates Beyond Chromatin
A growing body of evidence demonstrates that the acetylation-deacetylation cycle extends far beyond histone proteins, with thousands of non-histone proteins regulated by acetylation in pathways including DNA damage repair (p53 acetylation at K382 by p300/CBP, regulated by HDAC1/SIRT1 deacetylation), metabolism (PGC-1α acetylation by GCN5, deacetylation by SIRT1), cytoskeletal dynamics (α-tubulin acetylation at K40 by ATAT1/MEC17, deacetylation by HDAC6), and signal transduction (STAT3 acetylation at K685 by p300/CBP, deacetylation by HDAC3). Our acetylome-wide profiling platform — using pan-anti-acetyl-Lys antibody enrichment (PTMScan) with TMT-LC-MS/MS — identifies and quantifies 3,000–8,000 acetylation sites per experiment across all cellular compartments, enabling researchers to: (1) discover novel non-histone substrates of specific HDACs or HATs by comparing acetylomes from wild-type vs. enzyme-knockout or inhibitor-treated vs. control cells; (2) map the acetylome-wide consequences of HDAC or HAT inhibitor treatment to identify pathway-level effects and potential toxicity mechanisms; (3) identify acetylation sites on disease-relevant proteins (kinases, transcription factors, oncoproteins, tumor suppressors) that may be modulated by HDAC or HAT inhibitors; and (4) integrate acetylome data with existing phosphoproteomic, ubiquitinomic, and proteomic datasets for multi-omics pathway analysis.
Case Study: Chemoproteomic Target Deconvolution Reveals Histone Deacetylases as Targets of (R)-Lipoic Acid
In a 2023 study published in Nature Communications (CC BY 4.0), Lechner et al. employed a chemoproteomic activity-based target deconvolution strategy to identify the molecular targets of (R)-lipoic acid — a naturally occurring dithiolane compound with established clinical use in diabetic neuropathy and growing interest in neurodegenerative and metabolic disease — revealing that HDACs are the primary physiological targets of (R)-lipoic acid and providing a mechanistic explanation for its cytoprotective effects through HDAC inhibition-mediated stress granule modulation.
Background: (R)-lipoic acid (also known as α-lipoic acid or thioctic acid) is a naturally occurring compound that serves as an essential cofactor for mitochondrial α-ketoacid dehydrogenase complexes (pyruvate dehydrogenase, α-ketoglutarate dehydrogenase). At supraphysiological (pharmacological) concentrations, (R)-lipoic acid has been reported to produce a range of beneficial effects — including antioxidant activity, improvement of insulin sensitivity, reduction of neuropathic pain, and inhibition of stress granule formation — but the molecular targets responsible for these effects remained poorly defined, with many studies attributing them to non-specific antioxidant activity. The authors hypothesized that (R)-lipoic acid's pharmacological effects might be mediated through specific protein targets that could be identified by unbiased chemoproteomic target deconvolution — a strategy combining immobilized ligand affinity matrices with quantitative mass spectrometry and orthogonal biochemical validation — an approach directly relevant to understanding how HDAC activity modulation produces cellular effects.
Approach: The authors synthesized an immobilized (R)-lipoic acid affinity matrix by conjugating (R)-lipoic acid to sepharose beads through a PEG linker, preserving the dithiolane ring structure essential for target binding. The affinity matrix was incubated with HeLa cell lysates in the presence or absence of competing free (R)-lipoic acid or its analog lipoamide, and bound proteins were identified by bottom-up LC-MS/MS (Orbitrap Q Exactive Plus, label-free quantification). Competitive binding (reduced enrichment in the presence of free competitor) distinguished specific from non-specific interactions. This chemoproteomic target deconvolution approach identified HDAC1, HDAC2, HDAC3, HDAC6, HDAC8, and HDAC10 as specific targets of (R)-lipoic acid — with the dithiolane ring, not the carboxylate, being essential for HDAC binding. The target engagement was orthogonally validated by: (1) recombinant HDAC activity assays with fluorogenic acetyl-lysine substrates (Boc-Lys(Ac)-AMC) showing dose-dependent inhibition by (R)-lipoic acid with IC₅₀ values in the low micromolar range (HDAC1 IC₅₀ ~35 μM, HDAC6 IC₅₀ ~50 μM); (2) cellular target engagement by NanoBRET using HDAC-NanoLuc fusion proteins demonstrating that (R)-lipoic acid engages HDACs in living cells at pharmacologically relevant concentrations; and (3) cellular acetylation assays showing increased acetylation of HDAC substrates including α-tubulin K40 (HDAC6 substrate) and DDX3X K118 (HDAC substrate) upon (R)-lipoic acid treatment, confirming functional HDAC inhibition in cells.
Key Findings:
- Chemoproteomic target deconvolution identified HDACs as primary targets of (R)-lipoic acid: The immobilized (R)-lipoic acid affinity matrix combined with quantitative LC-MS/MS identified six HDAC isoforms — HDAC1, HDAC2, HDAC3, HDAC6, HDAC8, and HDAC10 — as the most prominently enriched proteins, with the dithiolane ring being essential for HDAC binding (reduced (R)-dihydrolipoic acid showed significantly weaker binding), providing the first systematic identification of HDACs as molecular targets of a clinically used natural product and demonstrating the power of chemoproteomic target deconvolution for mechanism-of-action studies
- Biochemical and cellular validation by orthogonal HDAC activity assays: Recombinant HDAC activity assays using the fluorogenic Boc-Lys(Ac)-AMC substrate confirmed dose-dependent HDAC inhibition by (R)-lipoic acid with IC₅₀ values in the low micromolar range (HDAC1 35 μM, HDAC2 42 μM, HDAC3 28 μM, HDAC6 50 μM, HDAC8 55 μM), while cellular target engagement by NanoBRET confirmed that (R)-lipoic acid engages HDACs in living cells — together providing a multi-platform validation that chemoproteomic binding, biochemical activity, and cellular engagement are consistent with HDAC inhibition as the primary mechanism of action
- Enantioselective HDAC inhibition by (R)-lipoic acid (not (S)-lipoic acid): Only the naturally occurring (R)-enantiomer of lipoic acid inhibited HDACs at physiologically relevant concentrations, while the (S)-enantiomer was inactive — consistent with the known bioactivity of (R)-lipoic acid but not (S)-lipoic acid in clinical studies, providing a direct molecular explanation for the enantioselectivity of lipoic acid's pharmacological effects and establishing HDAC inhibition as a stereospecific mechanism
- HDAC inhibition by (R)-lipoic acid prevents stress granule formation: (R)-lipoic acid treatment inhibited stress granule formation in cells exposed to arsenite-induced oxidative stress (a standard stress granule induction model) with an EC₅₀ consistent with its HDAC inhibition potency, while the inactive (S)-enantiomer showed no effect — establishing a direct mechanistic link between HDAC inhibition and the cytoprotective effects of (R)-lipoic acid through modulation of stress granule dynamics, a finding with implications for neurodegenerative disease research where aberrant stress granule formation and persistence contribute to pathology in ALS, Alzheimer's, and tauopathies
- HDAC isoform-specific substrate acetylation in cells: (R)-lipoic acid treatment increased acetylation of α-tubulin K40 (a selective HDAC6 substrate) and DDX3X K118 (a broader HDAC substrate), confirming functional HDAC inhibition in cells and providing cellular pharmacodynamic markers for HDAC engagement that can be measured by targeted LC-MS/MS (for α-tubulin K40 acetylation) or immunoblot — demonstrating the feasibility of using cellular acetylation marks as PD biomarkers for HDAC inhibitor activity
Significance: This study established that the clinically used natural product (R)-lipoic acid exerts its pharmacological effects through HDAC inhibition — identified by unbiased chemoproteomic target deconvolution and confirmed by orthogonal biochemical, cellular, and functional assays — demonstrating the critical importance of activity-based HDAC profiling for understanding mechanisms of action, drug repurposing, and natural product pharmacology. The multi-platform approach (chemoproteomic target identification ➔ biochemical HDAC activity assays ➔ cellular target engagement ➔ functional phenotyping) provides a template for HDAC target deconvolution and validation studies that is directly applicable to any HDAC or HAT modulator discovery program. Our service platform incorporates each of these validated methodologies — chemoproteomic ABPP, fluorogenic HDAC activity assays, cellular target engagement, and acetylation LC-MS/MS — as core service offerings for epigenetic drug discovery.
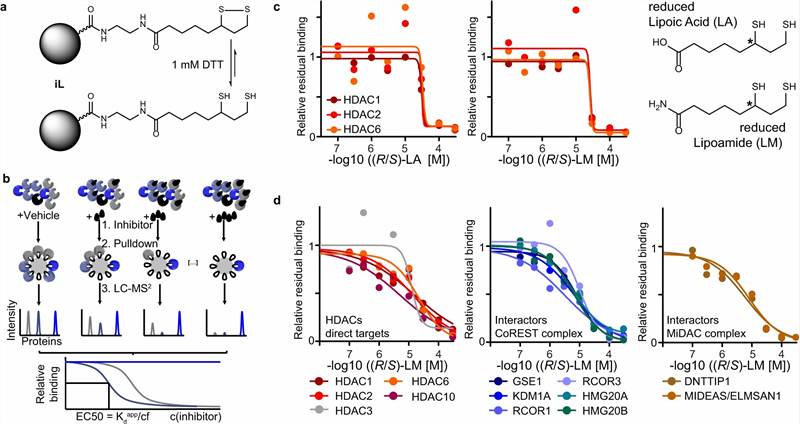
Adapted from Lechner et al. (2023). Chemoproteomic target deconvolution reveals Histone Deacetylases as targets of (R)-lipoic acid. Nature Communications 14:3548. (CC BY 4.0)
Representative Results: HDAC/HAT Activity Assay Performance and Data Outputs
Our HDAC/HAT activity assay platform delivers integrated data packages combining biochemical activity measurements, chemoproteomic target engagement profiling, and histone acetylation quantification for comprehensive functional characterization of HDAC and HAT enzyme activity in epigenetic drug discovery programs.
Platform Performance Specifications
| Performance Parameter |
Fluorogenic HDAC Assay (Boc-Lys(Ac)-AMC) |
Chemoproteomic HDAC ABPP (SAHA-BPyne) |
HAT Activity Assay (Fluorescence/MS) |
Histone Acetylation LC-MS/MS (PRM/MRM) |
| Enzyme/reagent coverage |
Single HDAC per well (isoform panel: 1/2/3/6/8/10/11) |
10+ HDAC isoforms + co-repressor complexes per sample |
p300/CBP, PCAF/GCN5, MYST family, HAT1 |
30+ acetylation marks per sample |
| Readout type |
Real-time fluorescence (kinetic, λex 360/λem 460 nm) |
TMT or label-free LC-MS/MS (protein-level) |
Fluorescence (NADH coupled) or MALDI-TOF MS (+42 Da shift) |
LC-PRM/MRM (peptide-level, site-specific) |
| Throughput |
High (50,000+ compounds/week, 384-well) |
Medium (20–40 samples/week) |
Medium (100–500 compounds/week) |
Low-medium (20–40 samples/week) |
| Z′-factor (typical) |
> 0.7 (optimized assays) |
N/A (MS-based) |
> 0.6 (fluorescence format) |
CV < 15% (technical replicates) |
| Quantification |
V₀ (RFU/min), % activity, IC₅₀ |
Target occupancy (%), fold-enrichment |
% acetylation, V₀ (NADH/min), IC₅₀ |
% acetylation at each site (absolute) |
| Sample requirement |
10–100 ng recombinant HDAC per well |
0.5–5 mg lysate per condition |
50–200 ng recombinant HAT per assay |
1–10 × 10⁶ cells or 10–50 mg tissue |
| Selectivity readout |
Panel IC₅₀ ratios across HDAC isoforms |
Proteome-wide HDAC complex selectivity |
HAT family selectivity (p300 vs. PCAF vs. MYST) |
Site-specific acetylation profile (30+ marks) |
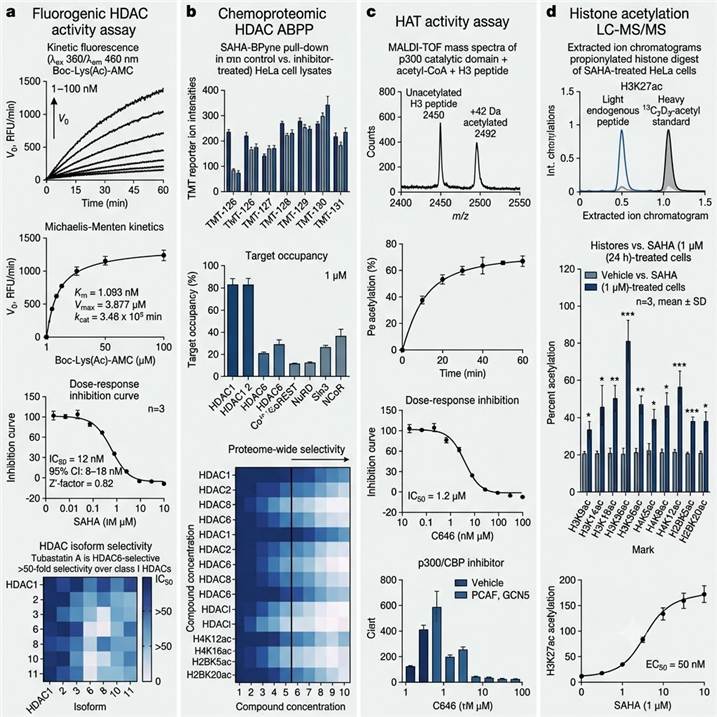
Representative data outputs from our HDAC/HAT Activity Assay platform. Far left: Fluorogenic HDAC activity assay with IC₅₀ and isoform selectivity. Center-left: Chemoproteomic HDAC ABPP with target occupancy and complex selectivity. Center-right: HAT activity assay by MALDI-TOF MS and fluorescence. Far right: Histone acetylation LC-MS/MS quantification across 30+ marks.
Key data deliverables included in every HDAC/HAT activity assay project:
- Biochemical fluorogenic HDAC assay data package — Raw fluorescence traces, V₀ values, IC₅₀ curves with 95% confidence intervals, Z′-factor quality metrics, and HDAC isoform selectivity ratios for each tested compound, with raw data files in standard plate-reader format
- Chemoproteomic HDAC ABPP data package — Complete list of all detected HDAC isoforms and co-repressor complex proteins with MS/MS identification scores, target occupancy percentages at each compound concentration, HDAC complex selectivity heat maps, and raw MS data in mzML format
- HAT activity assay data package — MALDI-TOF mass spectra with acetylated/unacetylated peptide ratios, fluorescence kinetic traces with acetyl-CoA consumption V₀ values, IC₅₀ curves with confidence intervals, and HAT family selectivity data
- Histone acetylation LC-MS/MS quantification data package — Percent acetylation at each of 30+ sites for all samples with stable isotope internal standard normalization, with dose-response and time-course acetylation changes, statistical testing results, and raw LC-MS data files
- Methods documentation — Complete protocols for enzyme preparations, substrate specifications, probe synthesis, assay conditions, LC-MS acquisition parameters, and data analysis methods, formatted for publication methods sections and regulatory reference
Related Services
Our HDAC/HAT activity assay platform is part of a comprehensive epigenetic drug discovery service portfolio spanning PTM enzyme activity profiling, acetylomics, and proteomics-based characterization for oncology, neurodegeneration, and targeted protein degradation research programs.
- PTM Enzyme Activity & Inhibitor Screening — Comprehensive PTM enzyme activity profiling and small-molecule inhibitor screening across kinase, DUB, HDAC, and other PTM enzyme classes with biochemical, chemoproteomic, and cell-based assay platforms
- Acetylomics Analysis — Global acetylated peptide identification and quantification by LC-MS/MS for comprehensive profiling of the acetylome in any biological system
- DUB and Ubiquitin Enzyme Activity Assays — Activity-based DUB and ubiquitin enzyme profiling for PROTAC and targeted protein degradation research
- Kinase Activity Profiling — Activity-based kinase profiling and inhibitor selectivity screening using multiplexed MS-based and biochemical assay platforms
- Histone PTM Analysis — Comprehensive mass spectrometry-based characterization of histone post-translational modifications including acetylation, methylation, phosphorylation, and crotonylation
- Epigenetic PTM Research — Integrated mass spectrometry services for epigenetic modification analysis covering histone marks, DNA modifications, and chromatin-associated PTMs
- MS-Based PTM Analysis — General mass spectrometry-based PTM analysis platform supporting bottom-up, middle-down, and top-down approaches for comprehensive modification characterization
FAQs
What is the difference between HDAC and HAT activity assays?
HDAC activity assays measure the deacetylase activity of histone deacetylases — the removal of acetyl groups from acetyl-lysine residues on histone and non-histone proteins. The standard format uses a fluorogenic acetyl-lysine substrate (Boc-Lys(Ac)-AMC or similar): HDAC-mediated deacetylation generates a free lysine amine that is cleaved by trypsin in a developer solution to release a fluorescent AMC signal (λex 360/λem 460 nm), which is proportional to HDAC activity. HAT/KAT activity assays measure the acetyltransferase activity of histone acetyltransferases — the transfer of an acetyl group from acetyl-CoA to a lysine residue on a protein substrate. HAT assays use formats including radioactive detection (³H-acetyl-CoA incorporation into histones), fluorescence-based detection (acetyl-CoA consumption coupled to NADH production), and label-free mass spectrometry detection (MALDI-TOF or LC-MS measurement of the +42 Da mass shift on acetylated peptides). While both assay types measure acetylation-related enzyme activity, they use different substrates, detection principles, and assay formats reflecting the different catalytic mechanisms of HDACs (hydrolytic deacetylation) and HATs (acyltransferase).
What HDAC isoforms can be profiled by your fluorogenic activity assays?
Our fluorogenic HDAC activity panel covers class I (HDAC1, HDAC2, HDAC3/NCoR2 co-complex, HDAC8), class IIb (HDAC6, HDAC10), and class IV (HDAC11) using the Boc-Lys(Ac)-AMC or trifluoroacetyl-lysine (Boc-Lys(Tfa)-AMC) substrate with optimized assay conditions (enzyme concentration, substrate concentration, incubation time, and developer composition) for each isoform. Class IIa HDACs (HDAC4/5/7/9) possess intrinsically weak deacetylase activity against standard acetyl-lysine substrates due to a tyrosine-to-histidine substitution in the active site that reduces catalytic efficiency; we assay class IIa HDACs using the trifluoroacetyl-lysine substrate (Boc-Lys(Tfa)-AMC), which shows improved sensitivity for these isoforms. For class III HDACs (the NAD⁺-dependent sirtuins SIRT1-7), we offer a separate sirtuin activity assay platform using the acetyl-lysine-AMC substrate with NAD⁺ as a cofactor and a different assay buffer system. The sirtuin activity assays are available as a complementary service on request.
How does chemoproteomic HDAC ABPP differ from biochemical HDAC activity assays?
Biochemical HDAC activity assays use purified recombinant HDAC enzymes in a defined buffer system with a fluorogenic substrate, providing a direct, controlled, and high-throughput readout of catalytic activity against a simple substrate. These assays are ideal for compound IC₅₀ determination, structure-activity relationship studies, and high-throughput screening, but they do not recapitulate the native cellular environment where HDACs exist as components of multi-protein co-repressor complexes (CoREST, NuRD, Sin3, NCoR/SMRT). These complexes modulate HDAC catalytic activity, substrate specificity, and drug accessibility — a compound that appears selective for HDAC1 in a biochemical assay may show different selectivity when HDAC1 is in its native CoREST or NuRD complex context. Chemoproteomic HDAC ABPP addresses this gap by using cell-permeable photoreactive activity-based probes (SAHA-BPyne) that bind to HDAC active sites in live cells or native lysates, capture HDACs and their associated co-repressor proteins by UV-crosslinking, and enable quantitative LC-MS/MS analysis of which HDAC complexes are engaged by a drug. Biochemical assays tell you what a compound can do to purified HDACs; chemoproteomic ABPP tells you what a compound actually does to HDAC complexes in cells. Both are essential in drug discovery, and we offer both platforms in an integrated workflow.
What sample types are compatible with HDAC activity assays?
Sample compatibility depends on the assay format. For biochemical fluorogenic HDAC assays: purified recombinant HDAC enzyme (10–100 ng per well in 384-well format), supplied as purified full-length or catalytic domain protein from baculovirus or E. coli expression systems. For chemoproteomic HDAC ABPP with SAHA-BPyne: fresh or flash-frozen cell pellets (1–10 × 10⁶ cells per condition), tissue biopsies (10–50 mg), or tumor specimens, lysed in ABPP-compatible buffer. For HAT activity assays: purified recombinant HAT enzyme (50–200 ng per assay), supplied as purified catalytic domain. For histone acetylation LC-MS/MS: cell pellets (1–10 × 10⁶ cells), tissue biopsies (10–50 mg), or sorted cell populations (5 × 10⁵ minimum for acid extraction), flash-frozen and stored at −80°C. For cellular HDAC target engagement (NanoBRET or ABPP): live adherent or suspension cells (> 90% viability, 2–10 × 10⁶ cells per condition). For non-histone acetylome profiling: cell pellets (5–20 × 10⁶ cells per IP), tissue (50–200 mg), or sorted cell populations, with or without HDAC/HAT inhibitor pre-treatment to modulate acetylation levels.
Can you measure HAT activity by mass spectrometry?
Yes — label-free MALDI-TOF MS-based HAT activity detection is one of our core HAT assay formats, offering several advantages over radioactive (³H-acetyl-CoA) or fluorescence-based (coupled enzyme) detection. In this format, recombinant HAT enzyme is incubated with acetyl-CoA (typically 1–50 μM) and a defined histone H3 or H4 peptide substrate (15–25 amino acids, covering one or more known acetylation sites) in optimized buffer conditions. The reaction is quenched at defined time points (typically 5–30 minutes) by addition of 0.1% trifluoroacetic acid or by heat denaturation, desalted by C18 ZipTip, and spotted on a MALDI target with α-cyano-4-hydroxycinnamic acid (CHCA) matrix for MALDI-TOF MS analysis in positive ion reflector mode. Acetylation of the peptide is detected as a +42.0106 Da mass shift from the unacetylated peptide mass, corresponding to the addition of an acetyl group (C₂H₂O). The percent acetylation is calculated from the relative peak intensities of the unacetylated and acetylated peptide species. This label-free MS format eliminates the need for radioactive reagents, provides unambiguous structural confirmation of the acetylation site, and enables simultaneous detection of multiple acetylation events on the same peptide (sequential acetylation). Coupling MALDI-TOF detection with a liquid handler enables automated sample spotting and analysis for medium-throughput HAT inhibitor screening (100–500 compounds per week). For higher throughput, we also offer the fluorescence-based acetyl-CoA consumption assay in 384-well format.
How do you distinguish HDAC isoform-selective inhibition from pan-HDAC inhibition?
Distinguishing isoform-selective from pan-HDAC inhibition requires two complementary approaches that we provide in an integrated platform: (1) biochemical isoform panel screening, where the compound is tested against each purified recombinant HDAC isoform (class I: HDAC1/2/3/8, class IIb: HDAC6/10, class IV: HDAC11) in the fluorogenic Boc-Lys(Ac)-AMC assay at 10 concentrations (1 nM–100 μM, 3-fold serial dilution), and IC₅₀ values are calculated for each isoform. A selectivity ratio is calculated as IC₅₀(off-target) / IC₅₀(primary target), with ratios > 10-fold indicating good selectivity, > 50-fold indicating high selectivity, and > 100-fold indicating exceptional selectivity. (2) Chemoproteomic ABPP target occupancy profiling, where the compound is tested across 10 concentrations against native HDAC complexes in cell lysates using SAHA-BPyne competition ABPP with quantitative LC-MS/MS. This reveals the selectivity profile at the complex level — e.g., a compound may show biochemical selectivity for HDAC1 over HDAC2 (both purified), but in cells, HDAC1 exists in at least three distinct co-repressor complexes (CoREST, NuRD, Sin3) while HDAC2 is in NuRD and Sin3 but not CoREST — and a compound's occupancy may differ across these complexes due to differential accessibility. An isoform-selective HDAC inhibitor shows > 10-fold selectivity window over at least 5 of 7 panel isoforms in biochemical assays AND > 10-fold selectivity window over at least 5 HDAC complexes in cellular ABPP, while a pan-HDAC inhibitor shows IC₅₀ values within 3-fold across all panel isoforms and > 80% occupancy of all HDAC complexes at 1 μM.
How do HDAC/HAT activity assays support epigenetic drug discovery programs?
HDAC/HAT activity assays support epigenetic drug discovery at multiple stages of the pipeline. In target identification and validation, activity-based chemoproteomic profiling (SAHA-BPyne ABPP) can identify which HDAC complexes are dysregulated in disease versus normal tissue, revealing the most relevant HDAC targets for a given indication. In hit identification, biochemical fluorogenic HDAC assays enable high-throughput screening (50,000+ compounds/week, 384-well format, Z′ > 0.7) to identify new HDAC inhibitor scaffolds, while HAT assays (MALDI-TOF or fluorescence) support medium-throughput screening for HAT inhibitors. In lead optimization, the HDAC isoform selectivity panel provides quantitative IC₅₀ values across all zinc-dependent HDACs, enabling medicinal chemists to optimize isoform selectivity by modifying compound structure, while chemoproteomic ABPP reveals whether selectivity in biochemical assays translates to selective target engagement in cellular HDAC complexes. In pharmacodynamic assessment, histone acetylation LC-MS/MS quantification provides a direct, site-specific readout of target engagement in preclinical animal studies and clinical samples — H3K27ac and H3K18ac for p300/CBP HAT inhibition, H3K9ac for class I HDAC inhibition, H3K56ac for HDAC1/2 inhibition, and α-tubulin K40ac for HDAC6 inhibition — enabling PK-PD correlation and dose selection. Throughout these stages, our integrated platform enables epigenetic drug discovery programs to directly connect enzyme activity measurements with target engagement data and pharmacodynamic acetylation readouts in a single, coordinated workflow.
References
- Lechner S, Steimbach RR, Wang L, Deline ML, Chang YC, Fromme T, Klingenspor M, Matthias G, Miller AK, Médard G, Kuster B. Chemoproteomic target deconvolution reveals Histone Deacetylases as targets of (R)-lipoic acid. Nature Communications. 2023;14:3548.
- van Tol BDM, et al. Neutron-encoded diubiquitins to profile linkage selectivity of deubiquitinating enzymes. Nature Communications. 2023;14:1661.
- Barroso-Gomila O, et al. BioE3 identifies specific substrates of ubiquitin E3 ligases. Nature Communications. 2023;14:1556.
For research use only. Not for use in diagnostic procedures.