PRM for PTMs: Why High-Resolution Targeted MS Outperforms SRM/MRM
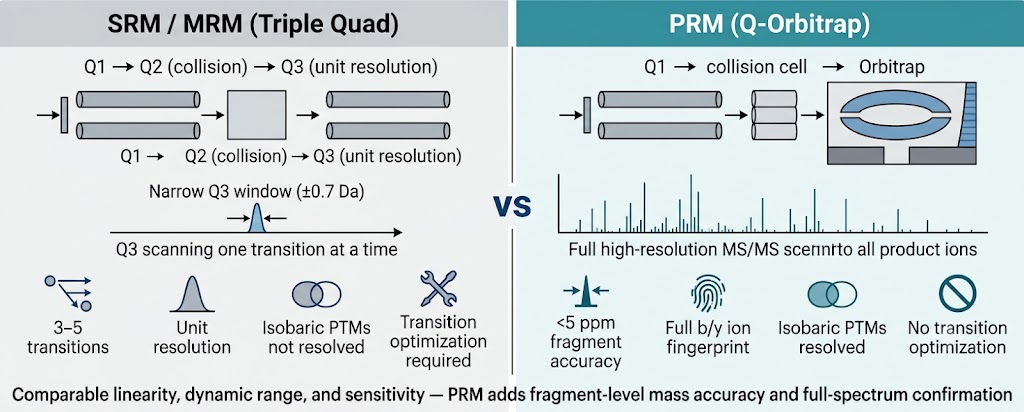
Targeted PTM quantification by mass spectrometry can be performed with either SRM/MRM (on triple-quadrupole instruments) or PRM (on Q-Orbitrap or Q-TOF platforms). Both approaches share the core principle of selecting a defined modified precursor ion for fragmentation, but they differ fundamentally in detection strategy — and those differences matter significantly for PTM applications.
How PRM Works
In a PRM experiment, the quadrupole (Q1) isolates the target precursor ion (typically an m/z window of ≤2 Da). The selected precursor is fragmented by high-energy collisional dissociation (HCD) in the collision cell. All product ions generated from that precursor are then detected simultaneously — in parallel — by the high-resolution Orbitrap analyzer, generating a complete MS/MS spectrum at each scheduled retention time point. Software (Skyline, EncyclopeDIA, or equivalent) then extracts the peak areas of defined product ions from these full spectra for quantification.
The result is that every PRM data point provides: (1) the full fragment ion fingerprint confirming peptide identity and modification localization; (2) multiple quantifier and qualifier ions from the same spectrum; and (3) sub-ppm mass accuracy on every product ion — distinguishing the target modified peptide from isobaric interference that would confound a unit-resolution SRM transition.
Why This Matters for PTM Quantification
PTM-modified peptides face three specific challenges that make PRM superior to SRM/MRM for targeted quantification:
Isobaric modifications: Multiple PTMs can produce nominally identical mass shifts at the peptide level — for example, acetylation (+42.011 Da) and trimethylation (+42.047 Da) are only 36 mDa apart. Unit-resolution SRM transitions cannot distinguish them; PRM at Orbitrap resolution (≥17,500 FWHM at MS/MS level) cleanly resolves them, ensuring that your quantification signal corresponds to the correct modification.
Modification site localization at the targeted level: For multiply phosphorylated peptides, SRM transitions may not unambiguously confirm which residue carries the monitored phosphate. PRM's full fragment ion spectrum provides site-localizing b- and y-ions across the peptide backbone — confirming that the monitored modification is at the intended residue, not an isomeric site on the same peptide.
Complex matrix interference: In complex biological samples (plasma, tissue lysate, enriched PTM fractions), co-eluting peptides with similar precursor m/z can generate interfering SRM signals that inflate or distort apparent intensities. Sub-ppm Orbitrap mass accuracy filters these interferences at the fragment level — delivering interference-free quantification even in complex enriched samples without requiring ultra-high-resolution LC separation.
PRM vs SRM/MRM — Head-to-Head Comparison for PTM Applications
| Parameter |
PRM (Q-Orbitrap) |
SRM/MRM (Triple Quad) |
| Mass accuracy (MS/MS) |
<5 ppm (Orbitrap) — resolves isobaric PTMs |
Unit resolution (~0.7 Da) — cannot resolve isobaric PTMs |
| Product ion detection |
All product ions in parallel — complete fragment fingerprint |
3–5 pre-selected transitions only — no fingerprint confirmation |
| Modification site localization |
Full b/y ion series — unambiguous residue assignment |
Limited — dependent on chosen transitions, often ambiguous |
| Method development |
Minimal — no transition optimization; post-acquisition ion selection in Skyline |
Extensive — each transition must be individually optimized |
| Throughput (sites/run) |
Typically 50–200 sites per run (scheduled PRM) |
200–500 transitions per run — more targets in narrow windows |
| Sensitivity |
Low attomole–femtomole; comparable to SRM for most PTM applications |
Low attomole–femtomole; marginally higher for very simple matrices |
| Isobaric interference rejection |
Excellent — Orbitrap resolution eliminates most interferences |
Limited — unit resolution accepts all co-eluting ions at ±0.7 Da |
| Best for PTM verification |
Complex matrices, isobaric modifications, site-localization confirmation |
Simple matrices, very high-throughput panels where unit resolution is sufficient |
Discovery → Verification → Validation: The Complete PTM Research Pipeline
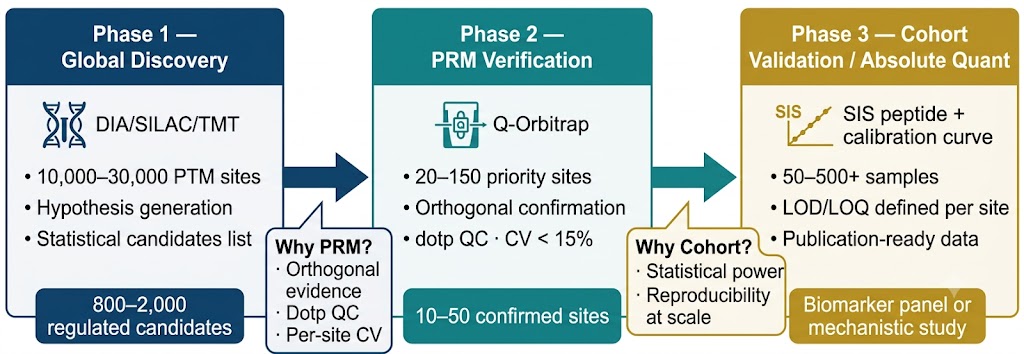
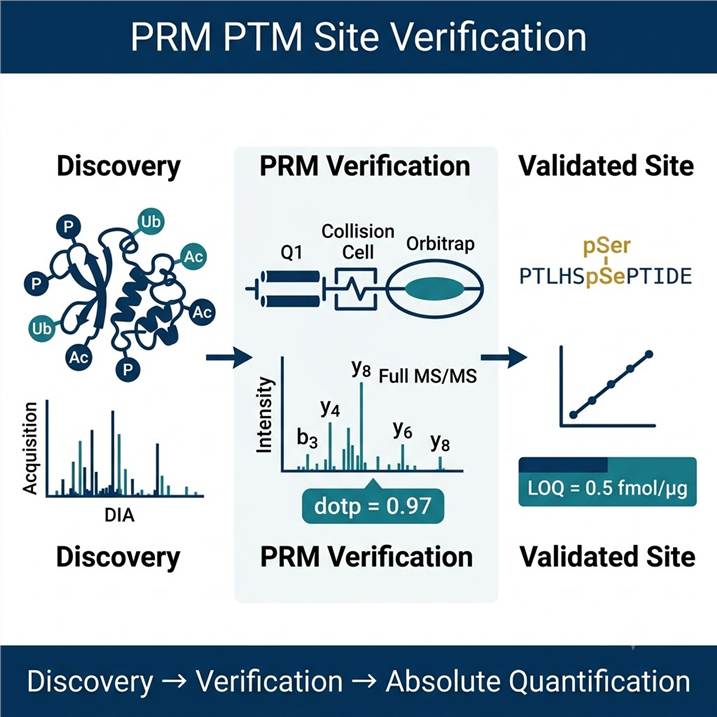
PRM PTM verification occupies a specific and irreplaceable position in the PTM research pipeline — it is the bridge between unbiased discovery and confident, reproducible biological conclusions. Understanding where PRM fits — and where it does not — is essential for designing a productive PTM research program.
Phase 1: Global Discovery
Global PTM discovery by DIA, SILAC, TMT, or label-free proteomics generates a comprehensive, unbiased inventory of modification sites and their relative abundance across conditions. A DIA phosphoproteomics experiment might identify 15,000–30,000 phosphosites, of which 800–2,000 are statistically significantly regulated. This is the hypothesis-generation phase — rich in breadth, but with individual site confidence limited by the statistical thresholds that any discovery experiment applies to thousands of simultaneous comparisons.
Output of Phase 1: A ranked list of candidate regulated PTM sites with fold-change, localization probability, and statistical significance — typically 20–500 sites that pass discovery-phase thresholds and are prioritized for verification.
Phase 2: PRM Site Verification
PRM verification targets the top-ranked candidates from Phase 1 — typically 20–150 priority sites — in an independent experiment using either the same samples (technical confirmation) or new biological replicates (biological confirmation). For each target site, a scheduled PRM method monitors the modified precursor ion and collects full MS/MS spectra at the expected retention time. Product ion peak areas are extracted in Skyline and compared between conditions.
PRM verification serves three functions that discovery data alone cannot provide: it confirms that the regulated signal was not a stochastic sampling artifact of DDA or a library-matching false positive in DIA; it provides orthogonal evidence independent of the discovery software pipeline; and it generates quantitative data with explicitly characterized precision (inter-replicate CV) and selectivity (fragment ion interference check) for every monitored site.
Output of Phase 2: A verified, reduced site list — typically 10–50 sites that pass both discovery and PRM confirmation thresholds — with known quantitative performance metrics for each site assay.
Phase 3: Cohort-Scale Validation & Absolute Quantification
Verified sites that represent high-value biomarker candidates or mechanistic regulatory nodes are taken into large-cohort PRM studies or absolute quantification assays. Cohort-scale PRM applies the verified assay (with the same transition list, retention time calibration, and data extraction settings) across 50–500+ samples — enabling statistical comparison of modification levels across disease stages, treatment arms, or patient subgroups. Absolute quantification using heavy isotope-labeled SIS standard peptides co-spiked into each sample provides molar concentrations, site occupancy percentages, and LOD/LOQ values — the assay performance data required for biomarker publications and translational research programs.
Output of Phase 3: Quantitative PTM measurements across a defined cohort with statistical confidence, defined assay performance, and — where SIS standards are included — absolute site concentration or occupancy values in defined units.
When to Use PRM — Decision Framework
✅ Confirming discovery-phase candidates
You have a DIA, SILAC, or TMT discovery dataset identifying regulated PTM sites and need orthogonal, high-confidence verification before investing in mechanistic follow-up experiments or publishing the findings.
✅ Monitoring defined sites across a cohort
You have a defined set of 10–150 PTM sites of biological or clinical research interest and need to quantify them reproducibly across 50–500+ samples — more efficiently than global discovery workflows allow.
✅ Absolute quantification & stoichiometry
You need to know not just whether a site changes, but the actual molar concentration or fractional stoichiometry of modification — requiring a SIS peptide-based calibration curve with defined LOD/LOQ per site.
✅ Isobaric or closely spaced modifications
Your modification of interest is isobaric with another PTM (acetylation vs. trimethylation; phosphorylation vs. sulfation at peptide level), making triple-quad SRM/MRM unreliable — requiring Orbitrap mass accuracy to discriminate correctly.
✅ Low-abundance PTMs in complex matrices
The modification of interest is present at very low stoichiometry in a complex matrix (plasma, CSF, tissue) where global discovery sensitivity is insufficient — PRM with optional enrichment pre-step provides dramatically improved sensitivity for defined sites.
✅ Drug pharmacodynamic studies
You need to monitor 10–50 defined phosphorylation, ubiquitylation, or acetylation sites as pharmacodynamic markers of drug target engagement or pathway inhibition — across multiple dose levels, time points, or preclinical model systems.
❌ First-pass global discovery
If you have no prior knowledge of which sites are modified or regulated, PRM is not appropriate — use global discovery workflows (Global PTM Profiling or modification-specific DIA quantification) first to generate your site list.
❌ >200 simultaneous novel sites
When more than 200 sites must be quantified simultaneously and none has been previously verified in your sample matrix, a DIA global approach provides better coverage per unit cost. PRM is optimal when the target site list is focused and defined.
Our PRM PTM Services
PRM PTM Site Verification
Targeted confirmation of PTM sites identified in discovery-phase experiments. We develop a scheduled PRM method for your priority site list, acquire data in independent biological replicates or new cohort samples, extract product ion peak areas in Skyline, and confirm regulation status with inter-replicate CV, fold-change, and statistical testing per site. Suitable for confirming 10–150 sites from DIA/SILAC/TMT discovery datasets.
Input required: Discovery dataset (protein ID, modification type, modified residue, charge state) + sample type and quantity per replicate.
Deliverables: Skyline project file, peak area extraction tables, chromatographic traces for each monitored site, per-site CV, fold-change confirmation table, project report.
PRM + SIS Peptide Absolute Quantification
Absolute molar quantification of defined modified peptides using co-spiked heavy isotope-labeled (SIS) standard peptides. SIS peptides are chemically identical to the target modified peptide except for heavy isotopes on one or more residues (typically 13C/15N on C-terminal Lys or Arg), producing a fixed mass shift that allows direct ratio-based absolute quantification from the same LC-MS/MS injection. Calibration curves, LOD, LOQ, linearity range, and inter-assay CV are established per site.
Best for: Phosphorylation stoichiometry, ubiquitylation site copy number, histone mark occupancy, any application requiring quantities in fmol/μg protein or copies per cell.
SIS peptide sourcing: We work with established synthesis providers; synthesis lead time is typically 3–5 weeks and must be factored into project timelines.
PRM Cohort-Scale PTM Monitoring
Application of a verified PRM assay across a large sample cohort (50–500+ samples). Once the PRM method has been validated for sensitivity, selectivity, linearity, and inter-replicate reproducibility in the assay development phase, it is deployed across the full cohort with automated sample preparation (where feasible), batch-controlled SIS standard addition, and Skyline-based automated data extraction. Statistical analysis across cohort groups is provided as part of deliverables.
Applications: Biomarker panel validation across disease stage cohorts; pharmacodynamic biomarker monitoring in drug studies; longitudinal modification profiling in patient samples.
Enrichment-Coupled PRM
For low-stoichiometry modifications in complex matrices (plasma, CSF, dilute biofluids), PRM alone may not provide sufficient sensitivity for detection without prior enrichment. We offer PRM preceded by modification-specific enrichment — IMAC phosphopeptide enrichment, diGLY antibody IP for ubiquitylation sites, or lectin affinity for glycosylation — concentrating the target modified peptides before the targeted MS/MS acquisition. This combination extends PRM sensitivity to the low attomole range for low-abundance PTM sites in demanding matrices.
Multiplexed PTM-PRM Panel Development
Development and optimization of a multi-modification PRM panel covering sites from more than one modification type in the same LC-MS/MS run — for example, simultaneous monitoring of phosphorylation and ubiquitylation sites on the same protein, or a signaling panel covering phosphosites across kinase pathway members alongside corresponding protein abundance peptides for normalization. Panel development includes retention time calibration with iRT peptide standards, interference testing, and dynamic exclusion optimization for maximum per-site sensitivity within the multiplexed method.
PRM for Drug Target Engagement & Pharmacodynamics
Targeted monitoring of modification-site pharmacodynamic biomarkers — phosphorylation events directly downstream of a kinase inhibitor target, ubiquitylation events induced by a PROTAC degrader, or acetylation changes caused by HDAC inhibitor treatment — as quantitative evidence of drug target engagement and pathway modulation. PRM pharmacodynamic panels are particularly valuable in preclinical model systems (cell lines, xenografts, PDX models) where the same panel can be applied across dose levels, time points, and treatment arms within a single validated assay.
PRM PTM Verification Workflow
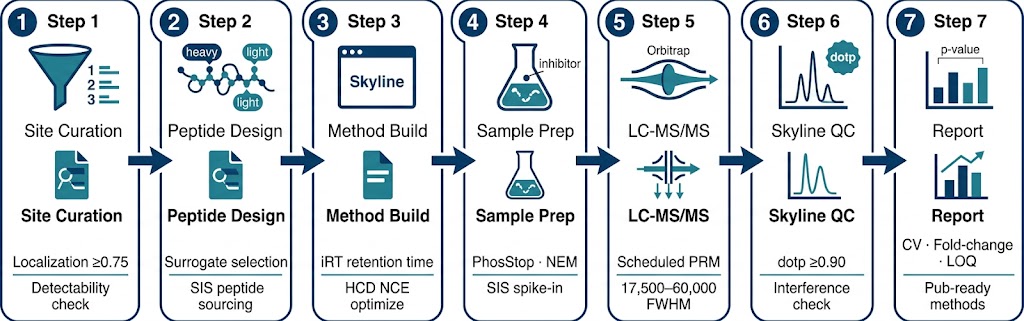
Step 1 — Target Site List Curation
We review your discovery dataset — whether from a DIA, SILAC, TMT, or label-free experiment — and apply prioritization criteria to define the PRM target list. Priority criteria include: site localization probability (≥0.75 required; ≥0.90 preferred), fold-change magnitude, adjusted p-value, biological relevance (PhosphoSitePlus annotation, proximity to known functional domains), and detectability score (expected signal based on peptide physicochemical properties). Sites failing detectability criteria — missed-cleavage peptides longer than 30 amino acids, peptides with multiple Cys residues, or very hydrophobic peptides — are flagged for alternative peptide design before method entry.
Step 2 — Surrogate Peptide Selection & SIS Sourcing
For each target site, surrogate modified peptides are selected: the tryptic peptide carrying the modification at the verified residue, optimized for LC retention time spread, predicted signal intensity, and absence of common polymorphisms. For projects requiring absolute quantification, heavy isotope-labeled SIS standard peptides incorporating 13C6/15N2 on C-terminal Lys (or 13C6/15N4 on Arg) are specified and ordered from synthesis partners (typical purity ≥95%; quantity sufficient for calibration curve preparation). For relative-only verification projects, SIS peptides are replaced by light synthetic peptides for retention time anchoring.
Step 3 — PRM Method Development
A scheduled PRM method is built in Skyline using predicted retention times (calibrated against an iRT reference standard run on your specific column and gradient). Precursor isolation windows are set at m/z ≤2; HCD collision energy is optimized per charge state and modification type (typically 27–30 NCE for phosphopeptides; higher NCE for ubiquitin GG-modified peptides). For enrichment-coupled PRM, the enrichment step (IMAC or diGLY IP) is standardized and spiked with a QC standard before each sample to confirm enrichment efficiency. A pilot injection of the synthetic peptide mixture confirms retention time assignments and resolves any co-elution conflicts before biological sample analysis begins.
Step 4 — Sample Preparation
Biological samples are processed using the same or matched protocol as the discovery experiment — maintaining consistent lysis conditions, digestion protocol, and modification-stabilizing reagents (phosphatase inhibitors for phospho, NEM for ubiquitylomics). For SIS-spiked projects, heavy SIS peptides are added at a defined concentration to each sample immediately after trypsin digestion and before C18 desalting, ensuring that SIS and endogenous modified peptides experience identical downstream processing. Sample amounts: typically 50–200 μg total protein per sample for direct-injection PRM; 1–5 mg per sample for enrichment-coupled PRM.
Step 5 — LC-MS/MS Acquisition
PRM data is acquired on a Thermo Q Exactive HF-X or Orbitrap Fusion Lumos in scheduled PRM mode. Method settings: MS2 Orbitrap resolution 17,500–60,000 FWHM (resolution matched to required mass accuracy for isobaric PTM discrimination); AGC target 2×10⁵; maximum fill time 100 ms; isolation window 2 Da; HCD at optimized NCE. iRT calibration peptides are included in every injection to confirm retention time stability. A pooled QC sample (equal aliquots from all study samples) is injected at the start, middle, and end of the analytical batch to confirm assay stability across the run.
Step 6 — Skyline Data Analysis & QC
PRM data is imported into Skyline for automated peak integration, interference detection, and quantitative extraction. Per-site QC criteria: dot product (dotp) ≥0.9 between observed and reference fragment ion ratios (confirming peptide identity and absence of co-elution interference); peak shape symmetry; chromatographic retention time within ±0.5 min of the expected window. Sites failing dotp QC are flagged and manually inspected — transitions showing interference are excluded from the quantification ion set. For SIS-based projects, the light/heavy peak area ratio for each site across all samples is exported and used to calculate absolute concentrations against the calibration curve.
Step 7 — Statistical Analysis & Deliverables
Normalized peak areas (or absolute concentrations for SIS projects) are compared between conditions by t-test or ANOVA with Benjamini-Hochberg FDR correction. Results are reported per site with: fold-change, p-value, adjusted p-value, inter-replicate CV, and confirmation status (verified / not confirmed / insufficient signal). For sites confirmed as regulated by PRM, we provide confirmation of the discovery-phase result, the PRM quantitative data as independent evidence, and — where relevant — comparison of PRM fold-change with discovery fold-change to assess discovery accuracy. Deliverables: Skyline project files, peak area extraction tables, per-site chromatographic trace figures, calibration curves (SIS projects), statistical results summary, and a comprehensive project report.
Sample Requirements
| Application |
Sample Type |
Minimum Input per Sample |
Notes |
| PRM verification (direct injection, phospho) |
Cell lysate, tissue lysate, pre-extracted protein |
50–100 μg total protein |
Include phosphatase inhibitors in lysis buffer; provide protein concentration measurement (BCA) |
| Enrichment-coupled PRM (phospho, IMAC) |
Cell lysate, tissue, plasma |
500 μg–2 mg total protein per sample |
Higher input compensates for enrichment recovery losses; phosphatase inhibitors essential at lysis |
| Enrichment-coupled PRM (ubiquitylomics, diGLY) |
Cell lysate |
1–5 mg total protein per sample |
Add 20 mM NEM to lysis buffer immediately before use; ship frozen pellets on dry ice |
| PRM + SIS absolute quantification |
Any — cells, tissue, plasma, biofluids |
50–200 μg (direct); 500 μg–2 mg (enrichment-coupled) |
SIS peptide synthesis lead time 3–5 weeks; confirm target sites before initiating synthesis. Provide 3 biological replicates minimum for calibration curve characterization |
| PRM cohort-scale monitoring |
Serum, plasma, tissue (same matrix across cohort) |
100–300 μL serum/plasma; 20–50 mg tissue per sample |
All samples must be collected and processed with identical protocols; batch variation is the primary source of error in large cohort PRM studies. Ship on dry ice with freeze-thaw history documented |
Representative PRM PTM Verification Data
The following illustrate the types of quantitative outputs generated by our PRM PTM workflows — chromatographic traces, fragment ion confirmation, and cross-condition quantification typical of project deliverables.
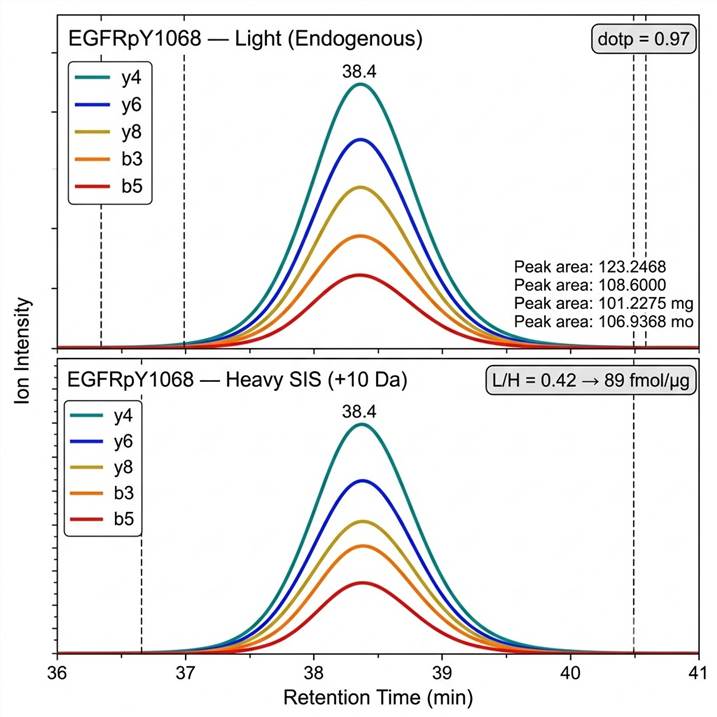
Fig. 1 — Skyline PRM chromatographic traces for a phosphopeptide (top: light endogenous; bottom: heavy SIS standard). Product ion peak areas for 5 y-ions and 3 b-ions shown. dotp = 0.97 confirms fragment ion pattern matches reference spectrum. Light/heavy ratio = 0.42 corresponds to 89 fmol/μg protein absolute phosphopeptide concentration at this site. Dashed lines mark the scheduled acquisition window.
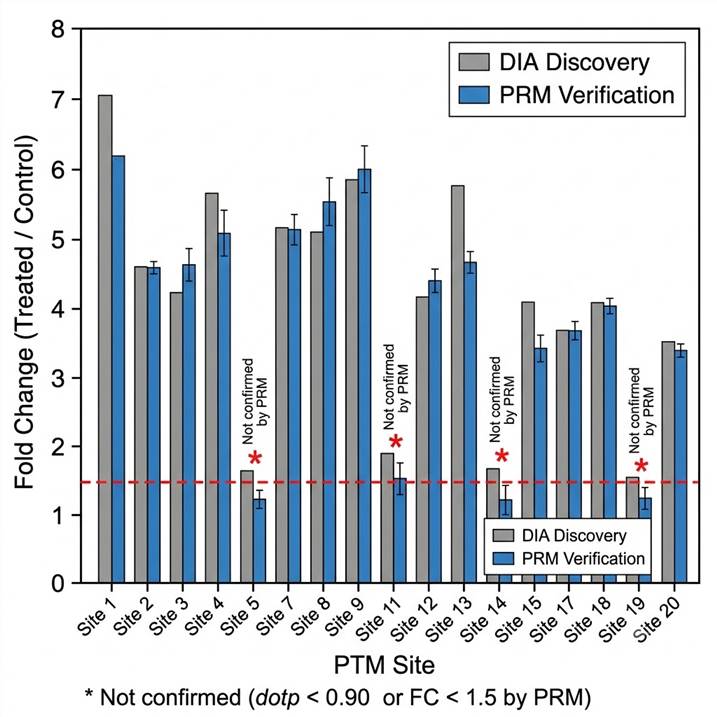
Fig. 2 — Fold-change comparison between DIA discovery (gray) and PRM verification (blue) for 20 candidate phosphosites. Sites above the horizontal dashed line (FC ≥1.5) are considered confirmed as regulated. 16 of 20 candidate sites are confirmed by PRM; 4 sites (red asterisks) do not replicate — illustrating the essential role of targeted verification in reducing discovery false positives before downstream investment.
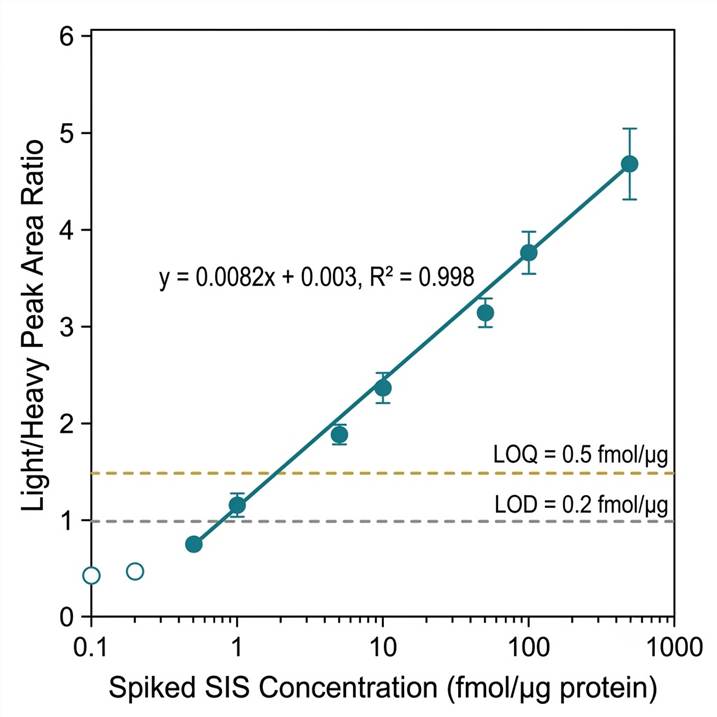
Fig. 3 — SIS peptide calibration curve for absolute quantification of a target phosphopeptide. X-axis: spiked concentration (fmol/μg); y-axis: heavy/light peak area ratio. Linear range: 0.5–500 fmol/μg (R² = 0.998); LOD = 0.2 fmol/μg; LOQ = 0.5 fmol/μg. These performance metrics are established for each target site in SIS absolute quantification projects.
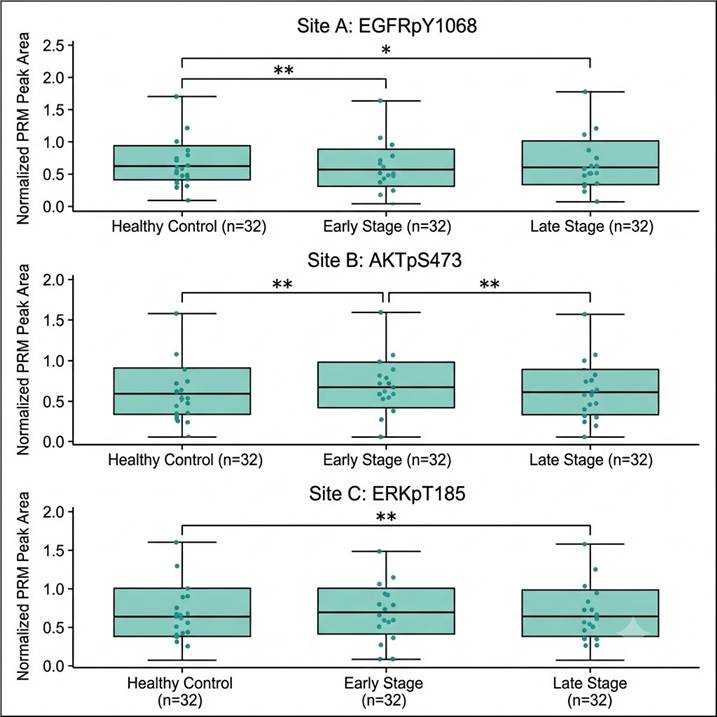
Fig. 4 — Cohort-scale PRM monitoring of a verified phosphosite panel (8 sites) across 96 clinical research samples (healthy control n=32, disease early-stage n=32, late-stage n=32). Each boxplot shows normalized peak area across the cohort group. Three sites show statistically significant differences between groups (p ≤0.05, Kruskal-Wallis) — illustrating the statistical power achieved by applying a validated PRM assay to an adequately powered cohort.
Case Study — PRM Enables Site-Specific Phosphorylation Quantification for Mathematical Modeling of EGF Signaling Dynamics
Reference: Dakup PP, Feng S, Shi T, et al. Targeted quantification of protein phosphorylation and its contributions towards mathematical modeling of signaling pathways. Molecules. 2023;28(3):1143. DOI: 10.3390/molecules28031143 (CC BY 4.0, PMC9919559)
Background & Scientific Question
Quantitative mathematical models of cell signaling pathways — ordinary differential equation (ODE) models that simulate the dynamics of kinase activation, phosphorylation propagation, and feedback regulation — require precise, time-resolved quantitative measurements of specific phosphorylation events. The question was: can PRM (and its predecessor SRM) provide the reproducible, multiplexed, site-specific phosphorylation quantification with sufficient temporal resolution and precision to parameterize and validate mechanistic ODE models of EGF receptor signaling?
This represents one of the most demanding PTM quantification use cases — not just detecting fold-changes, but providing absolute-scale time-course data precise enough to constrain model parameters. The study systematically reviewed how targeted MS-based phosphorylation quantification (SRM and PRM) has been applied in this context across multiple signaling pathway modeling projects.
Methods & Results
The review documented the use of SRM and PRM to quantify phosphorylation dynamics at 10–50 defined sites in the EGFR, MAPK/ERK, PI3K/AKT, and JAK/STAT pathways with temporal resolution from minutes to hours after growth factor stimulation. Key findings directly relevant to PRM PTM verification service design:
PRM on Q-Orbitrap platforms enabled simultaneous monitoring of 50–100 phosphosites with sub-femtomole sensitivity and inter-run CV of 5–12% — sufficient for ODE model parameterization. Absolute quantification using AQUA/SIS peptide standards provided site concentration data in molecules per cell, enabling direct comparison between experimental measurements and model predictions at the same quantitative scale. Enrichment (IMAC) upstream of PRM extended detection into the low-attomole range for low-abundance signaling phosphosites. The data demonstrated that PRM closes the gap between the precision of immunological assays (high but antibody-limited) and global discovery MS (broad but variable) — providing reproducible, multiplex site-specific data at a scale that mechanistic signaling studies require.
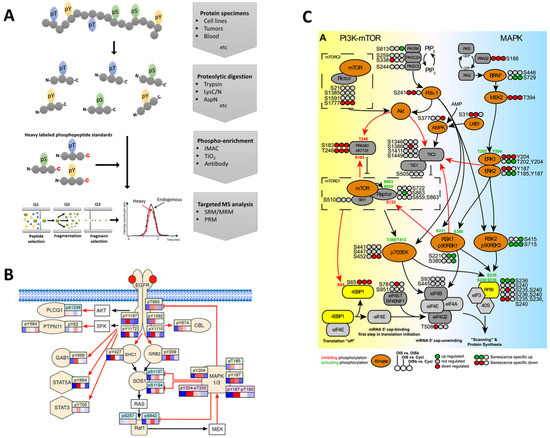
Adapted from Dakup et al. 2023, Molecules 28:1143, CC BY 4.0. Illustrates targeted PRM/SRM-based phosphorylation time-course data used to parameterize mathematical signaling models — a high-precision PRM application requiring site-specific, absolute-scale quantification.
References
- Peterson AC, Russell JD, Bailey DJ, Westphall MS, Coon JJ. Parallel reaction monitoring for high resolution and high mass accuracy quantitative, targeted proteomics. Mol Cell Proteomics. 2012;11(11):1475-1488. doi.org/10.1074/mcp.O112.020131
- Gallien S, Duriez E, Crone C, et al. Targeted proteomic quantification on quadrupole-orbitrap mass spectrometer. Mol Cell Proteomics. 2012;11(12):1709-1723. doi.org/10.1074/mcp.O112.019802
- Ronsein GE, Pamir N, von Haller PD, et al. Parallel reaction monitoring (PRM) and selected reaction monitoring (SRM) exhibit comparable linearity, dynamic range and precision for targeted quantitative HDL proteomics. J Proteomics. 2015;113:388-399. doi.org/10.1016/j.jprot.2014.10.017
- Bourmaud A, Gallien S, Domon B. Parallel reaction monitoring using quadrupole-Orbitrap mass spectrometer: Principle and applications. Proteomics. 2016;16(15-16):2146-2159. doi.org/10.1002/pmic.201500543
- Dakup PP, Feng S, Shi T, Jacobs JM, Wiley HS, Qian WJ. Targeted quantification of protein phosphorylation and its contributions towards mathematical modeling of signaling pathways. Molecules. 2023;28(3):1143. doi.org/10.3390/molecules28031143
FAQs — PRM PTM Verification
How many PTM sites can be monitored in a single PRM run, and how does this scale with sample throughput?
A typical scheduled PRM method can monitor 50–150 modified peptide precursors per 60–90 min LC run, depending on peak width, scheduled acquisition window, required fill time per target, and MS2 resolution setting. For projects requiring more sites simultaneously, the target list is distributed across multiple complementary runs with different retention time windows, or a two-tier strategy is used: broad DIA for the full site list, with PRM focused on the top 50–100 highest-priority verification targets. Sample throughput scales linearly — each additional sample requires one additional LC-MS/MS injection. For cohort-scale projects (50–200+ samples), we implement batch-controlled workflows with QC pool injections every 10–15 samples to monitor assay stability and correct for systematic drift across the analytical run. Samples are randomized within and across batches by condition to prevent confounding batch effects with biological effects.
What is a dotp score and why does it matter for PRM PTM verification?
The dot product (dotp) score in Skyline is a cosine similarity measure between the observed product ion ratio pattern in your sample and a reference spectrum — either from a library entry or from a synthetic peptide standard injection. A dotp of 1.0 means the observed fragment ion pattern is identical to the reference; a dotp of 0.9 means ~90% pattern match. We apply a minimum dotp threshold of ≥0.90 for all PRM PTM verification projects. This threshold matters for two reasons: first, it confirms that the detected signal corresponds to the expected modified peptide and not a co-eluting interferent at the same precursor mass; second, it validates the modification site localization — because a peptide carrying a phosphate at S1 rather than S2 will produce a different b/y ion pattern, and a low dotp will flag this as inconsistent with the expected modification position. Sites failing the dotp threshold are flagged for manual inspection; if interference is confirmed, we report that the site could not be quantified in that matrix, rather than reporting a potentially incorrect fold-change value.
Do I need SIS (stable isotope standard) peptides for PRM PTM verification, or can relative quantification be done without them?
SIS peptides are required only when absolute quantification (molar concentration, copies/cell, or fractional site occupancy in defined units) is the goal. For relative quantification — confirming that a discovery-identified site is up- or down-regulated between conditions by a defined fold-change — SIS peptides are not required. We can perform relative PRM verification using only the endogenous modified peptide intensities, normalized by a protein-level reference peptide or by total peptide signal. The relative approach is sufficient for most discovery verification projects and substantially reduces cost and timeline by eliminating the synthesis lead time. If you later decide that absolute quantification is needed for specific confirmed sites, SIS standards can be introduced for a targeted follow-up experiment on the priority sites. We advise on whether relative or absolute quantification is scientifically necessary for your specific project goals during project consultation.
How long does PRM PTM method development take, and what is the typical project timeline?
Project timeline depends on whether SIS peptides are required and the complexity of the target list. For a standard relative PRM verification project (20–80 sites, no SIS, using existing samples): method development from discovery data to first acquisition typically takes 5–10 business days; data acquisition and analysis 5–10 additional business days; total project delivery approximately 3–4 weeks from sample receipt. For SIS absolute quantification projects: SIS peptide synthesis and quality verification add 3–5 weeks to the timeline; total project delivery is typically 6–9 weeks from sample receipt. For enrichment-coupled PRM (where IMAC or diGLY IP is applied before acquisition): enrichment protocol validation adds 5–7 days. For cohort-scale projects (50+ samples): data acquisition scales approximately as 2–3 days per 20 samples depending on run length; total project delivery for a 100-sample cohort is typically 8–14 weeks including method development, acquisition, and statistical analysis. We provide a project-specific timeline and milestone plan when you submit your inquiry.
Can PRM be used for PTM types other than phosphorylation?
Yes — PRM is applicable to any PTM that produces a defined mass shift detectable at the peptide level and can be stably maintained through sample preparation and LC-MS/MS analysis. We have established PRM workflows for phosphorylation (Ser/Thr/Tyr), ubiquitylation (K-ε-GG remnant, +114.04 Da), acetylation (Lys, +42.01 Da), methylation (mono/di/tri-methyl Lys and Arg), crotonylation (+68.03 Da), succinylation (+100.02 Da), lactylation (+72.02 Da), N-terminal modifications (acetylation, formylation), deamidation (Asn → Asp, +0.98 Da), and oxidation (Met, +16.00 Da). Labile modifications require specific considerations: O-glycosylation requires EThcD or ETD fragmentation rather than HCD to preserve the glycan during MS/MS; S-nitrosylation requires specific pre-analytical trapping (biotin-switch or RAC) and immediate processing after lysis. For modifications with mass shifts close to other common PTMs, we specify the minimum Orbitrap resolution needed to resolve them and confirm feasibility before method development begins.